Sharmistha Dutta Choudhury*,
Praveen Vir,
Jyotirmayee Mohanty,
Achikanath C. Bhasikuttan and
Haridas Pal*
Radiation & Photochemistry Division, Bhabha Atomic Research Centre, Mumbai 400 085, India. E-mail: sharmidc@barc.gov.in; hpal@barc.gov.in
First published on 8th January 2016
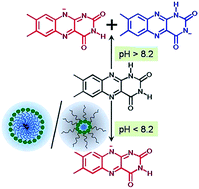
This study reveals the intriguing photophysics of lumichrome (LC) in two types of organized assemblies, namely, normal micelles and reverse micelles, formed by the cationic surfactant, benzyldimethylhexadecylammonium chloride (BHDC). Although LC exists in alloxazine form at around neutral pH in aqueous solutions, in BHDC micelles and reverse micelles under similar pH conditions, LC undergoes selective deprotonation at its N-1 position to generate LC anion in the tautomerically stabilized isoalloxazine form (N10 anion). Considering that deprotonation at both N-1 and N-3 positions of LC are equally feasible (similar pKa) in water at high pH, the preferential formation of N10 anion rather than N3 anion is a unique phenomenon realized in BHDC organized assemblies. This selective prototropism occurs due to combined electrostatic effects of the cationic head groups of BHDC and steric constraints that determine the orientation of LC at the micellar interface. The study also reveals that despite being formed by the same surfactant, BHDC micelles and reverse micelles possess different interfacial structures and hydration characteristics that induce distinct photophysical changes of LC in the two assemblies.
![]() | ||
Scheme 1 Molecular structures of (A) lumichrome (LC) and (B) benzyldimethylhexadecylammonium chloride (BHDC). |
In the present study, we have focused on the photophysics of this interesting molecule, LC, under confinement in normal micelles (in water) and reverse micelles (in benzene), formed by the cationic surfactant, benzyldimethylhexadecylammonium chloride (BHDC, Scheme 1). Encapsulation within organized assemblies often alters the properties of chromophoric guest molecules due to the effect of restricted microenvironments, electrostatic interactions of the surfactant head groups, slower solvation dynamics around the guest chromophore and other nonspecific, noncovalent interactions.14–16 Organized assemblies like micelles and reverse micelles are also widely used as nanoreactors and nanocages for the supramolecular modulations of guest properties, as these systems can satisfactorily mimic biological environments.17
The BHDC surfactant used in this study is a well-characterized long chain amphiphilic molecule that self-organizes beyond a critical concentration of 0.48 mM (cmc) in water, to form spherical micelles.18 The nonpolar tails (hexadecyl units) of several BHDC molecules aggregate together in the micellar core region and the charged head groups (benzyldimethylammonium units) are arranged to face the aqueous medium, forming the micellar Stern layer. The aggregation number of BHDC micelles is typically in the range of 90–100 and the total hydrodynamic radius is reported to be about 24 Å.19 Considering that micelles formed by other cationic surfactants having the same length of hydrocarbon tail (C16H33–) as that of BHDC (like cetyltrimethylammonium bromide or cetylpyridinium chloride), have a total radius of about 22 Å and a core radius of about 15 Å, the thickness of the Stern layer in BHDC micelles may be expected to be in the range of 7–9 Å.20 So it is quite reasonable to assume that the interfacial region of BHDC micelles can easily accommodate the LC molecule that has an approximate length of 10.6 Å and width of 5.2 Å (dimensions shown in Scheme 1).21
In a nonpolar solvent like benzene, BHDC molecules organize in a reverse manner with the hexadecyl tails facing the bulk solvent and the charged head groups pointing inwards, resulting in the formation of reverse micelles.22,23 Literature reports suggest that in micellar assemblies the benzyl group of BHDC resides on the surface and is more or less parallel to the interface, whereas in reverse micelles the benzyl group is directed toward the nonpolar chain and the bulk solvent, benzene.19,24
An interesting property of the reverse micelles is their ability to hold fairly large amounts of water within their inner core. The internal water pool is characterized by the parameter, w0, defined as the ratio of the concentration of water to the concentration of the surfactant (w0 = [water]/[BHDC]).14,25 The properties of water inside reverse micelles are markedly different from bulk water and depend significantly on the distance from the surfactant interface.26,27 At least two types of water populations are present inside the water pool; a shell of “bound” water molecules that are strongly associated by hydrogen bonding with the polar head groups of the surfactants, and “free” water molecules that exist deep inside the water pool when the hydration of the surfactant head groups becomes saturated. The extent of free water in the reverse micelle increases over the fraction of bound water, upon increasing the w0 value.26 The size of the reverse micelles and their inner water pool increases gradually on increasing the w0 value. For BHDC reverse micelles having w0 values of 10, 20 and 40, the aggregation numbers are reported to be 292, 677 and 1890, respectively, while the radius of the water pools are reported to be 27.5 Å, 45.9 Å and 81.5 Å, respectively.23 Thus, the water pools sizes in BHDC reverse micelles are also large enough to provide the space for accommodating LC molecules (dimensions shown in Scheme 1) at the interfacial regions of these microheterogeneous assemblies.
The aim of our present work has been to understand whether the distinct structures of micelles and reverse micelles formed by the same surfactant BHDC, can provide an opportunity to explore and compare how these two different organized assemblies and the nature of their charged interfaces affect the excited-state properties and prototropic behavior of LC chromophore, when it is confined within these assemblies. To the best of our knowledge such a comparative study on the photophysics of LC in the micelles and reverse micelles of the same surfactant has not been attempted in any of the previous studies. Our studies reveal that both the above organized media surprisingly induce the selective formation of the isoalloxazine anion form of LC (N10 anion) although only the neutral alloxazine form of LC is stable in bulk aqueous media, at a pH value lower than the pKa value of 8.2 for the dye. This remarkable phenomenon has been investigated in detail and the various emissive species of LC that exist in BHDC micelles and reverse micelles under different w0 conditions have been characterized, by the analysis of the time-resolved area normalized emission spectra, to establish the mechanistic details of their formation. Laser flash photolysis studies have also been performed to identify the non-emissive excited-states of LC in these heterogeneous media. Detailed discussions on the intriguing aspects of LC prototropism, unfolded by the present study, are systematically provided in the following sections.
The pH of the water used for preparing the experimental solutions was adjusted by using dilute HCl and NaOH solution in small steps and measured using a pH-meter, model CL/46 from Toshcon, India. Buffering agents were not used, to avoid any undue interaction of the added chemicals with the LC dye. For preparing the micelle and reverse micelle solutions, the pH of water was maintained at 5.9. At this pH, LC exists predominantly in the neutral alloxazine form, in bulk water. All solutions were freshly prepared prior to the experiments to eliminate any possible degradation of the samples. All experiments were performed at 25 °C.
Absorption spectra were recorded with a Jasco UV-vis spectrophotometer (model V-650). Steady-state fluorescence spectra were measured with a Hitachi spectrofluorimeter (F-4510). Time-resolved fluorescence measurements were carried out using a time-correlated single photon counting (TCSPC) instrument (Horiba Jobin Yvon, UK), where samples were excited by the light pulses from a nano-LED source (374 nm or 445 nm; repetition rate 1 MHz) and the fluorescence was detected using a PMT based detection module (model TBX4). The instrument response function (IRF) of the present setup is about 185 ps. Measurements were carried out at magic angle configuration to eliminate contribution of the rotational depolarization of LC on the observed fluorescence decays. The fluorescence decay traces were analyzed by reconvolution method, considering either mono-exponential or multi-exponential functions. The quality of the fits and consequently the mono-/multi-exponential natures of the decays were judged by the reduced chi-square (χ2) values and the distribution of the weighted residuals among the data channels. For a good fit, the χ2 value was close to unity and the weighted residuals were distributed randomly among the data channels.28 For the construction of the time-resolved area normalized emission spectra (TRANES), the fluorescence decays were first recorded over the entire emission spectra of LC in the studied media at 10 nm intervals. These fluorescence decays were fitted to a tri-exponential decay function and the fitted decays were scaled with the steady-state fluorescence intensities following the usual procedure.29 The time-resolved emission spectra were then constructed using these intensity scaled decays and were subsequently normalized to equal area under the curves to generate the TRANES.30 Laser flash photolysis experiments were carried out using a transient kinetic spectrometer (Edinburgh, model LP920-K). Briefly, the third harmonic output (355 nm, 15 mJ, 35 ps) from a Nd:YVO4/YAG laser (model PL2241C, Ekspla) was used to excite the samples and a 450 W pulsed Xe lamp was used as the monitoring light source, for the kinetic spectrometric detection of the transients. The samples were purged with Ar prior to the experiments.
Fig. 1B shows the emission spectra of LC in water (pH 5.9) and in the presence of increasing BHDC concentrations, on excitation at 415 nm (where absorbance changes are negligible). It is observed that the emission intensity of LC around 470 nm, in aqueous solution, gradually decreases and a new emission band appears with maximum around 507 nm, as the BHDC concentration is increased. Inset to Fig. 1B shows a plot of the fluorescence intensity at 507 nm versus the BHDC concentration in the solution. A sharp increase in the intensity is observed at a BHDC concentration of 0.49 mM that matches well with the reported cmc value for the formation of BHDC micelles.18 Correlating this result with the large changes in the absorption and fluorescence spectra, it may be inferred that formation of BHDC micelles leads to some interesting changes in the nature of the LC chromophore as it is incorporated into the micellar assembly.
With regard to the observed absorption and fluorescence spectral features of LC in BHDC micellar medium, it is important to mention the recent study by Maity et al. on the photophysics of LC in different kinds of anionic and cationic micelles.9 As reported by these authors, the absorption band of LC decreases and its fluorescence intensity for 350 nm excitation light undergoes a quenching, on increasing the concentration of the surfactants, including BHDC, beyond their cmc values. In the present study, we observe a similar decrease in the main absorption band of LC along with the development of a new shoulder band at around 450 nm and an isosbestic point at 415 nm (cf. Fig. 1A), which are not explicitly mentioned in the paper by Maity et al. Our observation suggests the formation of multiple chromophoric species of LC in solution, in the presence of BHDC. For fluorescence spectral measurements, we selectively excited the sample at the isosbestic point (415 nm) and observed that the fluorescence intensity of the usual emission band of LC at around 470 nm undergoes a strong quenching, as reported by Maity et al., but there is a development of another new emission band with maximum around 507 nm (cf. Fig. 1B), a feature not indicated or explored in the previous study. To be mentioned here that when the sample was excited at the main absorption band of LC (350 nm), a clear quenching of the 470 nm emission band was observed with increasing BHDC concentration (results not shown), in accordance with the previous report.9 Our observations thus do not contradict the results reported by Maity et al. but brings out new and intriguing features that have been explored elaborately in the present study and are discussed in the subsequent sections.
Considering that multiple absorbing species of LC are formed in solution in the presence of BHDC surfactant, it is expected that the emission spectra of LC in BHDC solution would be largely dependent on the excitation wavelength, because different chromophoric species would be excited preferentially or selectively on using different excitation wavelengths. Thus, for further understanding of the present system, emission spectra of LC were recorded with different excitation wavelengths, keeping the BHDC concentration constant at 4 mM, which is much above the cmc of the surfactant (Fig. 2). On excitation at 350 nm, the major emission peak is observed at 470 nm with a shoulder band at around 500 nm (trace 1). On excitation at 400 nm, the intensity of the emission band around 500 nm increases such that it appears as the main peak (∼515 nm) while the 470 nm band appears as a shoulder (trace 2). On excitation at 450 nm (corresponding to the long wavelength absorption in Fig. 1A), a single emission band is observed with maximum around 520 nm (trace 3). The emission spectrum of LC in pure water (excitation wavelength 350 nm) has a single band with maximum around 470 nm and is shown in Fig. 2 for a comparison (trace 6). From these results, it is quite evident that the longer wavelength emission band of LC (∼500–520 nm) develops exclusively in the micellar medium.
The excitation spectra of LC in BHDC micelles monitored at two emission wavelengths, 450 nm and 550 nm, are also shown in Fig. 2. These emission wavelengths are chosen instead of the emission maxima (470 and 520 nm) to minimize the overlapping contributions of the species responsible for the 470 and 520 nm emission bands. The excitation spectrum of LC monitored at 450 nm (trace 4), shows a prominent peak at 355 nm and a shoulder at 390 nm. This spectrum is only marginally different from the excitation spectrum of LC monitored in pure water for the same emission wavelength (trace 7). The excitation spectrum monitored at 550 nm in micellar medium is, however, significantly different from the spectrum in pure water (excitation spectrum in water monitored at 550 nm is similar to trace 7) and shows two new and well-defined peaks around 335 nm and 420 nm, respectively (trace 5).
To comprehend the intriguing emission and excitation spectral properties of LC in BHDC micelles, we examined the spectral characteristics of LC in water under different pH conditions. The absorption spectra of LC at pH 5.9, 8.6 and 10.4 are presented in Fig. 3. At pH 5.9 the predominant absorbing species of LC is the neutral alloxazine form having two independent π to π* transitions, as also depicted in Fig. 1 and discussed before. On increasing pH, the absorption spectrum changes markedly, with new peaks appearing at 345 nm and 395 nm along with a shoulder band around 450 nm. These spectral changes are attributed to the overlapping absorptions of various co-existing prototropic forms of LC in solution, whose chemical structures are shown in Scheme 2.4–6 The two anion forms (N1 and N3) are reported to have similar pKa values of 8.2.6 Moreover, the N1 anion that is formed in the initial alloxazine form of LC is believed to undergo rapid tautomerization to the N10 anion, which is structurally related to the isoalloxazine form of LC (Scheme 1).4,5 Thus, the absorption spectrum at pH 10.4 is effectively the combined absorptions of both N3 and N10 anions.
![]() | ||
Fig. 3 Absorption spectra of LC (5.6 μM) in aqueous solution at pH 5.9 (1, blue), 8.6 (2) and 10.4 (3). |
Fig. 4A shows the emission spectra of LC at the above three pH conditions. On excitation at 350 nm, LC at pH 5.9, shows a single emission band with maximum at around 470 nm (trace 1), corresponding to the neutral alloxazine form. However, at higher pH, two new emission bands are observed, on excitation at 350 nm, one with a slightly blue shifted emission band at around 450 nm and the other with a red shifted emission peak at around 506 nm (traces 2 and 3), due to the combined emissions from the two anionic forms, N3 and N10. On excitation at 450 nm (the wavelength at which a shoulder band is seen in the absorption spectra at pH 8.6 and 10.4; cf. Fig. 3), a single emission band is observed at high pH with maximum at around 520 nm (trace 5). The corresponding emission at pH 5.9 with 450 nm excitation is quite negligible (trace 4, Fig. 4A) compared to that at higher pH (trace 5, Fig. 4A). It may be mentioned here that flavin chromophores having the isoalloxazine structure, (for example riboflavin) exhibit a characteristic single emission band with maximum around 520 nm.21 Hence, the emission band with maximum around 506–520 nm as observed in the present study at higher pH conditions is conclusively assigned to the N10 anion of LC (isoalloxazine structure), whose population is almost negligible at pH 5.9 and increases largely on increasing the pH of the solution.4
To further delineate the spectral features of different prototropic forms of LC, excitation spectra were recorded at two different emission wavelengths, 450 and 550 nm, and are presented in Fig. 4B. At pH 5.9, the excitation spectra monitored for 450 nm and 550 nm emissions are quite similar (trace 1) and match well with the absorption spectrum for the neutral form of LC. At higher pH, the excitation spectrum monitored for 450 nm emission shows two excitation bands around 350 nm and 390 nm (traces 2 and 3). Although the positions of the two bands are close to the peak and shoulder bands of the neutral form of LC (trace 1), there are some distinct differences. Notably, the resolution of the bands is much better at higher pH, and also at pH 10.4 the intensity of the 390 nm band becomes higher than the 350 nm band, a feature opposite to that observed for the neutral form of LC at pH 5.9. Knowing that the isoalloxazine structure has a single emission band at 520 nm, the 450 nm emission band at higher pH and the corresponding excitation spectrum is justifiably assigned to the N3 anion (alloxazine structure).4
Unlike the excitation spectra monitored at 450 nm, the spectra recorded for emission at 550 nm shows two prominent excitation bands around 345 nm and 430 nm (traces 4 and 5, Fig. 4B). This spectrum corresponds well with the reported absorption spectrum of the isoalloxazine chromophore, which further confirms that the emission at 550 nm arises from the N10 anion of LC.
Based on the understanding about the spectral characteristics of various prototropic forms of LC, it is now possible to interpret the absorption and emission spectra observed in BHDC micelles. The increased absorption beyond 450 nm in Fig. 1 can be attributed to the presence of the N10 anion of LC formed in the micellar medium. Similarly, the emission at 520 nm (traces 2 and 3, Fig. 2) and the corresponding excitation spectrum (trace 5, Fig. 2) can also be attributed to the same N10 anion.
It should be mentioned in the present context that the absorption and fluorescence changes of LC observed in BHDC micelles can also be thought to arise due to the tautomerization of the neutral alloxazine form of LC to the neutral isoalloxazine form, because it is reported that both the neutral and anionic forms of the isoalloxazine structure have similar absorption and fluorescence spectral characteristics.10 However, it is difficult to envisage such a tautomerization in the present conditions because there is no special driving force that one can think of for the micellar microenvironment to preferentially stabilize the neutral isoalloxazine form of LC, a tautomeric structure that is otherwise not favored in aqueous solution. On the other hand, considering the cationic charge of the BHDC head groups, it is quite easy to conceive that the micellar medium can favorably drive the deprotonation of LC molecules that are located at the interfacial region adjacent to the BHDC head groups, since the positively charged head groups will provide a large electrostatic stabilization for the generated anions.9 Though both N1 and N3 anions of LC can be formed by the initial deprotonation of LC, the N1 anion can quickly tautomerize to the N10 anion, displaying the longer wavelength absorption and fluorescence features discussed earlier. We therefore strongly feel that it is not the neutral isoalloxazine form but the N10 anion of LC, whose formation is assisted by the BHDC micelle, that is actually responsible for the development of the 450 nm absorption band (cf. Fig. 1) and 520 nm emission band (cf. trace 2 and 3, Fig. 2).
Keeping in line with the reported absorption and emission spectral characteristics of different prototropic forms of LC, the emission band at 470 nm (trace 1, Fig. 2) and the corresponding excitation spectrum (trace 4, Fig. 2) are assigned primarily to the neutral alloxazine form of LC. The distinct emission spectral features observed for LC in BHDC micellar media with different excitation wavelengths (Fig. 2) are evidently due to the presence of multiple species in the solution with overlapping emission characteristics and the preferential and/or selective excitation of different species at different excitation wavelengths. The minor difference in the absorption/emission maxima of the neutral form in micellar media and aqueous solution is believed to arise because of the relatively nonpolar microenvironment around LC in BHDC micelles. However, it is also possible that the marginally higher intensity of the 390 nm shoulder band in the excitation spectrum of LC, for 450 nm emission in micellar medium (trace 4, Fig. 2), compared to that in water (trace 7, Fig. 2) could be due to the presence of a small fraction of the N3 anion of LC, which also has an overlapping emission with that of the neutral form of LC. This is also suggested by the comparison of trace 4, Fig. 2 with the trace 3, Fig. 4B for the N3 anion in water at pH 10.4. To resolve the issue of multiple emitting species in micellar media and to determine whether the N3 anion of LC is also formed along with the N10 anion, in micellar system, fluorescence decay traces of LC were recorded in water (at pH 5.9 and 10.4) and in BHDC micelles (pH 5.9), at different excitation and emission wavelengths. Representative decay traces are shown in Fig. 5 and the corresponding decay parameters as obtained by the analysis of decays as a sum of exponentials are presented in Table 1.
Medium | λem (nm) | λem (nm) | A1 (%) | τ1 (ns) | A2 (%) | τ2 (ns) |
---|---|---|---|---|---|---|
a The fluorescence decays are fitted by considering either single or bi-exponential functions; I(t) = ∑ai![]() ![]() |
||||||
Water (pH 5.9) | 374 | 450 | 100 | 2.6 | — | — |
550 | 95 | 2.6 | 5 | 4.5 | ||
Water (pH 10.4) | 374 | 450 | 92 | 1.4 | 8 | 2.7 |
550 | 15 | 1.5 | 85 | 4.5 | ||
Micelle | 374 | 450 | 38 | 0.67 | 62 | 2.6 |
550 | 61 | 6.1 | 39 | 2.6 | ||
445 | 550 | 100 | 6.1 | — | — |
In aqueous medium at pH 5.9, the decay trace monitored at 450 nm (with 374 nm excitation) is single exponential in nature with a decay time of about 2.6 ns. This corresponds to the fluorescence lifetime of the neutral alloxazine form of LC.2,4,7 The corresponding decay at 550 nm is bi-exponential in nature where the major component (95%) with 2.6 ns decay time is certainly due to the neutral alloxazine form of LC. The minor 4.5 ns component in this decay matches well with the reported lifetime of the N10 anion and possibly arises due to the formation of a small extent of the anionic species by hydrogen bonding interaction of the solvent with LC, as also suggested in the literature.7 At pH 10.4, the decay traces (with 374 nm excitation) are bi-exponential for both 450 nm and 550 nm emissions. The fluorescence lifetime components at 450 nm are 1.4 ns (92%) and 2.7 ns (8%) whereas at 550 nm the components are 1.5 ns (15%) and 4.5 ns (85%). The major component of 1.4 ns observed at 450 nm is in accordance with the reported lifetime of the N3 anion of LC that emits in this wavelength region.4,7 The small contribution of the 2.7 ns lifetime component could be due to the overlapping emission from the residual neutral form of LC present in the solution. At 550 nm, the major component of 4.5 ns corresponds to the lifetime of the N10 anion of LC, as expected. The small contribution of the 1.5 ns lifetime component is assigned to the overlapping emission from the N3 anion form at 550 nm.
In micellar medium, the fluorescence decay traces of LC are quite different compared to that in water at similar pH condition (pH 5.9). At 450 nm (excitation wavelength 374 nm), the decay trace is bi-exponential in nature, with fluorescence lifetime components of 2.6 ns (62%) and 0.67 ns (38%). The 2.6 ns component can be readily assigned to the neutral alloxazine form of LC present in the aqueous phase, (LC)aq. However, the 0.67 ns lifetime undoubtedly differs from the lifetime of the N3 anion (∼1.4 ns) that is expected to emit in this wavelength region. Previous studies have reported that the fluorescence lifetime of LC is quite sensitive to the nature of the solvent medium. For example, the fluorescence lifetime of LC is 0.45 ns in dioxane and 0.64 ns in acetonitrile medium.3 So the 0.67 ns lifetime component is most likely due to the neutral form of LC molecules that are present at the interfacial region of the BHDC micelles, (LC)micelle, and experience a relatively nonpolar microenvironment than bulk water. Since LC is weakly soluble in water, a distribution in the population of LC molecules is expected, with a fraction of LC being located in the micellar interface and another fraction remaining in bulk water. Accordingly, the emission at 450 nm has contributions from both of these neutral LC forms. The LC molecules present in bulk water emit with a lifetime of 2.7 ns while those present in the micellar interface have a lifetime of 0.67 ns. The lifetime data therefore clarifies that the emission around 450 nm in BHDC micelles corresponds to the neutral LC molecules present both in the micelle and aqueous phases. There is no indication of the presence of the N3 anion of LC (lifetime ∼ 1.4 ns) in the present system.
The fluorescence decay trace of LC in micellar medium at 550 nm (excitation wavelength 374 nm) is also bi-exponential in nature, with lifetime components of 2.6 ns (39%) and 6.1 ns (61%). The major component of 6.1 ns is considered to be due to the emission from the N10 anion of LC, as this anion form emits in this spectral region. The restricted microenvironment around the chromophore present in the micellar interface quite reasonably leads to the higher lifetime of the N10 anion in micellar medium (6.1 ns) compared to that in aqueous medium (4.5 ns). The smaller contribution of 2.6 ns in the fluorescence decay at 550 nm is understandably due to the neutral alloxazine form that remains in the bulk solution and is also excited significantly with 374 nm excitation light (cf. Fig. 2 and 4A). With an excitation wavelength of 445 nm, the N10 anion form is selectively excited (cf. Fig. 2 and 4A) and accordingly the decay trace at 550 nm is single exponential in nature with a decay time of 6.1 ns in BHDC micellar solution.
A better idea about the different emissive species of LC present in the BHDC micellar medium can be obtained from the analysis of time-resolved area normalized emission spectra (TRANES). TRANES is an elegant model-free method to identify the existence of different fluorophore populations in microheterogeneous environments or to understand the formation of intermediates in the excited-state processes like electron or proton transfer.30 The occurrence of N number of isoemissive points in the TRANES generally indicates the presence of (N + 1) emissive species in the system that may or may not be kinetically coupled. For three independent species, two clear isoemissive points can be observed in different time intervals only if their fluorescence lifetimes and emission bands are significantly different from each other. The TRANES for LC in aqueous medium at different pH conditions and in BHDC micelles are presented in Fig. 6.
The superimposed TRANES of LC in water at pH 5.9 (Fig. 6A) is consistent with the predominance of one emissive species, the neutral alloxazine form of LC. At pH 10.4, an isoemissive point is observed in the TRANES (Fig. 6B) that indicates the existence of significant populations of two different emissive species. In all probability, these two species are the anion forms N3 and N10 that are present in the solution at pH 10.4. In contrast to aqueous medium, in BHDC micelles, the TRANES of LC reveals two isoemissive points developed at different time windows. This suggests the existence of three different emissive species of LC in the micellar medium. In accordance with our previous discussions, it is thus confirmed that these three species correspond to the neutral alloxazine form of LC that is present in the bulk aqueous medium, (LC)aq, the neutral alloxazine form of LC that is present in the micellar interface, (LC)micelle, and the N10 anion form that is also present in the micellar interface.
Overall, the results discussed so far clearly show that although at pH 5.9 LC exists in the neutral alloxazine form in bulk water, in the presence of BHDC micelles, anionic species of LC are induced to be formed in the system. Moreover, although both the N3 and N10 anions have equal propensities for being formed in water at high pH conditions (beyond the pKa value of 8.2), the BHDC micellar medium surprisingly favors the formation of the N10 anion rather than the N3 anion of LC. This interesting prototropic transformation of LC in BHDC micellar medium is certainly an unusual phenomenon and can be rationalized by considering the nature of the micellar interface, mode of association of LC to the micelle and the specific interaction of the micellar interface with the LC chromophore.
The most probable orientations of LC molecules that reside in the micellar interface can be intuitively shown as in Scheme 3. The location of the dyes at the interfacial region is directly supported by the observation of slower rotational correlation times of LC in BHDC micelles compared to that in neat water (Note S2, and Fig. S4, ESI†). For LC molecules located at the micellar interface, deprotonation is driven by the electrostatic interaction of the resultant LC anion with the cationic head groups of BHDC. The population of LC molecules that remains in the bulk water does not undergo such a deprotonation at pH 5.9 and thus exists in the neutral alloxazine form. The selective formation of the N10 anion at the micellar interface rather than the N3 anion of LC is, definitely a remarkable observation and this intriguing phenomenon is suggested to arise due to steric constraints at the BHDC micellar interface, as conceptually depicted in Scheme 3.
![]() | ||
Scheme 3 Schematic of the prototropic equilibrium of LC in BHDC micelles favoring the formation of N10 anion. |
For the N3 anion, the negative charge is localized on ring C of the LC molecule. Due to the larger size of ring C with its substituent groups (compared to ring B), the interaction of the negative charge on N3 with the positively charged head groups of the BHDC micelle is expected to be relatively less as there is a steric constraint for the close placement of the positive and negative charge centres. It is thus understandable that the encapsulation of the N3 anion in the BHDC micelle and its stabilization by the Stern layer will not be that favorable and consequently the deprotonation of LC at the N3 position is not supported by the head groups of the BHDC micelles. The N1 anion of LC, on the other hand, undergoes a rapid tautomerization to the isoalloxazine form, thereby localizing the negative charge on the less crowded ring B as the N10 anion (Scheme 2). As a result, the negative charge on N10 can be placed quite close to the surrounding cationic head groups at the micelle rendering a much stronger electrostatic stabilization of the N10 anion. Moreover, the hydrophobic ring A can also be placed within the relatively nonpolar microenvironment of the micelle while the hydrophilic substituents in ring C remain well exposed to the bulk water outside. Due to such favourable orientation supported by complimentary hydrophobic and hydrophilic interactions, the prototropic equilibrium of LC shifts in favour of the N10 anion in the BHDC micellar medium although the pKa value for formation of both N3 and N10 anions is reported to be very similar in aqueous solution. The electrostatic stabilization, steric effects and the complimentary hydrophobic and hydrophilic interactions due to the specific orientation of LC at the micellar interface, together, lead to the preferential formation of the N10 anion, overcoming the possible shielding effects caused by the Cl− counter ions and the hydration water at the interfaces. The favourable deprotonation of different chromophoric dyes in the presence of cationic micellar assemblies, despite the possible shielding by counter ions and hydration water, is well documented in the literature.16,31 Recently, Maity et al. have also reported the strong binding affinity of LC with the micelles formed by cationic surfactants, possibly due to the similar effects as discussed for the present BHDC micelles.9
The emission spectra of LC in BHDC reverse micelles at various w0 values are presented in Fig. 8 (traces 1–5). At a w0 value of 0, the emission peak is observed at 437 nm along with a small shoulder at 505 nm. With increasing w0, the emission band around 437 nm gradually shifts to 447 nm and the shoulder band at 505 nm slowly develops as a clear band with increasing intensity, along with a small red shift. For the sake of comparison, it is to be noted that the emission spectrum of LC in water has its maximum at around 470 nm (trace 6) whereas in ethyl acetate LC shows a single emission peak at 437 nm (trace 7). These results clearly indicate that the microenvironment around the LC molecules in BHDC reverse micelles is significantly different from that in homogeneous solutions, either in relatively less polar solvent, ethyl acetate or in highly polar solvent, water. Moreover, the presence of the 505 nm shoulder band at w0 = 0 and its development as a clear band with increasing w0 clearly indicate the co-existence of multiple emissive species in the BHDC reverse micellar media.
Structurally, reverse micelles possess three different micro-phase regions, namely the nonpolar tail region, the interfacial region (constituted by the surfactant head groups with associated water) and the inner water pool. Accordingly, the LC molecules present in each of these microenvironments may be expected to exhibit different photophysical and prototropic behavior. Based on the spectroscopic studies of LC in aqueous medium at different pH conditions and those in BHDC micellar medium as presented earlier, the emission around 440 nm in reverse micelles is supposed to be arising from the neutral alloxazine form of the LC molecules. The excitation spectra monitored at 450 nm for w0 values of 0 and 20 (traces 1 and 3, Fig. 9) show two excitation peaks around 337 nm and 385 nm, which resemble with the spectral features observed for neutral LC molecules in a relatively nonpolar environment. The emission band observed around 505 nm (traces 1–5, Fig. 8) is attributed to the N10 anion form that arises from LC molecules residing at the interfacial region around the cationic head groups of BHDC. This is further supported by the excitation spectra monitored at 550 nm (traces 2 and 4 for w0 = 0 and 20, Fig. 9), that show a clear shoulder band around 450 nm in accordance with the absorption band of the N10 anion. It may be noted, however, that the excitation spectrum recorded at 550 nm in BHDC reverse micelles even at a high w0 value of 20 (trace 4, Fig. 9) is quite different from that observed for LC in micellar medium (trace 5, Fig. 2). The considerably lower intensity of the 450 nm band in the excitation spectrum of LC in BHDC reverse micelles compared to that in normal micelles clearly indicates that the extent of N10 anion formation is comparatively lower in the reverse micelle than in the normal micelle of BHDC. This can be explained on the basis of the differences in the properties of water present in the interfacial regions of micelles and reverse micelles, as discussed below.
In normal micelles, the organized assemblies are dispersed in bulk aqueous medium whereas in reverse micelles, the water molecules are tightly confined inside the organized structure. At low w0 values, the available water molecules inside the reverse micelles are entirely associated with the surfactant head groups and exist as “bound” water. With increasing w0 values, a water pool is gradually formed and “free” water molecules start accumulating deep inside the core of the water pool. A number of studies on solvation dynamics in micelles and reverse micelles of various surfactants have revealed that the relaxation time of water molecules in the Stern layer of micelles is about 180–550 ps, which is much slower than that of the water molecules in bulk water (310 fs) but is significantly faster than the relaxation of the structured water molecules in reverse micelles (8–9 ns).32 Thus, the mobility and hydration capacity of water molecules are expected to be higher in the interfacial region of normal micelles compared to that in reverse micelles.
The LC molecules present in the interfacial regions of micelles or reverse micelles undergo deprotonation under the influence of the positively charged head groups of BHDC. As already discussed in the previous section and depicted in Scheme 3, such deprotonation of LC at the interfacial region leads to the formation of the N10 anion of LC selectively through the tautomerization of the initially produced N1 anion of the dye. The preferential formation of the N10 anion rather than the N3 anion is due to the interplay of the electrostatic stabilization provided by the positively charged head groups of BHDC, the steric constraints imposed by the interfacial structure and the complimentary hydrophobic and hydrophilic interactions arising due to the specific orientation of the dye molecule at the interfacial region. In normal micelles, due to the presence of the surrounding bulk aqueous medium and the greater mobility of the water molecules in the interfacial region, the N10 anion can be suitably hydrated and stabilized. However, in reverse micelles, the confined water molecules cannot stabilize the anionic form of LC to any large extent. Hence the population of N10 anions formed in the BHDC reverse micelles is much less compared to that in BHDC micelles. With increasing water pool size, as the percentage of “free” water molecules within the reverse micelle increases, the stabilization of the N10 anion gradually becomes more favorable. This is evidenced by the increase in the emission intensity of the N10 anion form of LC around 505 nm with increasing w0 values (trace 1–5, Fig. 8).
The observation that the 450 nm band in the excitation spectrum of LC, for the 550 nm emission, has lower intensity in BHDC reverse micelles (trace 4, Fig. 9) compared to that in normal micelles (trace 5, Fig. 2), and the fact that the emission intensity of LC around 505 nm in the reverse micelle system increases with increasing w0 values (trace 1–5, Fig. 8), are also in accordance with our proposition for the formation of N10 anion rather than the alternative mechanism for the formation of neutral isoalloxazine form of LC, in the present organized media. Quite understandably, the anion form is increasingly stabilized with increasing mobility and hydration capacity of the surrounding water molecules on increasing the w0 values, as observed in the present study.
To further characterize the different prototropic forms of LC present in BHDC reverse micelles, fluorescence decay traces were recorded at the two emission wavelengths, 450 nm and 550 nm, for different w0 values. Representative decay traces are shown in Fig. 10 and the corresponding decay parameters are presented in Table 2.
w0 | λem (nm) | A1 (%) | τ1 (ns) | A2 (%) | τ2 (ns) | A3 (%) | τ3 (ns) |
---|---|---|---|---|---|---|---|
a The fluorescence decays are fitted by considering multiexponential functions; I(t) = ∑ai![]() ![]() |
|||||||
0 | 450 | 95 | 0.28 | 5 | 1.9 | — | — |
5 | 94 | 0.29 | 6 | 1.8 | — | — | |
10 | 95 | 0.27 | 5 | 1.9 | — | — | |
20 | 95 | 0.29 | 5 | 1.8 | — | — | |
40 | 96 | 0.28 | 4 | 1.9 | — | — | |
0 | 550 | 6 | 0.27 | 16 | 1.9 | 78 | 5.5 |
5 | 4 | 0.27 | 26 | 1.9 | 70 | 4.9 | |
10 | 4 | 0.27 | 24 | 1.9 | 72 | 4.9 | |
20 | 3 | 0.29 | 23 | 1.9 | 73 | 4.9 | |
40 | 4 | 0.27 | 22 | 1.9 | 75 | 5.0 |
The decay traces at 450 nm are bi-exponential in nature with a major decay component of about 0.28 ns (∼95%) and a minor component of about 1.9 ns (∼5%). The shortest component of 0.28 ns possibly corresponds to the neutral LC molecules that reside toward the tail regions of the surfactant molecules at the outer periphery of the reverse micelles. The decay constant of 1.9 ns is close to the fluorescence lifetime of the N3 anion form of LC in aqueous medium (1.4 ns). However, considering the low hydration capacity of the confined water in BHDC reverse micelles, the formation of N3 anion seems quite unlikely. The 1.9 ns component is therefore adjudged to be due to another co-existing population of neutral LC molecules that are present closer to the head group region of the reverse micelles and experience a slightly less nonpolar environment. Based on the observation that there are no significant changes in the decay parameters at 450 nm, with the changing w0 values, it can be further confirmed that the 1.9 ns component does not arise from the N3 anion form. If the 1.9 ns component corresponded to the N3 anion, its contribution should have gradually increased with the increase in w0.
The decay traces at 550 nm can be fitted to tri-exponential functions with the shortest component as 0.27 ns, intermediate component as 1.9 ns and the largest component in the range of 4.9–5.5 ns. The shortest component has only a minor contribution that remains more or less constant at all w0 values. This component can be reasonably assigned to the neutral LC molecules that reside toward the outer periphery of the reverse micelles and thus remain unperturbed by the changes in the inner water pool. Unlike the shortest lifetime component, a marginal decrease is observed in the contribution of the intermediate lifetime component (from 26% to 22%) along with a concomitant increase in the contribution of the longest lifetime component (from 70% to 75%), with the increasing w0 values. This observation is in agreement with the more facile conversion of the neutral form of LC at the interfacial region (decay time 1.9 ns) to the N10 anion (decay time ∼ 5 ns) with the increasing w0 values. The greater contribution of the longest decay component with gradually increasing w0 values is also concurrent with the higher emission observed from the N10 anion around 505 nm (Fig. 8) at high w0 values. That the lifetime of the N10 anion form is somewhat longer for w0 = 0 and deviates from the trend observed for the other w0 values is possibly because at w0 = 0 the anion is deprived of hydration due to the absence of water molecules around it.
The TRANES of LC in BHDC reverse micelles at different w0 values are presented in Fig. 11. At w0 = 0, a single isoemissive point is observed in the TRANES, which indicates the existence of two emissive species in the medium. These two species are proposed to be the neutral alloxazine form of LC and the un-hydrated N10 anions in contact with the surfactant head group. Although the neutral forms are indicated to exist in more than one nonpolar environment in the BHDC reverse micelle, having different lifetimes (0.27 ns and 1.9 ns, Table 2), they could not be distinguished separately in the TRANES analysis. This is possibly because of the strongly overlapping emissions from all the neutral LC molecules around 450 nm.
For BHDC reverse micelles with w0 = 5, again a single isoemissive point is observed (Fig. 11B). The two emissive species in this case are the neutral form and the hydrated N10 anion form of LC. At higher w0 values (w0 = 20), as the hydration of the N10 anion form increases, a second isosbestic point can be observed in the TRANES at somewhat longer times (Fig. 11C). This is proposed to be due to the fact that the strongly hydrated N10 anions exhibit a red shifted emission, causing the second isoemissive point to be observed in the TRANES.
By comparison of the results in BHDC micelles and reverse micelles, it is apparent that the positive charge of the surfactant head groups assists the deprotonation of the neutral LC to its anion form, even at a pH lower than the pKa value (∼8.2) of the dye. It is, however, indicated that the steric constraints imposed by the substituent groups of LC determines its orientation at the micellar interface in a specific manner which eventually dictates the type of anion (N10 anion rather than the N3 anion) that is stabilized in these organized media. Furthermore, the extent of hydration of the N10 anion and hence its relative population in the organized media is dependent on the structure and mobility of the surrounding water molecules at the interfacial region of these assemblies. As a consequence, the N10 anion of LC is quite readily formed in the BHDC micelle but its formation is relatively less facile in the BHDC reverse micelle system. In the latter case, however, formation of the N10 anion gradually becomes more favored as the w0 value is systematically increased for the system.
In water at pH 5.9 (Fig. 12A), the initial spectrum shows a sharp maximum at 370 nm and broad absorption bands in the 400–650 nm region. Based on literature reports, this spectrum can be assigned to the T–T absorption of the neutral triplet state of LC (3LC).1,33,34 It may be noted that at longer times the bands at 370 and 550 nm are reduced considerably while the absorption around 440 nm still remains significant. The decay traces of the transients at 370 nm and 440 nm in water at pH 5.9 are presented in panels I and II of Fig. 12, and are found to follow first order decay kinetics with decay times of about 2 μs and 18 μs, respectively. The long-lived species that predominantly absorbs at 440 nm is ascribed to a free radical that is formed from 3LC by the abstraction of hydrogen from water.1
The transient absorption spectra in water at pH 10.4 (Fig. 12B), resemble the spectra at pH 5.9 to a large extent, but the decay kinetics at 370 nm and 440 nm are considerably slower at this pH (decay times are 9 μs and 66 μs, respectively). Since at pH 10.4, the ground state species of LC are the N3 and N10 anions, it is plausible that the transient absorption spectra at this pH correspond to the triplet anionic species, 3LC−. Previous studies with 3-methyl lumichrome at various pH conditions have shown that the anionic triplet of this lumichrome derivative has absorption bands at 380 and 440 nm.33 Assuming that 3LC− also absorbs around 380 and 440 nm, the slower decay kinetics observed at higher pH can be ascribed to the characteristic anionic species. The spectra in micellar medium (Fig. 12C) are intermediate between the spectra observed in water at pH 5.9 and 10.4. This observation thus supports our earlier inference that BHDC micelles in fact induce the formation of LC anions. The decay times at 370 and 440 nm in the micellar medium are found to be 4 μs and 39 μs, respectively.
Fig. 13 shows the transient absorption spectra of LC in BHDC reverse micelles at various w0 values. In these cases too, the spectra show sharp maximum at 370 nm and broad absorption bands in the 400–650 nm region, corresponding to the T–T absorption of 3LC. The decay traces at 370 nm are more or less similar at all the w0 values (∼2 μs). This is in support of the contention that the transient species that predominantly absorbs at 370 nm is the neutral triplet state of LC, that resides in the nonpolar regions of the reverse micelle and hence is mostly unaffected by changes in the inner water pool. At w0 = 0, the decay trace at 440 nm is marginally slower (decay time 2.3 μs) than that at 370 nm. This suggests the existence of a different species in the medium. Based on the fluorescence results discussed before, this can be ascribed to the N10 anionic triplet of LC that is present in close contact with the BHDC head groups. At higher w0 values, the decay at 440 nm becomes increasingly slower with decay times of 5 μs and 15 μs at w0 = 10 and w0 = 20, respectively. Such a large increase in the decay times suggests that the higher mobility and availability of water molecules with increasing w0 value possibly facilitates the formation of free radicals from 3LC by the abstraction of hydrogen from water and that absorb in this spectral region. Moreover, since the 3LC− form also absorbs at 440 nm, the increase in decay times at this wavelength also presumably suggests that the anionic species are stabilized to a greater extent with increase in w0 values. The transient absorption results thus corroborate well with the results obtained from fluorescence measurements and supports our proposition about the induced prototropic transformations of LC in BHDC micelles and reverse micelles by the positively charged surfactant head groups.
Footnote |
† Electronic supplementary information (ESI) available: Notes S1 and S2 and Fig. S1–S4. See DOI: 10.1039/c5ra23562f |
This journal is © The Royal Society of Chemistry 2016 |