
Rapid detection of Enterobacter cloacae by immunomagnetic separation and a colloidal gold-based immunochromatographic assay
Xuan Zhang,
Jun Zhou,
Chundan Zhang,
Dijun Zhang and
Xiurong Su*
School of Marine Sciences, Ningbo University, Ningbo, Zhejiang Province 315211, P. R. China. E-mail: suxiurong@nbu.edu.cn
First published on 7th December 2015
Abstract
To establish the rapid detection of Enterobacter cloacae in food, immunomagnetic beads were prepared by coupling an anti-E. cloacae polyclonal antibody with magnetic beads. An immunochromatographic test strip was composited with an anti-E. cloacae monoclonal antibody marked by colloidal gold as the detection antibody, anti-E. cloacae polyclonal antibody as the test line, and donkey anti-mouse IgG secondary antibody as the control line. Immunomagnetic separation was combined with a colloidal gold-based immunochromatographic assay for the rapid detection of E. cloacae. The results showed that 102 CFU mL−1 E. cloacae could be detected using the immunochromatographic test strip after immunomagnetic separation. The sensitivity was 10 times higher than direct detection with an immunochromatographic test strip. With the immunochromatographic test strip, water samples spiked with E. cloacae yielded a negative result, whereas E. cloacae yielded a positive result with immunomagnetic separation. The proposed method enhances the rapid detection of E. cloacae in food.
1. Introduction
Enterobacter cloacae is a facultative anaerobic Gram-negative bacterium exhibiting good tolerance and strong survivability. E. cloacae of the Enterobacteriaceae family commonly exists in water, earth, plants, and the excrement of humans and animals. This microorganism is considered an opportunistic pathogen for nosocomial infection.1,2 E. cloacae can induce respiratory tract infection, urinary system infection, skin and soft tissue infection, and septicemia, thereby presenting a challenge to clinical treatment.3,4 Li et al. found E. cloacae from several breeding environments and bodies of Oreochromis mossambicus.5 Xu et al. tested for bacterial pollution during breeding and processing of Larimichthys crocea and found that individuals with E. cloacae and Citrobacter freundii comprise a large proportion in freshly caught L. crocea.6 Therefore, the development of a method for the rapid detection of E. cloacae is of great urgency.At present, the direct detection of E. cloacae in food is difficult because of the small amount of target bacteria; therefore, focus needs to be directed toward the target bacteria prior to detection. To accelerate the detection of E. cloacae and extend the detection limit, efficient and convenient immunomagnetic separation (IMS) has been used in the separation and enrichment of samples. As a pretreatment measure, this technique can be used with other detection methods to decrease the detection limit.7,8 Wang et al. used enzyme-linked immunosorbent assay (ELISA) to detect Alicyclobacillus strains in apple juice. The detection limit of ELISA was 105 CFU mL−1, and the procedure took 6–7 h.9 In IMS-ELISA, the detection limit was 103 CFU mL−1, and the detection time was less than 3 h, which was 24–40 times shorter than the traditional culture-based method, thereby lowering the detection limit of ELISA by at least 100-fold.10 Zeng et al. used loop-mediated isothermal amplification (LAMP) and IMS-LAMP to detect Vibrio parahaemolyticus in fresh oysters. The LAMP assay exhibited 104 CFU g−1 sensitivity, whereas the IMS-LAMP assay showed 1.9 × 10³ CFU g−1 sensitivity, which was 10-fold more sensitive than LAMP assay alone.11 Mao et al. combined IMS and multiplex PCR to detect Listeria ivanovii in lettuce, with a detection limit of 10 CFU g−1 and detection time of less than 7 h.12 Traditional approaches, such as separation and identification, molecular biological detection, and immunological detection, are currently used to detect E. cloacae.13–15 Studies on the detection of E. cloacae via combined IMS and other detection methods have not been reported.
In the present study, IMS was combined with the immunochromatographic test strip (ICTS) to establish a rapid detection method for E. cloacae. With the use of immunomagnetic beads (IMBs), the target bacteria were separated and enriched specifically from a complex culture medium and background bacterial flora. The target bacteria were then added onto the ICTS for detection. Such procedures do not only promote the concentration of the sample by removing the disturbance of food matrix and other bacteria but also preserve the primary biological activity of the sample. Consequently, the detection sensitivity and accuracy significantly increase, thereby addressing problems such as complex food composition, difficult separation of target bacteria, and severe matrix disturbance. Meanwhile, the combined method is simple and economical.7,16,17 Numerous studies on capturing target bacteria by IMS or detecting pathogen with ICTS have been conducted.18–21 However, the combination of IMS and ICTS for E. cloacae detection has not been previously reported. The method is simple, rapid, economical, and meaningful for screening and controlling E. cloacae at the primary level.22 Compared with pathogen detection by a combination of IMS and other detection methods (such as ELISA, LAMP, and PCR), this combined technique entails a significantly shortened detection time and stronger applicability.10–12 In addition, we used nanobeads instead of microbeads to combine the technologies and develop another detection method. Nanobeads provide a higher capture rate than microbeads because of the high surface-to-volume ratio. Other advantages of using nanoparticles include rapid reaction kinetics and minimal sample preparation.11,23 In the present study, we applied 180 nm particles to concentrate E. cloacae and detected the target bacteria by ICTS, which is highly significant for screening and defending against E. cloacae.
2. Materials and methods
2.1. Materials
Pathogens were purchased from Qingdao Rishui Bio-technologies Co., Ltd. Polyclonal antibody against E. cloacae (PAb), monoclonal antibody against E. cloacae (MAb), bovine serum albumin (BSA), and sodium azide (NaN3) were supplied by Sangon Biotech (Shanghai) Co., Ltd. Goat anti-mouse IgG was acquired from Shanghai Jiening Biotechnology Co., Ltd. Nano-Fe3O4 was purchased from Aladdin Reagent (China) Co. Ltd. 3-Aminopropyltriethoxysilane (APTES) and 25% glutaraldehyde were purchased from Wokaihuacheng Industry (Shanghai) Co., Ltd. 3M Petrifilm plates were supplied by 3M Company (USA). Chloroauric acid (AuCl3·HCl·4H2O), trisodium citrate (C6H5Na3O7·2H2O), anhydrous potassium carbonate (K2CO3), and PEG 20000 were obtained from Sinopharm Chemical Reagent Co., Ltd. Nitrocellulose (NC) membrane, bibulous paper, sample pad, conjugate pad, and PVC bottom plate were purchased from Millipore Company (USA).2.2. Methods
2.2.2.1. Optimization of antibody dosage. E. cloacae stored at −80 °C was inoculated into 5 mL of seawater–beef extract–peptone medium, shake cultured at 28 °C for 2 h, and diluted with sterile PBS. Five 1.5 mL centrifuge tubes containing 3 mg of IMB samples labeled as IMBs1-IMBs5 were added with 1 mL of E. cloacae suspension. A blank control without IMBs was also prepared. All centrifuge tubes were placed on a tube rotator for 45 min at 37 °C. After magnetic separation for 3 min, the liquid phase was removed, and the rest was washed with PBS three times. Finally, the IMB-bacteria compounds were re-dispersed in 1 mL of PBS and inoculated on 3M Petrifilm plates, with three parallel tests. The culture was performed at 28 °C for 1–2 d, and the capture rates were calculated as follows:
Capture rate (%) = Nc/N0 × 100, where Nc is the count of bacteria captured by IMBs (CFU mL−1), and N0 is the bacterial count in the blank control (CFU mL−1).
2.2.2.2. Optimization of IMB dosage. Approximately 0.75, 1.5, 3, 6, and 12 mg of IMBs3 were added into 1.5 mL centrifuge tubes, and 1 mL of E. cloacae suspension was added into each tube. A blank control without IMBs was prepared. All tubes were placed on the rotator for 45 min at 37 °C. After magnetic separation for 3 min, the rest of the procedure described in 2.2.2.1 was performed, and capture rates were calculated.
2.2.2.3. Optimization of immunoreaction duration. Into a 1.5 mL centrifuge tube, 3 mg of IMBs3 and 1 mL of E. cloacae suspension were added successively. A blank control without IMBs was prepared. The tubes were placed on a rotator at 37 °C for enrichment for 5, 15, 30, 45, 60, or 90 min. After magnetic separation for 3 min, the rest of the procedure described in 2.2.2.1 was performed, and capture rates were calculated.
2.2.2.4. Optimization of IMS duration. Into a 1.5 mL centrifuge tube, 3 mg of IMBs3 and 1 mL of E. cloacae suspension were added successively. A blank control without IMBs was prepared. The tubes were placed on a rotator at 37 °C for 45 min of enrichment. The durations of magnetic separation were 0.5, 1, 3, 5, and 7 min. The rest of the procedure was similar to that described in 2.2.2.1, and capture rates were calculated.
2.2.2.5. pH optimization for buffer. Into five 1.5 mL centrifuge tubes with 3 mg of IMBs3, 1 mL of E. cloacae suspension diluted with PBS buffer of pH 5.0, pH 6.0, pH 7.4, pH 8.0, and pH 9.6 were added. A blank control without IMBs was prepared. The tubes were placed on the rotator at 37 °C for 45 min of enrichment. After magnetic separation for 3 min, the rest of the procedure described in 2.2.2.1 was completed, and capture rates were calculated.
2.2.4.1. Sensitivity test for IMBs. Into 1 mL of E. cloacae suspension at 100 to 107 CFU mL−1, 3 mg of IMBs3 was added. The tubes were placed on the rotator at 37 °C for 45 min. After magnetic separation for 3 min, the separated product was washed with PBS three times and resuspended using 1 mL of PBS. The suspension was coated on the 3M Petrifilm plate, with three parallel tests. Capture rates were calculated after culture at 28 °C for 1–2 d.
2.2.4.2. Test of specificity and disturbance resistance of IMBs. The tubes were placed on the rotator for 45 min at 37 °C after 3 mg of IMBs3 was added into the tubes with 1 mL of E. cloacae, V. parahaemolyticus, Vibrio vulnificus, Vibrio harveyi, Vibrio splendidus, Shewanella marisflavi, Vibrio anguillarum, Streptococcus faecalis, and Edwardsiella tarda bacterial solutions. Magnetic separation for 3 min was performed, and the separated product was washed with PBS three times and resuspended with 1 mL of PBS. The suspension was coated on the 3M Petrifilm plate, with three parallel tests. After culture at 28 °C for 1–2 d, capture rates were calculated. Bacterial capture by IMBs3 was conducted in a mixture of nine kinds of bacteria, namely, E. cloacae, V. parahaemolyticus, V. vulnificus, V. harveyi, V. splendidus, S. marisflavi, V. anguillarum, S. faecalis, and E. tarda. The disturbance resistance of E. cloacae IMBs was then determined.
2.2.6.1. Determination of optimal amount of antibody for labeling. The optimal amount of antibody for labeling was determined by the visual method. About 1 mL of colloidal gold solution was added into 14 1.5 mL centrifuge tubes. The pH was adjusted with K2CO3 solution. The solution was added with varying volumes of MAb (1 mg mL−1), blended sufficiently, and kept still for 5 min, followed by the addition of 100 μL of 10% NaCl solution (Table 1). The solution was left to stand for 2 h and then observed. The quantity of antibodies that was capable of maintaining the red color of colloidal gold solution was determined to be the necessary amount of stable colloidal gold. The quantity with a 20% increase in the necessary amount was considered the most appropriate quantity of antibody for labeling.
| 1 | 2 | 3 | 4 | 5 | 6 | 7 | 8 | 9 | 10 | 11 | 12 | 13 | 14 | |
|---|---|---|---|---|---|---|---|---|---|---|---|---|---|---|
| Colloidal gold (mL) | 1 | 1 | 1 | 1 | 1 | 1 | 1 | 1 | 1 | 1 | 1 | 1 | 1 | 1 |
| K2CO3 (μL) | 15 | 15 | 15 | 15 | 15 | 15 | 15 | 15 | 15 | 15 | 15 | 15 | 15 | 15 |
| PAb (μL) | 0 | 1 | 2 | 3 | 4 | 5 | 6 | 7 | 8 | 9 | 10 | 11 | 12 | 100 |
| 10% NaCl (μL) | 100 | 100 | 100 | 100 | 100 | 100 | 100 | 100 | 100 | 100 | 100 | 100 | 100 | 0 |
2.2.6.2. Determination of optimal pH for labeling. About 1 mL of colloidal gold solution was added into 12 1.5 mL centrifuge tubes. The pH was adjusted with K2CO3 and HCl solutions. Thereafter, 15 μL of MAb (1 mg mL−1) was added in each tube and blended sufficiently, after which they were kept still for 5 min. Each tube was added with 100 μL of 10% NaCl solution (Table 2). The well blended solution was placed at room temperature for 10 min. Colloidal gold changed in color, and the pH that was capable of maintaining the red color was considered the optimal pH.
| 1 | 2 | 3 | 4 | 5 | 6 | 7 | 8 | 9 | 10 | 11 | 12 | |
|---|---|---|---|---|---|---|---|---|---|---|---|---|
| Colloidal gold (mL) | 1 | 1 | 1 | 1 | 1 | 1 | 1 | 1 | 1 | 1 | 1 | 1 |
| pH | 3 | 4 | 5 | 5.5 | 6 | 6.5 | 7 | 7.5 | 8 | 8.5 | 9 | 9.5 |
| PAb (μL) | 15 | 15 | 15 | 15 | 15 | 15 | 15 | 15 | 15 | 15 | 15 | 15 |
| 10% NaCl (μL) | 100 | 100 | 100 | 100 | 100 | 100 | 100 | 100 | 100 | 100 | 100 | 100 |
2.2.9.1. Sensitivity test. The inactivated E. cloacae bacterial solution was diluted in a gradient method to 100 to 107 CFU mL−1 for the sensitivity test. The test was repeated three times for each dilution concentration, with PBS as the negative control. The detected minimum concentration was used as the sensitivity of the test strip.
2.2.9.2. Specificity test. Nine types of inactivated bacterial solutions were diluted with PBS to 106 CFU mL−1. These bacterial solutions were E. cloacae, V. parahaemolyticus, V. vulnificus, V. harveyi, V. splendidus, S. marisflavi, V. anguillarum, S. faecalis, and E. tarda. With PBS as the negative control, cross-reactivity tests were conducted three times. The specificity of the test strip was determined based on the results.
2.2.10.1. Detection of pure cultured sample. The E. cloacae bacterial solution was diluted to 101 to 107 CFU mL−1. For each concentration, 1 mL of bacterial solution was added into two 1.5 mL centrifuge tubes. One tube was added with IMBs, and the tube without IMBs served as the control. At 37 °C, all centrifuge tubes were fixed on the rotator for a 45 min reaction. After magnetic separation for 3 min, 100 μL of PBS was added for resuspension, followed by a water bath procedure at 85 °C for 15 min.22 After magnetic separation, the supernate was removed. Approximately 100 μL of supernate and bacterial solution in the control group were added into the wells of the test strip. After 10 min, the colors of the C and T lines on the test strip changed.
2.2.10.2. Detection of the simulated water sample of E. cloacae pollution. Samples amounting to 0.9 mL were taken separately from 28 seawater and sediment samples in Quanzhou Bay, Xiamen City. The samples were mixed with 100 μL of 106 CFU mL−1 E. cloacae suspension to simulate pollution. In this procedure, two groups were established: one group was added with IMBs for separation and enrichment, and the other group without IMBs served as the control. The supernate obtained after magnetic separation and enrichment, as well as the water sample in the control group (100 μL each), was added into the wells of the test strip. After 10 min, the C and T lines on the test strip changed in color.
3. Results and analysis
3.1. Optimization of conditions for bacterial capture by IMBs
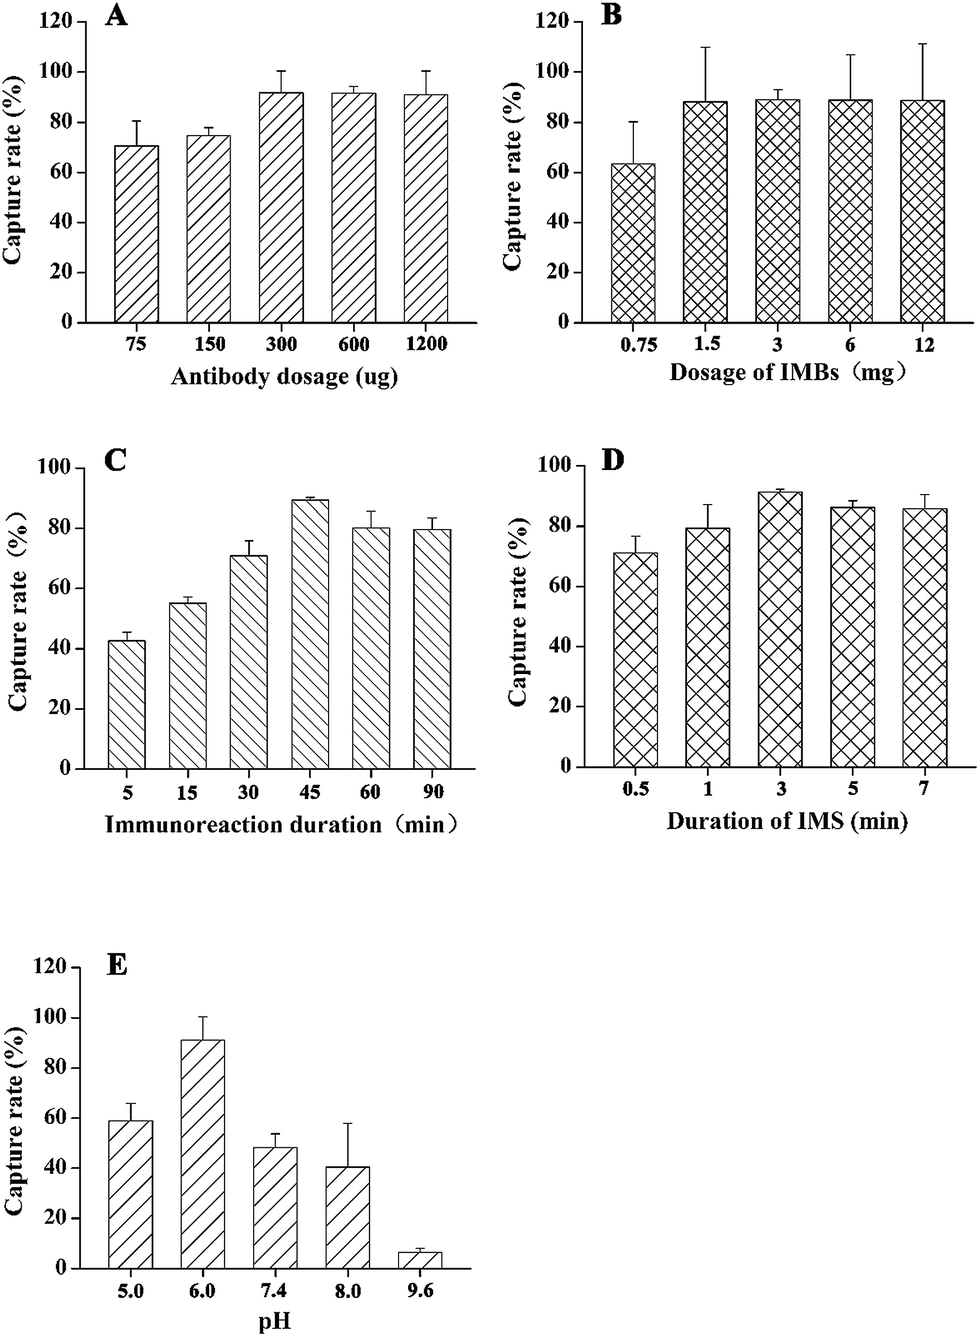 | ||
| Fig. 1 Condition optimization for bacterial capture with IMBs. (A) means effect of antibody dosage on capture rate, (B) means effect of dosage of IMBs on capture rate, (C) means effect of immunoreaction duration on capture rate, (D) means effect of duration of IMS on capture rate, (E) means effect of buffer at different pH values on capture rate. | ||
3.2. Ultrastructure
Most magnetic beads were quadrangular, with a relatively uniform size and good dispersion, preventing massive aggregation (Fig. 2A). These magnetic beads were used in the preparation of IMBs. After antibody was added, the formylated magnetic beads were bound to the antibodies, exhibiting aggregation (Fig. 2B). Fig. 2C shows rod-like E. cloacae. In Fig. 2D, IMBs were combined with E. cloacae through the surface antibodies, and each bacterium may be combined with several magnetic beads, exhibiting aggregation of magnetic beads and bacteria.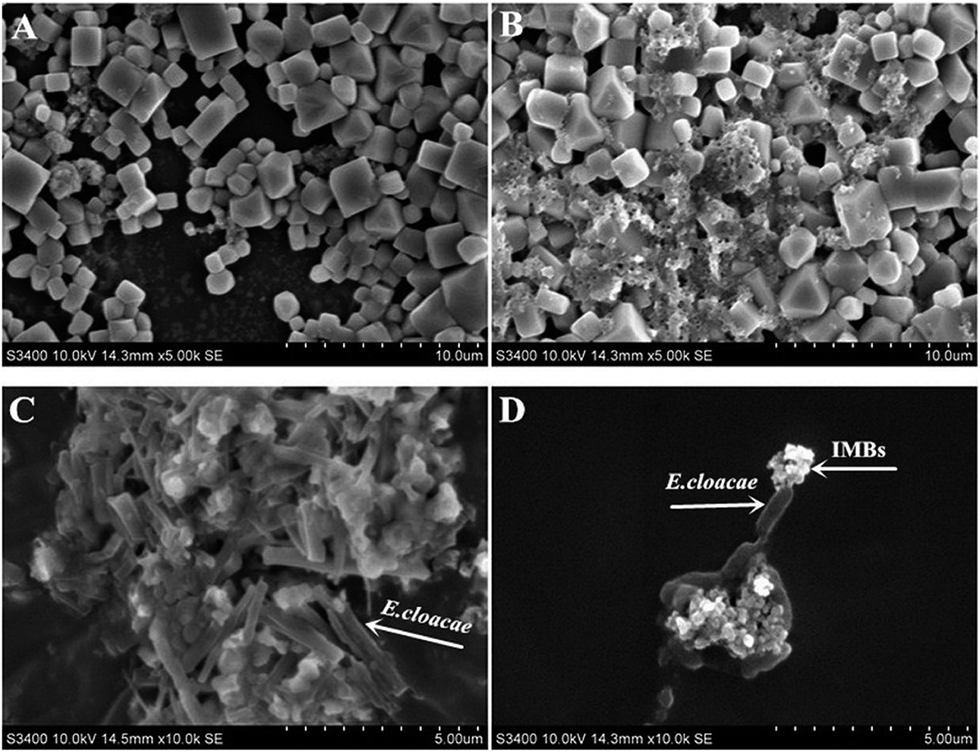 | ||
| Fig. 2 Scanning electron microscope of E. cloacae interacting with IMBs. (A) means the bare magnetic beads, (B) means magnetic beads combine with antibody, (C) means the morphology of E. cloacae, (D) means the enrichment of E. cloacae by IMBs. | ||
3.3. Performance of IMBs
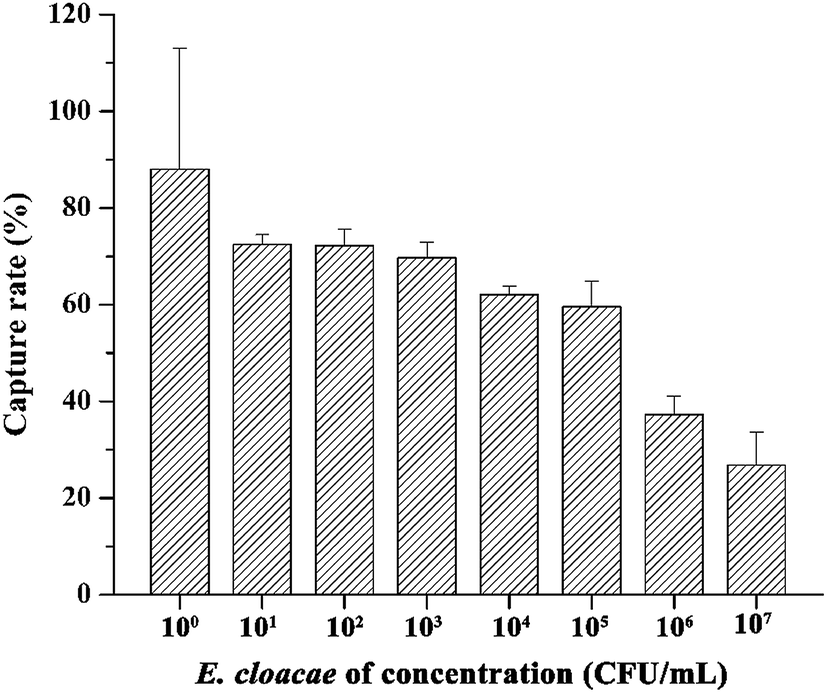 | ||
| Fig. 3 The sensitivity of the capture of IMBs. | ||
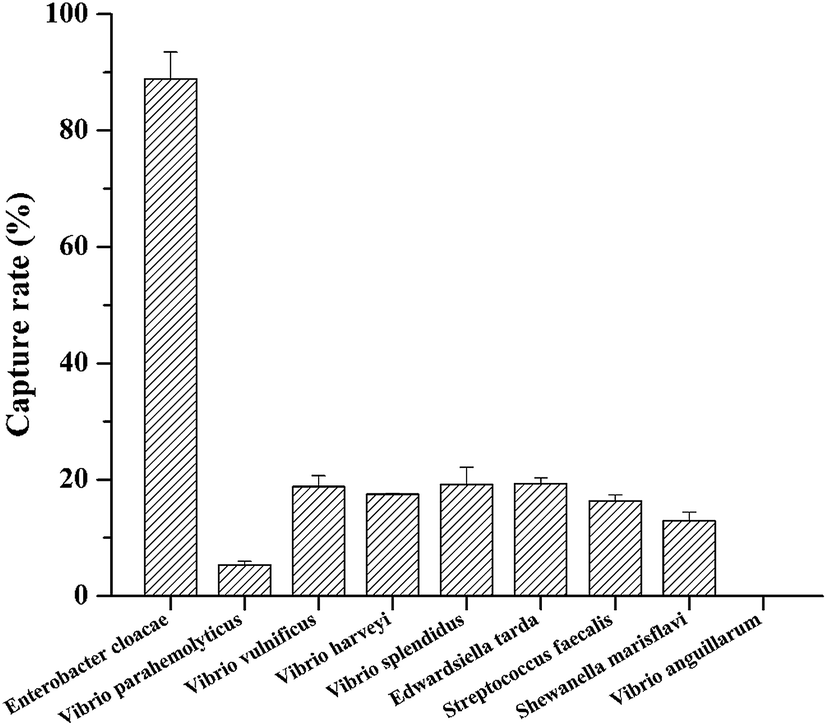 | ||
| Fig. 4 The specificity of the capture of IMBs. | ||
3.4. Quality test of colloidal gold
The prepared colloidal gold solution was clear and transparent, with a deep red color. Neither suspended matter on the surface nor aggregated particle at the bottom was found. Transmission electron microscopy and an ultraviolet spectral scanner were used to analyze the quality of colloidal gold. Fig. 5A shows that the colloidal gold particles were uniform in size and round (i.e., not irregular in shape). As shown in Fig. 5B, the colloidal gold solution had only one maximum absorption peak (λmax = 525 nm) within the 400–800 nm range. In addition, the peak width was relatively small, and the waveform was smooth, suggesting that the particles constituting the prepared colloidal gold solution were relatively uniform in size.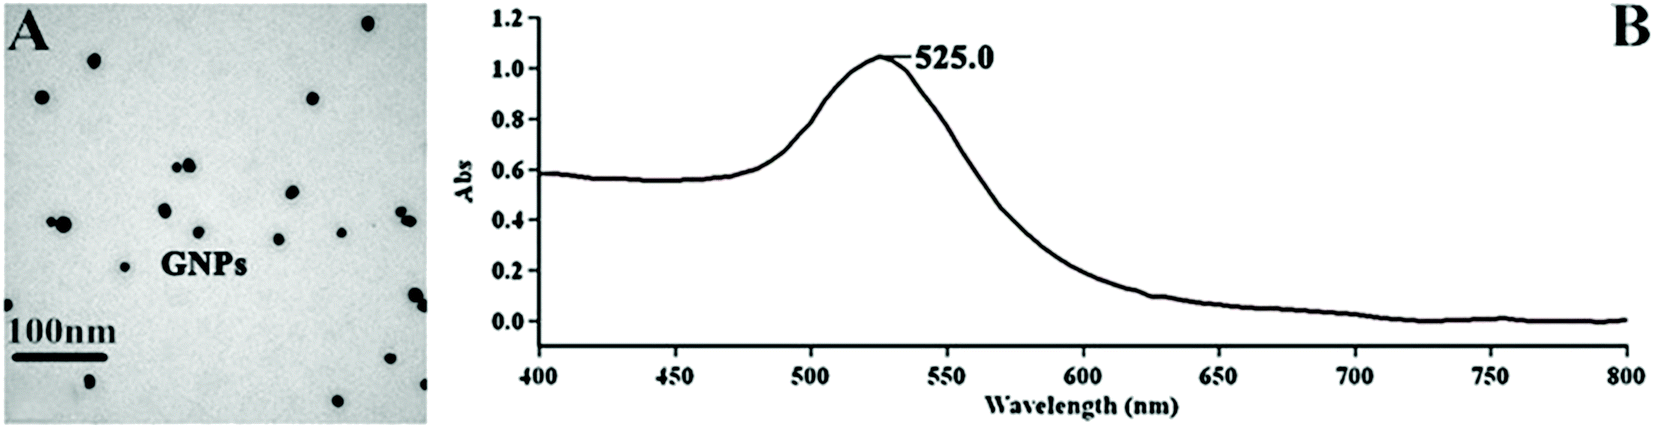 | ||
| Fig. 5 Qualification of colloidal gold. (A) means the transmission electron microscope of colloidal gold, (B) means the ultraviolet spectral scanner of colloidal gold. | ||
3.5. Determination of labeling conditions
According to the Mey's stability test, the color became stable when the antibody concentration for labeling was 11 μL mL−1. Therefore, the real antibody concentration was 13.2 μL mL−1 (MAb/colloidal gold). The colloidal gold became gray and appeared as sediment at pH 3–5, but it kept its primary red color at pH 6.5–8.5. At pH values outside these ranges, colloidal gold turned light in color at varying degrees. Therefore, pH 7.5 was considered the labeling pH in the experiment.3.6. Performance of ICTS
| The concentration of E. cloacae (CFU mL−1) | PBS | |||||||
|---|---|---|---|---|---|---|---|---|
| 100 | 101 | 102 | 103 | 104 | 105 | 106 | 107 | |
| − | − | − | + | ++ | +++ | ++++ | +++++ | − |
| EC | VP | VH | VV | VS | VA | SF | ET | SM | PBS |
|---|---|---|---|---|---|---|---|---|---|
| + | − | − | − | − | − | − | − | − | − |
3.7. Detection results of IMS combined with colloid gold-based immunochromatographic assay
| The concentration of E. cloacae (CFU mL−1) | The results of colloidal gold immunochromatographic assay | |
|---|---|---|
| Not enrichment by IMBs | Enrichment by IMBs | |
| 101 | − | − |
| 102 | − | + |
| 103 | + | ++ |
| 104 | ++ | +++ |
| 105 | +++ | ++++ |
| 106 | ++++ | ++++ |
| 107 | +++++ | +++++ |
Comparisons of IMS-ICTS with IMS-ELISA, IMS-LAMP, and IMS-PCR for detection of bacteria are presented in Table 6. For the proposed IMS-ICTS, the detection limit was 102 CFU mL−1, whereas those for IMS-ELISA, IMS-LAMP, and IMS-PCR were 103, 102, and 103 CFU mL−1, respectively. The detection time of IMS-ICTS was less than 1 h, which could lower the detection time of IMS-ELISA, IMS-LAMP, and IMS-PCR by at least 3-, 1.5-, and 4-fold, respectively.10,11,26 Thus, the combination of IMS with ICTS for detecting bacteria exhibited a significantly shortened detection time and enhanced sensitivity.
| Detection method | Time (h) | Sensitivity (CFU mL−1) |
|---|---|---|
| IMS-ICTS | 1 | 102 |
| IMS-ELISA | 3 | 103 |
| IMS-LAMP | 1.5 | 102 |
| IMS-PCR | 4 | 103 |
| Samples | The results of colloidal gold immunochromatographic assay | |
|---|---|---|
| Not enrichment by IMBs | Enrichment by IMBs | |
| 1 | − | + |
| 2 | − | + |
| 3 | − | + |
| 4 | − | + |
| 5 | − | + |
| 6 | − | + |
| 7 | − | + |
| 8 | − | + |
| 9 | − | + |
| 10 | − | + |
| 11 | − | + |
| 12 | − | + |
| 13 | − | + |
| 14 | − | + |
| 15 | − | + |
| 16 | − | + |
| 17 | − | + |
| 18 | − | + |
| 19 | − | + |
| 20 | − | + |
| 21 | − | + |
| 22 | − | + |
| 23 | − | + |
| 24 | − | + |
| 25 | − | + |
| 26 | − | + |
| 27 | − | + |
| 28 | − | + |
4. Discussion
A rapid and accurate detection method needs to be established for the prevention of E. cloacae infection. In recent years, various types of ICTS for the rapid detection of pathogens have been developed. Song et al. prepared the ICTS for Shigella boydii and Escherichia coli O157:H7, which obtained 106 CFU mL−1 sensitivity.21 Sithigorngul et al. prepared the ICTS for V. harveyi. If the samples were not enriched, the ICTS obtained 106 CFU mL−1 sensitivity; if the test samples were pre-enriched in tryptic soy broth for 6 h before application to the ICTS, the sensitivity increased to 101 CFU mL−1.20 The sensitivities of ICTS are unsatisfactory, but they exhibit a number of strengths, including clear and direct results, no professional requirements, convenience of on-site detection, and rapid detection (5–10 min).25,27 Although the sensitivity greatly improved after enrichment, the entire detection time was prolonged because the pretreatment measure time continued for an extended period. To overcome the disadvantages of low sensitivity and short detection time, IMS-ICTS was applied in the detection of E. cloacae. In the current study, the sensitivity of the combined method reached 102 CFU mL−1, which was 104-fold more sensitive than Song's ICTS assay.21 The detection time for IMS-ICTS assay was less than 1 h, which was shortened by sixfold compared with Sithigorngul's method.20 The combined detection method is emphasized in the current study because combining the two technologies for bacterial detection has not been previously reported.Nanoparticles have recently opened new dimensions in IMS because of their unique optical properties, fast reaction kinetics, low mass, high surface-to-volume ratio, and low cost.11,18 In this study, we also used magnetic nanobeads with an average diameter of 180 nm instead of microbeads to enhance the proposed technique. First, the capture rate was higher (about 90%) than previously reported (i.e., lower than 60% by microbeads).7,17 The difference in the capture rate could be attributed to the size of the magnetic beads, because nanoparticles can provide increased contact surface area for the attachment of antibody and bacterial capture.23 Moreover, the small size of nanoparticles allows the affinity of multiple IMBs onto a bacterial cell, rendering ease in magnet-mediated separation and rapid detection.28 Varshney et al. reported that the surface area of 145 nm magnetic particles for capturing E. coli O157 is 78 times larger than that of 2.8 μm magnetic beads.29 However, extremely small nanobeads contain less magnetic materials in their cores, impeding the rapid separation of target bacteria from food samples.19 Therefore, the 180 nm IMBs used in this study may exhibit a higher surface-to-volume ratio and provide more binding sites for antibodies. Second, the binding reaction was completed in 45 min in this study, and the immunoreaction took 60–120 min when magnetic microbeads were used in the IMS methods.24,30 The most probable reason for this difference was the rapid binding kinetics of IMBs to target cells. Gu et al. showed that magnetic nanoparticles are 5–20 times faster than 1–100 μm magnetic beads in reaction kinetics.31
In addition to the advantages presented by IMBs, the evaluation of combined technologies in this study focused on the sensitivity and specificity of the ICTS. The sensitivity of the ICTS largely depends on the following factors. First, different sizes (30–80 nm) of colloidal gold particles were tested. The use of large gold nanoparticles to make the ICTS may contribute to low sensitivity because of low antigen–antibody binding.32,33 Luo et al. also compared the sensitivity of the ICTS with colloidal gold particles of 20, 30, and 40 nm. Their results showed that the ICTS containing 30 nm colloidal gold particles exhibits 3 ng mL−1 sensitivity. However, the sensitivities of the ICTS containing colloidal gold particles of 20 and 40 nm were only 7 and 9 ng mL−1, respectively.34 These results could be due to steric hindrance. The antibody labeled by colloidal gold of 40 nm had difficulty binding, specifically with antigen, thereby decreasing sensitivity.35,36 The mean particle size of colloidal gold prepared in this experiment was about 30 nm, exhibiting relatively good sensitivity. Second, in this experiment, after E. cloacae was enriched with IMBs, a water bath procedure at 85 °C for 15 min was performed, which significantly increased the detection limit. The detection limit increased because the bacteria were destroyed after heating and boiling, creating more binding sites for the antibodies. The particles became smaller and moved faster on the NC membrane. Therefore, a positive result could be detected earlier, and the detection limit increased.37 The amount of antibody proteins for labeling is also a factor determining the sensitivity of ICTS. The amount of antibody proteins that can be bound to colloidal gold is limited. If this amount is insufficient, the antibody cannot bind to the antigen, and sensitivity is reduced; antibodies are wasted if this amount exceeds the saturated labeling amount, and the free antibodies can bind to the antigens, thereby decreasing sensitivity.38
Another index for quality evaluation of the ICTS is specificity. First, the success of ICTS largely depends on the quality of the labeling antibody. Several studies have suggested that PAb is unsuitable for detection in ICTS because high specificity is difficult to obtain.39,40 Thus, the quality of the MAb used in the ICTS is crucial for the specificity of the strip. The MAb we used specifically recognizes E. cloacae and exhibits high affinity for antigen epitopes.40 The MAb recognizes more epitopes and a higher antibody repertoire, resulting in amplification of the signal. The use of MAb can reduce cross-reactivity and background because of its phylogenetic distance; thus, no false positives are obtained in immunological assays.39 In a previous study, a specific MAb was generated by immunizing New Zealand white rabbits; a sensitive ELISA procedure was developed for the detection of E. cloacae, and colloidal gold was obtained by coating the specific antibody onto the surface.8,41,42 Second, the specificity of ICTS is also related to the pH of the gold solution. A study demonstrated that the antibody couples with gold solution more effectively when the pH is slightly higher than the isoelectric point (pI) of the labeling antibody.43 In a study by Yang et al., the pH of the gold solution is an important factor for the successful preparation of a gold–antibody conjugate. The gold solution binds to the antibody more effectively when its pH is close to 0.5 or higher than the pI of the MAb.44 In the present study, the pH of the gold solution was 7.5, which was close to the pI of the labeling antibody. Thus, the specificity of the ICTS was relatively good, with no cross-reaction.
In the detection of E. cloacae with combined IMS and ICTS, specific IMBs were first applied to enhance the concentration of the target bacteria. The target antigen substances were then detached from the IMBs by heating, and the detached substances were added on the ICTS for detection. The entire process, from sample enrichment and separation by IMBs to detection using ICTS, was completed in less than 1 h. This combined method addresses the problem related to time requirements and labor consumptions in traditional detection based on enrichment culture. The technique can be used in field monitoring and preliminary screening of emergent diseases. The approach also provides a reference for the establishment of a pathogen screening and defending method suitable for grassroots units.
5. Conclusions
In summary, we studied the rapid detection of E. cloacae by IMS and colloidal gold-based immunochromatographic assay. Results indicated that 102 CFU mL−1 E. cloacae could be detected using the ICTS after IMS. The sensitivity obtained was 10 times higher than that obtained by direct detection with ICTS. With ICTS, the water sample spiked with E. cloacae yielded a negative result, whereas E. cloacae yielded a positive result with ICTS after IMS. The proposed approach enhances the rapid detection of E. cloacae in food.Acknowledgements
This work was financially supported by State Oceanic Administration (201105007).References
- A. Cascio, M. L. Mezzatesta, A. Odierna, F. D. Bernardo, G. Barberi, C. Iaria, S. Stefani and S. Giordano, Int. J. Infect. Dis., 2014, 20, 66–67 CrossRef CAS PubMed.
- M. L. Mezzatesta, F. Gona and S. Stefani, Future Microbiol., 2012, 7, 887–902 CrossRef CAS PubMed.
- X. Jiang, Y. Ni, Y. Jiang, F. Yuan, L. Han, M. Li, H. Liu, L. Yang and Y. Lu, J. Clin. Microbiol., 2005, 43, 826–831 CrossRef CAS PubMed.
- C. H. Chen and C. C. Huang, BMC Infect. Dis., 2013, 13, 1–6 CrossRef PubMed.
- L. H. Li, Y. Y. Wu, F. X. Li, X. Q. Yang, S. Q. Diao and W. J. Zhou, J. Fish. China, 2009, 33, 823–831 Search PubMed.
- Z. Xu, Q. Y. Guo and X. S. Yang, Chinese Journal of Food Hygiene, 2006, 18, 13–16 Search PubMed.
- S. I. Tu, S. Reed, A. Gehring, Y. He and G. Paoli, Sensors, 2009, 9, 717–730 CrossRef CAS PubMed.
- S. Wadud, C. G. Leon-Velarde, N. Larson and J. A. Odumeru, J. Microbiol. Methods, 2010, 81, 153–159 CrossRef CAS PubMed.
- Z. Wang, T. Yue, Y. Yuan, R. Cai, C. Guo, X. Wang and C. Niu, J. Food Sci., 2012, 77, M643–M649 CrossRef CAS PubMed.
- Z. Wang, T. Yue, Y. Yuan, R. Cai, C. Niu and C. Guo, Int. J. Food Microbiol., 2013, 166, 28–33 CrossRef CAS PubMed.
- J. Zeng, H. Wei, L. Zhang, X. Liu, H. Zhang, J. Cheng, D. Ma, X. Zhang, P. Fu and L. Liu, Int. J. Food Microbiol., 2014, 174, 123–128 CrossRef CAS PubMed.
- Y. Mao, X. Huang, S. Xiong, H. Xu, Z. P. Aguilar and Y. Xiong, Food Control, 2016, 59, 601–608 CrossRef CAS.
- P. K. Mandal, A. K. Biswas, K. Choi and U. K. Pal, Am. J. Food Technol., 2011, 6, 87–102 CrossRef.
- O. Lazcka, F. J. Del Campo and F. X. Munoz, Biosens. Bioelectron., 2007, 22, 1205–1217 CrossRef CAS PubMed.
- R. F. de Boer, A. Ott, B. Kesztyüs and A. M. D. Kooistra-Smid, J. Clin. Microbiol., 2010, 48, 4140–4146 CrossRef PubMed.
- B. Guven, N. Basaran-Akgul, E. Temur, U. Tamer and I. H. Boyaci, Analyst, 2011, 136, 740–748 RSC.
- S. Datta, M. E. Janes and J. G. Simonson, Clin. Vaccine Immunol., 2008, 15, 1541–1546 CrossRef CAS PubMed.
- Q. Xiong, X. Cui, J. K. Saini, D. Liu, S. Shan, Y. Jin and W. Lai, Food control, 2014, 37, 41–45 CrossRef.
- M. J. Shields, K. R. Hahn, T. W. Janzen, N. Goji, M. C. Thomas, C. I. B. Kingombe, C. Paquet, A. J. Kell and K. K. Amoako, J. Food Prot., 2012, 75, 1243–1248 CrossRef PubMed.
- P. Sithigorngul, S. Rukpratanporn, N. Pecharaburanin, P. Suksawat, S. Longyant, P. Chaivisuthangkura and W. Sithigorngul, J. Microbiol. Methods, 2007, 71, 256–264 CrossRef CAS PubMed.
- C. Song, C. Liu, S. Wu, H. Li, H. Guo, B. Yang, S. Qiu, J. Li, L. Liu, H. Zeng, X. Zhai and Q. Liu, Food Control, 2016, 59, 345–351 CrossRef CAS.
- X. Cui, Q. R. Xiong, Y. H. Xiong, S. Shan and W. H. Lai, Chin. J. Anal. Chem., 2013, 41, 1812–1816 CrossRef CAS.
- Y. Cheng, Y. Liu, J. Huang, K. Li, W. Zhang, Y. Xian and L. Jin, Talanta, 2009, 77, 1332–1336 CrossRef CAS PubMed.
- P. Zhu, D. R. Shelton, S. Li, D. L. Adams, J. S. Karns, P. Amstutz and C. M. Tang, Biosens. Bioelectron., 2011, 30, 337–341 CAS.
- S. Cui, C. Chen and G. Tong, J. Virol. Methods, 2008, 152, 102–105 CrossRef CAS PubMed.
- L. Wang, P. Li, Y. Yang, H. Xu, Z. P. Aguilar, H. Xu, L. Yang, F. Xu, W. Lai, Y. Xiong and H. Wei, Int. Dairy J., 2014, 34, 280–286 CrossRef CAS.
- H. Leem, S. Shukla, X. Song, S. Heu and M. Kim, J. Food Saf., 2014, 34, 239–248 CrossRef CAS.
- X. Zhao, L. R. Hilliard, S. J. Mechery, Y. Wang, R. P. Bagwe, S. Jin and W. Tan, Proc. Natl. Acad. Sci. U. S. A., 2004, 101, 15027–15032 CrossRef CAS PubMed.
- M. Varshney, L. Yang, X. L. Su and Y. Li, J. Food Prot., 2005, 68, 1804–1811 CAS.
- S. M. Seo, I. H. Cho, J. W. Jeon, H. K. Cho, E. G. Oh, H. S. Yu, S. B. Shin, H. J. Lee and S. H. Paek, J. Food Prot., 2010, 73(8), 1466–1473 Search PubMed.
- H. Gu, K. Xu, C. Xu and B. Xu, Chem. Commun., 2006, 9, 941–949 RSC.
- A. Molinelli, K. Grossalber and R. Krska, Anal. Bioanal. Chem., 2009, 395, 1309–1316 CrossRef CAS PubMed.
- G. Frens, Nature, 1973, 241, 20–22 CAS.
- S. Luo, F. Chen, C. Liu, C. Zou, S. Qiu, T. Hong, P. Gao and T. Chen, Food Sci., 2011, 32, 120–124 CAS.
- G. Sonavane, K. Tomoda and K. Makino, Colloids Surf., B, 2008, 66, 274–280 CrossRef CAS PubMed.
- K. Omidfar, S. Kia and B. Larijani, Hybridoma, 2011, 30, 117–124 CrossRef CAS PubMed.
- H. L. Duan, Z. Q. Shen, X. W. Wang, F. H. Chao and J. W. Li, World J. Gastroenterol., 2005, 11, 3660–3664 CrossRef PubMed.
- T. Ciesiolka and H. J. Gabius, Anal. Biochem., 1988, 168, 280–283 CrossRef CAS PubMed.
- L. Zhang, D. Li, L. Liu, J. Fang, R. Xu and G. Zhang, J. Virol. Methods, 2015, 221, 39–45 CrossRef CAS PubMed.
- F. Peng, Z. Wang, S. Zhang, R. Wu, S. Hu, Z. Li, X. Wang and D. Bi, Clin. Vaccine Immunol., 2008, 15, 569–574 CrossRef CAS PubMed.
- C. G. Leon-Velarde, L. Zosherafatein and J. A. Odumeru, J. Microbiol. Methods, 2009, 79, 13–17 CrossRef CAS PubMed.
- L. Yao, Q. Wu, D. Wang, X. Kou and J. Zhang, Lett. Appl. Microbiol., 2009, 49, 173–178 CrossRef CAS PubMed.
- Y. Li, L. Hou, J. Ye, X. Liu, H. Dan, M. Jin, H. Chen and S. Cao, J. Virol. Methods, 2010, 168, 51–56 CrossRef CAS PubMed.
- J. Yang, M. Jin, J. Chen, Y. Yang, P. Zheng, A. Zhang, Y. Song, H. Zhou and H. Chen, J. Vet. Diagn. Invest., 2007, 19, 355–361 CrossRef PubMed.
| This journal is © The Royal Society of Chemistry 2016 |