Synergic effect of graphene and MWCNT fillers on electromagnetic shielding properties of graphene–MWCNT/ABS nanocomposites
S. K. Sharma,
Vinay Gupta,
R. P. Tandon and
V. K. Sachdev*
Department of Physics and Astrophysics, University of Delhi, Delhi, India. E-mail: vk_sachdev@yahoo.com
First published on 27th January 2016
Abstract
Graphene–MWCNT/ABS nanocomposites have been prepared using a solvent-free dry tumble mixing process followed by hot compaction. The combined effect of using two nanofillers (graphene and MWCNTs) on the electrical conductivity and EMI shielding properties of the nanocomposites has been studied. A unique conductive network of MWCNTs and graphene formed due to their different geometrical shapes, besides the high aspect ratios of the MWCNTs. This served to improve the electrical conductivity and the electromagnetic shielding properties. FESEM results for freeze-fractured pellets have confirmed the enhancement in conductivity and shielding of the graphene–MWCNT/ABS nanocomposites and, furthermore, the escape of EM waves through windows/gaps consisting of filler-depleted areas containing ABS. The addition of 1 wt% MWCNTs to a graphene–ABS nanocomposite resulted in a synergistic effect on the EM shielding properties.
Introduction
Electromagnetic (EM) pollution is rapidly increasing due to the growth of sensitive electronic devices, and will continue to increase with technological advances. Wireless devices emit EM waves (particularly radio waves), which interfere with susceptive equipment, leading to its malfunctioning and even failure.1–6 Studies have revealed that EM radiation, though non-ionizing, can adversely affect human health.7–10 The ill-effects of EM pollution on human health can be minimized by lowering the radiation emissions within the acceptable limit. There are sets of guidelines by government agencies like ICNIRP, ANSI and IEEE to control the excessive radio emissions by wireless devices.11–13 Protection from too much EM radiation has become a major concern globally due to the growing use of wireless electronic equipment and other GHz devices.14,15 The problem of interference can be eliminated or reduced by designing the circuitry of devices to be immune to EM radiation, or by using a shield that blocks the radiation. Conventionally, metal shrouds were used for EM shielding, but their heavy weight and poor corrosion resistance make them inappropriate for many applications.16 Polymer-based conductive materials have generated significant scientific interest in recent years for EM shielding applications on account of their light mass, versatility in design, resistance to environmental degradation and tunable electrical properties.17 Pristine polymers are poor in EM shielding capability. These are blended with conductive fillers to improve their shielding properties.18,19 Many types of conductive fillers, such as metal particles, metal nanowires, carbon black, carbon fibers, carbon nanotubes and graphene, have been investigated as conductive additives in polymeric matrices; review reports are available.17 The choice of conductive filler and processing technique are the two key factors that affect the shielding performance of polymer composites.17,20Among various conductive nanofillers, carbon nanotubes and graphene have been extensively investigated due to their outstanding structural, mechanical and electrical properties.21–29 Their superior electrical conductivity and aspect ratios make them efficient in establishing conductive networks at low filler loadings in polymer matrices. For the EM shielding application, many of the investigations have been carried out on polymer composites based on a single filler. Polymers offer the freedom to incorporate more than one filler. Reports on the use of more than one filler are limited.30,31 In this work, an attempt has been made to develop conductive polymer composites by dispersing two carbon fillers of dissimilar shapes, namely tubular and flake. Graphene and multi-walled carbon nanotubes (MWCNTs) were selected. Both of these nanofillers have been dispersed using dry tumble mixing in an acrylonitrile butadiene styrene (ABS) matrix, followed by a hot compaction technique. To the best of our knowledge, the combination of two nanofillers for a pattern network structure in a polymer matrix has not been examined. The aim of this study is to investigate the combined effect of two fillers with tubular and flake geometries on the electrical and EM shielding performance.
Experimental
Materials
The graphene powder used in this work was from Intelligent Materials Pvt. Ltd USA, catalog number: NS6130-03-365; specifications: 4–6 layer flakes, lateral size 1–10 microns, thickness 2–4 nm and purity 99.5% (metal base). Multi-walled carbon nanotubes were procured from Sigma Aldrich, catalog number: 677248-5G; specifications: >99% carbon basis, inner diameter ∼ 2–6 nm, outer diameter ∼ 10–15 nm, length ∼ 0.1–10 microns and density ∼ 1.7–2.1 g ml−1 at 25 °C. Acrylonitrile butadiene styrene copolymer ABS-92 in granular form was received from Lanxess ABS Ltd., Baroda, India. The graphene and MWCNTs were used as received, while granules of ABS were pulverized cryogenically to a particle size of 1–5 microns.32Method
Two series of ABS nanocomposites, correspondingly filled with graphene and graphene together with 1 wt% MWCNTs, were fabricated by a dry tumble mixing technique followed by hot compaction, as used earlier.32 By means of this technique, convincingly low values of percolation threshold have been achieved.32,33 The processing involved two steps. The first step involved covering/embedding of conductive filler on to the surface of ABS particles via dry tumble mixing. The powders of ABS and the conductive fillers were mixed in a tumbler for 300 minutes using a magnetic stirrer with 500 rpm speed. The mechanical mixing coated the filler particles onto the surface of the ABS particles. Gaps are obvious in coats of graphene flakes due to their planar geometry. The dimensions of gaps should be larger for lower loadings of graphene, and decrease with increasing loading. The MWCNTs were expected to provide cover to the graphene particles by way of linking in the interfacial sites among the ABS particles. In the second step, filler-coated ABS particles were heated at 115 °C for some time in a die of X-band waveguide dimensions, brought back to 90 °C and then compressed at 75 MPa pressure for 15 minutes to obtain pellets. On compaction at elevated temperature, the MWCNTs/graphene located at the interfacial spaces between the ABS particles were expected to create a localized network in the nanocomposites. The emphasis of this work is on the influence of using a mixture of conductive nanofillers on the electrical and EMI shielding properties of ABS nanocomposites. The processing method used in this work is simple and industrially viable, the only condition being that the average particle size of the polymer particles should be greater than that of the filler particles.25 The two fillers, graphene and MWCNTs, have different morphologies and aspect ratios. A lower value of electrical percolation threshold is logical for a higher aspect ratio. Pellets of graphene/ABS and graphene-1 wt% MWCNT/ABS nanocomposites were prepared, and the specimens were investigated for their electrical and EM shielding properties.The dc electrical conductivity of the pellets was measured using a Keithley 2400 SMU instrument. A specific fixture with spring-loaded pressure contacts was used as a sample holder. The pressure contacts were finely coated with fine silver. Conductive silver paint was applied on both sides of the pellets for conductivity measurements. A four-wire Kelvin clip method was used to eliminate the contribution of the leads resistance. An Agilent vector network analyzer (VNA), N5230C PNA-L (10 MHz to 40 GHz), has been used for EMI shielding measurements in the X-band frequency range.
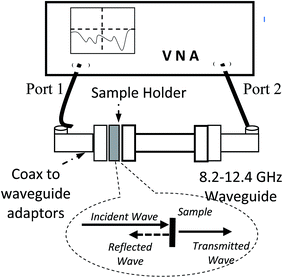
Fig. 1 illustrates the schematic setup of the VNA. The specimen pellets of graphene/ABS and graphene-1 wt% MWCNT/ABS nanocomposites were of X-band waveguide shape, and fitted precisely into the sample holder. The measurements were performed for the S11/S22 and S12/S21 scattering parameters in the 8–12 GHz frequency range, using two ports of the vector network analyzer. Field emission scanning electron microscopy (FESEM) was used for morphological studies. Cross-sectional views of freeze-fractured pellets of the nanocomposites were examined.
Results and discussion
Conductivity
Fig. 2 shows the dc electrical conductivity (σ) behavior of the graphene/ABS composites as a function of graphene loading. σ increases with the increase of graphene content in the ABS matrix. An eight order increase in σ occurred on the addition of 1 wt% of graphene, from 1.5 × 10⁻¹⁴ S cm−1 to 1.6 × 10⁻⁶ S cm−1, through 5.65 × 10⁻⁸ S cm−1 at 0.5 wt% of graphene. The major rise of six orders in σ occurred at 0.5 wt% of graphene loading, which means that the percolation threshold is somewhere between 0.0 wt% and 0.5 wt%. The percolation threshold is defined as an abrupt rise in conductivity at a critical concentration (ϕc), when conductive filler particles are in adequate closeness to produce a charge carrier transport. Theoretically, when the distance between conductive particles within the matrix is close to an edge value of < 10 nm, tunneling is expected to take place.34 At ϕc, the initial formation of a network of passages results in several orders of increase in the conductivity. The percolation threshold depends on the concentration of the conductive particles, including the extent of nanoparticle dispersion and/or aggregation, the aspect ratio of the nanoparticles, their orientation and their directed self-assembly.35 The electron conduction is thought to take place through filler–filler contacts, besides electrons hopping/tunneling across the energy barriers between conducting fillers in the ABS composite. For very low graphene loadings, the graphene particles were too distant apart from each other to build any conductive channels in the composite. Above the percolation threshold, the σ of the composites increased with a marginal rise. A gradual increase of four orders in σ for 1 to 10 wt% of graphene loading was observed. Strictly speaking, the conductivity curve does not flatten, similar to earlier studies on MWCNT/ABS and MWCNT/PS nanocomposites.32,33 It is likely that the MWCNTs, with their tubular structure, were the reason behind the saturation. On higher loadings, MWCNTs touching each other may have facilitated the transfer of electrons through direct contacts. In line with the present graphene/ABS studies, an increasing σ with rising graphene content has been noticed in the case of graphene/polystyrene nanocomposites prepared via solvent mixing.27 This can be attributed to the flake-like structure of graphene. The filler–filler contact resistance mainly determines the degree of increase in the σ of composites. The contact resistance largely depends upon the area of contact between filler particles.34 A larger contact area increases the closeness and decreases the contact resistance. In turn, the contact area depends on the filler geometry and would be different for different geometries. It is anticipated that given the flake-like structure of graphene, the contact resistance should progressively decrease with an increasing graphene concentration, giving rise to increasing values of σ for graphene/ABS nanocomposites.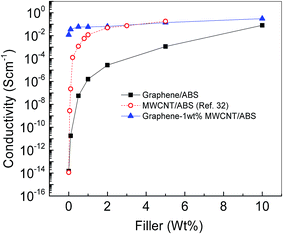 | ||
| Fig. 2 Conductivity of graphene/ABS, MWCNT/ABS and graphene-1 wt% MWCNT/ABS composites as a function of filler loading. | ||
Earlier, a MWCNT/ABS nanocomposites study32 discovered a very low value of the percolation threshold, at 0.1 wt%, for high aspect ratio tubular MWCNTs, and a saturation plateau with almost unchanging conductivities for a wider range of higher filler concentrations [Fig. 2]. This behavior is attributed to the exceptional transport properties of the MWCNTs and their efficiency in establishing a superior conductive network at much lower filler concentrations. To make use of the exceptional properties of MWCNTs, a fixed amount of MWCNTs (1 wt%) was incorporated in all graphene/ABS nanocomposites in this work. Fig. 2 illustrates the performance of the σ curve for graphene-1 wt% MWCNT/ABS nanocomposites with different loadings of graphene. It can be seen that the curve is almost flat and that σ changes from 1.2 × 10⁻² S cm−1 to 3.08 × 10⁻¹ S cm−1 for 0.1 wt% to 10 wt% of graphene content, suggesting some additional graphene–graphene contacts by means of the MWCNTs. The addition of 1 wt% of MWCNTs improved the σ of all compositions of the graphene/ABS nanocomposites. This improvement in σ is predictable, since the addition of MWCNTs increases the graphene–graphene connectivity by bridging graphene particles in the conductive networks of graphene. Extra conductive channels of MWCNTs provide additional pathways and facilitate the electron transport between unconnected graphene flakes, resulting in an enhanced conductivity. For higher graphene content (far above the percolation threshold), the connectivity between graphene improves and gaps would be fewer. Gaps between aggregates of flake-shaped graphene are logical. At this stage, the addition of MWCNTs becomes less effective for the enhancement of σ. The σ of a 10 wt% graphene/ABS composite is less sensitive to the addition of MWCNTs. Comparative σ data of graphene/ABS and graphene-1 wt% MWCNT/ABS nanocomposites are presented in Table 1 for a close look.
| Graphene wt% | Conductivity (S cm−1) | |
|---|---|---|
| Graphene/ABS nanocomposites | Graphene-1 wt% MWCNT/ABS nanocomposites | |
| 0 | 1.51 × 10⁻¹⁴ | 1.20 × 10⁻² |
| 0.1 | 1.81 × 10⁻¹¹ | 3.58 × 10⁻² |
| 0.5 | 5.65 × 10⁻⁸ | 5.99 × 10⁻² |
| 1.0 | 1.60 × 10⁻⁶ | 5.86 × 10⁻² |
| 2.0 | 2.69 × 10⁻⁵ | 6.42 × 10⁻² |
| 5.0 | 1.13 × 10⁻³ | 1.40 × 10⁻¹ |
| 10.0 | 8.05 × 10⁻² | 3.10 × 10⁻¹ |
Power law fitting
The conductivity performance of the graphene/ABS nanocomposites as a function of graphene loading can be demonstrated within the framework of percolation theory. It was Kirkpatrick who first formally took the percolation theorems of Broadbent and Hammersley and applied them specifically to the problem of conductive particles in an insulating matrix. His work led to a simple power law dependence that could describe the dc electrical conductivity above and close to the percolation threshold:36–38| σ ∝ (ϕ − ϕc)t = σo(ϕ − ϕc)t. |
σ, ϕ, σo, ϕc and t symbolize here the conductivity of graphene/ABS, the volume fraction of graphene in ABS, the conductivity of the graphene, the critical volume fraction of graphene and the critical exponent, respectively. Fig. 3 represents power law fitting on the σ data of the graphene/ABS composites.
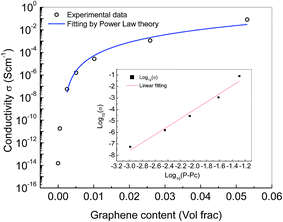 | ||
| Fig. 3 Theoretical fitting using percolation theory on conductivity data of the graphene/ABS composites. | ||
The applicability of a power law to systems either with an insulating medium (infinite resistance) or with a conducting filler (zero resistance) has been acknowledged.32 The values of ABS and graphene are the nearest practical approach to such systems, and the above equation with the scaling parameter t would be valid. A best linear fit obtained for log![[thin space (1/6-em)]](https://www.rsc.org/images/entities/char_2009.gif) σ vs. log(ϕ − ϕc)t using a ϕc = 1.5 × 10⁻³ vol fraction, equivalent to ∼0.3 wt% of graphene, is demonstrated in the inset of Fig. 3. This value of ϕc is between 0.0 wt% and 0.5 wt%, as perceived experimentally above. ϕc depends on the particle geometry, dispersion and the nature of conduction between particles. The theoretical value of σo found here is 1.07 × 10³ S cm−1, assessed through graphene/ABS composites fabricated at 75 MPa. This is close to the value of conductivity of graphene compacts fabricated at 5 MPa.39 A good quantitative correspondence between the experiment and theory has been identified. The maximum rms deviation between the calculated and experimental values is found to be 2.2 × 10⁻². Here, the low value of ϕc can be attributed to its nanostructure having a high aspect ratio. According to McLachlan et al., a low percolation threshold often corresponds to the use of filler particles with an elongated geometry.40 The relationship of elongated geometry, in addition to size and processing technique in favour of conducting pathways, to a low percolation threshold has been documented.41 The evaluated value of the critical index t for graphene/ABS here from the slope of the linear fit is 3.54 ± 0.05, compared to 2.74 ± 0.20 obtained through a solution mixing technique.27 However, this value was 4.18 ± 0.26 in the case of a graphene/polycarbonate nanocomposite.35 The value of t in conducting polymer composites depends on the complexity of the segregated conductive networks, and includes other influencing factors such as the morphology, dispersion and distribution of conductive fillers.42 Since t largely depends on the distribution of the tunneling distance within the conducting polymer composite material,38,43 the geometry of the conductive fillers inevitably influences t of the segregated conductive networks.
σ vs. log(ϕ − ϕc)t using a ϕc = 1.5 × 10⁻³ vol fraction, equivalent to ∼0.3 wt% of graphene, is demonstrated in the inset of Fig. 3. This value of ϕc is between 0.0 wt% and 0.5 wt%, as perceived experimentally above. ϕc depends on the particle geometry, dispersion and the nature of conduction between particles. The theoretical value of σo found here is 1.07 × 10³ S cm−1, assessed through graphene/ABS composites fabricated at 75 MPa. This is close to the value of conductivity of graphene compacts fabricated at 5 MPa.39 A good quantitative correspondence between the experiment and theory has been identified. The maximum rms deviation between the calculated and experimental values is found to be 2.2 × 10⁻². Here, the low value of ϕc can be attributed to its nanostructure having a high aspect ratio. According to McLachlan et al., a low percolation threshold often corresponds to the use of filler particles with an elongated geometry.40 The relationship of elongated geometry, in addition to size and processing technique in favour of conducting pathways, to a low percolation threshold has been documented.41 The evaluated value of the critical index t for graphene/ABS here from the slope of the linear fit is 3.54 ± 0.05, compared to 2.74 ± 0.20 obtained through a solution mixing technique.27 However, this value was 4.18 ± 0.26 in the case of a graphene/polycarbonate nanocomposite.35 The value of t in conducting polymer composites depends on the complexity of the segregated conductive networks, and includes other influencing factors such as the morphology, dispersion and distribution of conductive fillers.42 Since t largely depends on the distribution of the tunneling distance within the conducting polymer composite material,38,43 the geometry of the conductive fillers inevitably influences t of the segregated conductive networks.
Electromagnetic shielding
Electromagnetic interference (EMI) shielding refers to the blocking of radiation from one area to another by using a shield. The quality of EMI shielding is determined by the shielding effectiveness (SE). In terms of dB, SE is defined as follows:SE = 10![[thin space (1/6-em)]](https://www.rsc.org/images/entities/char_2009.gif) log10(Pt/Pi) = 10 log10(Pt/Pi) = 10![[thin space (1/6-em)]](https://www.rsc.org/images/entities/char_2009.gif) log10(T) = S12, log10(T) = S12, |
RL = 10![[thin space (1/6-em)]](https://www.rsc.org/images/entities/char_2009.gif) log10(Pr/Pi) = 10 log10(Pr/Pi) = 10![[thin space (1/6-em)]](https://www.rsc.org/images/entities/char_2009.gif) log10(R) = S11, log10(R) = S11, |
| R = Pr/Pi; T = Pt/Pi; A = 1 − (R + T). |
Here, the return loss (RL) enumerates the number of decibels that the reflected signal is lower than the incident signal. The reflectance (R), transmittance (T) and absorbance (A) are fractions of the incident powers reflected, transmitted and absorbed. Pi, Pt and Pr stand for incident, transmitted and reflected power, respectively. S11/S22 and S12/S21 are the scattering parameters, which can be correlated with R and T:
| R = 10(S11/10); T = 10(S12/10); A = 1 − (R + T). |
The main mechanisms that contribute towards shielding are reflection, absorption and multiple reflections.20 Reflection is a surface phenomenon and it occurs at the interface of two materials. Absorption, on the other hand, is a volumetric phenomenon, and various dielectric and magnetic losses contribute to absorption. The third mechanism, multiple reflections, arises due to multiple reflections of waves between two boundaries of shields. The contribution of multiple reflections is generally ignored when the thickness of a shield is greater than skin depth or when the SE due to absorption is more than 10 dB.44 Thus,
| SE = SEref + SEabs. |
SEref and SEabs are the SE due to reflection and absorption correspondingly:
SEref = 10![[thin space (1/6-em)]](https://www.rsc.org/images/entities/char_2009.gif) log10(Ppen/Pi) = 10 log10(Ppen/Pi) = 10![[thin space (1/6-em)]](https://www.rsc.org/images/entities/char_2009.gif) log10(1 − R), log10(1 − R), |
SEabs = 10![[thin space (1/6-em)]](https://www.rsc.org/images/entities/char_2009.gif) log10(Pt/Ppen) = 10 log10(Pt/Ppen) = 10![[thin space (1/6-em)]](https://www.rsc.org/images/entities/char_2009.gif) log10T/(1 − R). log10T/(1 − R). |
When an EM wave comes across a barricade, a fraction of it gets reflected from the surface, and the remaining penetrates into the barrier. Some would be absorbed, and what is left over would be transmitted. The effective value of absorbance is considered as Aeff, which refers to the fraction of penetrated power and is defined as the ratio of power absorbed (Pabs) to the power that penetrated (Ppen).
The SE, SEref and SEabs in dB have been evaluated through measurements and the relations stated above. Fig. 4(a)–(c) display their variation as a function of frequency for various compositions of the graphene/ABS nanocomposites. The SE is found to be nearly independent of frequency in the X band, as observed in Fig. 4(a). The SE increases first slowly and then rapidly with increasing graphene content. Up to 2 wt% graphene, the increase in SE is small. The maximum value of the SE, ∼23 dB, is at 10 wt% graphene. Fig. 4(b) and (c) show that the SEref and SEabs increase with increasing graphene content. The SEabs increases much faster than the SEref. The SE performance is in contrast to the σ, which increases rapidly at lower graphene content, approaching saturation at higher graphene loadings (Fig. 1). This indicates that σ is not the only decisive factor that determines the SE of the materials. Undoubtedly, some additional factors also play a significant role. It is worthwhile to mention that the conduction mechanism requires connectivity between conductive pathways, whereas shielding does not.20,33 Presumably, the nanostructure of the conductive network determines the shielding performance of a nanocomposite material by the type of dispersed filler, its size, shape and distribution in the matrix.42
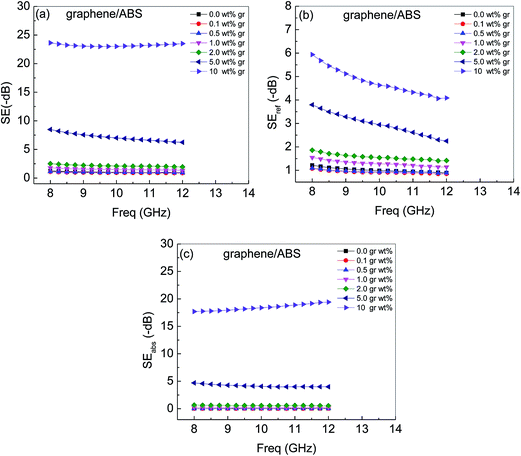 | ||
| Fig. 4 (a) SE, (b) SEref and (c) SEabs for the graphene/ABS nanocomposites as a function of frequency. | ||
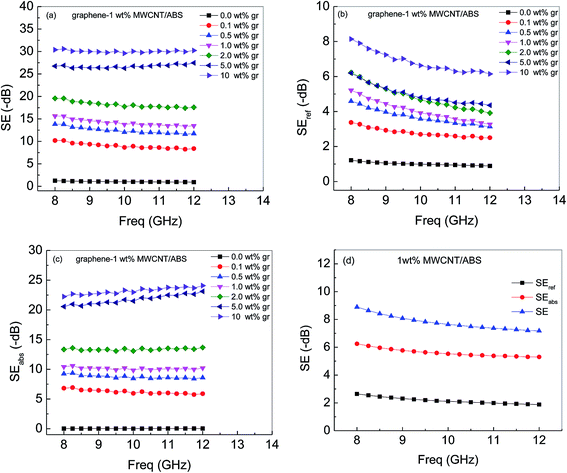
For the graphene-1 wt% MWCNT/ABS nanocomposites, the SE, SEref and SEabs as a function of frequency in the X-band range for various graphene contents are displayed in Fig. 5(a)–(c), while Fig. 5(d) shows this for a 1 wt% MWCNT/ABS nanocomposite.
The SE, SEref and SEabs are observed to increase with increasing graphene content. The SE is nearly independent of frequency in the 8–12 GHz range. The addition of 1 wt% MWCNTs together with graphene particles in ABS has probably provided linkages of graphene particles through the formation of an exceptional conductive network. This network increases the inter-nanostructure connections responsible for the improved conductivities. The comparative values of σ (Table 1) for the graphene/ABS and graphene-1 wt% MWCNT/ABS validate this conjecture. Also, this interconnected structure of a fine mesh of MWCNTs decked with graphene flakes was predicted to achieve enhanced EMI shielding properties. The SEabs is dominant for all levels of graphene content in the graphene-1 wt% MWCNT/ABS nanocomposites. The maximum improvement in SE is for the 5 wt% graphene/ABS composites. The SE for the 5 wt% graphene-1 wt% MWCNT/ABS increased to 26.3 dB from 7.5 dB for the graphene/ABS nanocomposite, while this increase is 29.9 dB compared to 23.05 dB for the 10 wt% graphene-1 wt% MWCNT/ABS. Thus the improvement in SE with the addition of 1 wt% MWCNTs is smaller with increasing graphene content above 5 wt%.
Evaluated values of ‘R’, ‘T’, ‘A’ and ‘Aeff’
The reflectance, absorbance, transmittance and Aeff of the graphene/ABS composites and the graphene–MWCNT/ABS composites for different loadings of graphene are shown in Fig. 6(a) and (b).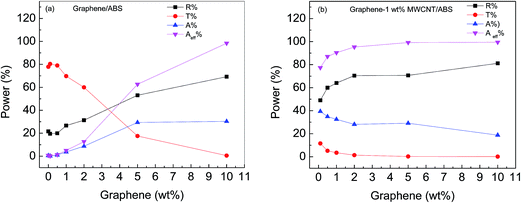 | ||
| Fig. 6 Reflectance, absorbance, transmittance and Aeff of the (a) graphene/ABS and (b) graphene-1 wt% MWCNT/ABS composites, for various graphene loadings. | ||
For the graphene/ABS composites, R increases with the increase in the graphene loading. A does not follow the same trend; it increases initially up to 5 wt% of graphene, but a further increase in the graphene content does not improve the A, whereas Aeff (the real absorbance, which refers to the fraction of penetrated power) increases and surges more after 2 wt% graphene. Aeff is higher all the way than A. The reason behind this is the sequence of attenuation as a result of reflection and absorption. The reflection occurs before absorption. The percentage of wave energy that enters the shield is 1 − R. Initially, both R and A increase with the increase in graphene loading. The addition of 1 wt% MWCNTs improves both the reflectance and the absorbance compared to graphene/ABS, while the Aeff initially increases and becomes almost constant with graphene >2 wt%. The contribution of reflection is more than that of absorption for both the graphene/ABS and the graphene-1 wt% MWCNT/ABS nanocomposites for all compositions of graphene.
Morphology
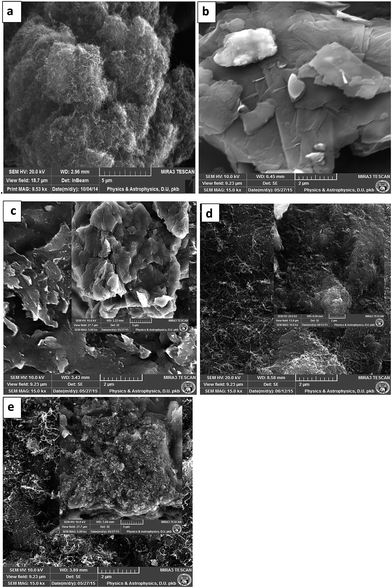
Morphology studies of the graphene/ABS and graphene-1 wt% MWCNT/ABS nanocomposites validate the experimental observations and results. Fig. 7(a)–(e) show representative FESEM micrographs at 15![[thin space (1/6-em)]](https://www.rsc.org/images/entities/char_2009.gif) 000 magnification (except Fig. 7(a), which is at 9530 magnification) for the virgin MWCNT and graphene powders and for pellets of 1 wt% graphene/ABS, 1 wt% MWCNT/ABS and 1 wt% graphene-1 wt% MWCNT/ABS. The inset micrographs in Fig. 7(c)–(e) at relatively lower magnifications display the microstructure. The pellets were freeze-fractured for cross-sectional views. Fig. 7(a) and (b) confirm the tubular and flake-like geometry of the MWCNTs and the graphene. The tube-shaped structure of the MWCNTs is much smaller than the flake-like structure of the graphene. In Fig. 7(c) and (d), the flake-shaped graphene and tube-shaped nanotubes are consistently dispersed and embedded within the ABS matrix. Gaps between aggregates of the flake-shaped graphene and tube-shaped nanotubes are obvious. The gaps in the MWCNTs/ABS [Fig. 7(d)] are much smaller than those in the graphene/ABS [Fig. 7(c)]. This can be attributed to the tubular and flake shapes of the MWCNTs and graphene, besides the relatively larger aspect ratios of the MWCNTs.
000 magnification (except Fig. 7(a), which is at 9530 magnification) for the virgin MWCNT and graphene powders and for pellets of 1 wt% graphene/ABS, 1 wt% MWCNT/ABS and 1 wt% graphene-1 wt% MWCNT/ABS. The inset micrographs in Fig. 7(c)–(e) at relatively lower magnifications display the microstructure. The pellets were freeze-fractured for cross-sectional views. Fig. 7(a) and (b) confirm the tubular and flake-like geometry of the MWCNTs and the graphene. The tube-shaped structure of the MWCNTs is much smaller than the flake-like structure of the graphene. In Fig. 7(c) and (d), the flake-shaped graphene and tube-shaped nanotubes are consistently dispersed and embedded within the ABS matrix. Gaps between aggregates of the flake-shaped graphene and tube-shaped nanotubes are obvious. The gaps in the MWCNTs/ABS [Fig. 7(d)] are much smaller than those in the graphene/ABS [Fig. 7(c)]. This can be attributed to the tubular and flake shapes of the MWCNTs and graphene, besides the relatively larger aspect ratios of the MWCNTs.
These gaps or filler-depleted areas contain ABS only, which is transparent to EM waves, and they act as windows for EM waves to escape. Fig. 2 corroborates the interpretation that at a low filler content (1 wt% graphene), the nanocomposite is in the semi-conducting range, but the observed SE (∼1.6 dB) value in Fig. 4(a) is poor. This small value of the SE demonstrates that the EM waves escape through the gaps containing pristine ABS matrix among the graphene flakes, which are perhaps higher in number and greater in size [Fig. 7(c)]. At higher graphene loadings, these gaps would be smaller in size and fewer in number, since increasing the graphene content decreases the average distance between graphene particles in the matrix. For 5 wt% of graphene, the SE improved to 7.5 dB, which was further boosted to ∼23 dB on 10 wt% loading of graphene (shown in Fig. 4(a)), authenticating this judgement. This opinion is further strengthened while looking at the SE behavior of the 1 wt% graphene-1 wt% MWCNT/ABS nanocomposite in Fig. 5(a), where decreasing of the gaps results in a comparatively better SE (∼14.6 dB) compared to that of 1 wt% graphene/ABS (∼1.6 dB). The MWCNT/ABS composite in Fig. 7(d) and the MWCNT–graphene/ABS composite in Fig. 7(e) show conductive web/mesh-like networks of MWCNTs. The conductive mesh structure is capable of capturing EM radiation like a Faraday cage. It is worth mentioning that to intercept EM waves effectively, the aperture of the conductive mesh size should be comparable or less than the wavelength of the interacting radiation. The addition of 1 wt% MWCNTs together with graphene particles in ABS has provided a sheath linking the graphene particles through the formation of a unique conductive network. Graphene flakes linked by means of MWCNTs would help to achieve the improved shielding properties. On addition of 1 wt% MWCNTs in 5 wt% graphene/ABS, the enhancement of the SE from 7.5 dB to 26.3 dB confirms this finding.
Synergic effect
In order to evaluate the effect of the addition of 1 wt% MWCNTs on graphene/ABS nanocomposites, graphs of the SE as a function of graphene loading at 8, 9, 10 and 12 GHz are shown in Fig. 8(a)–(d) respectively.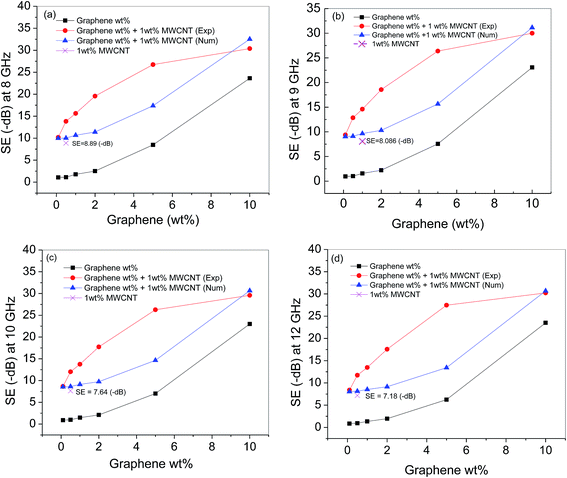 | ||
| Fig. 8 Synergic effect of 1 wt% MWCNTs on the SE of graphene/ABS nanocomposites at frequencies of (a) 8 GHz, (b) 9 GHz, (c) 10 GHz and (d) 12 GHz. | ||
The symbols ■, ×, ◀ and ● indicate the values for graphene/ABS, 1 wt% MWCNT/ABS, graphene/ABS+ and 1 wt% MWCNT/ABS (sum of the individual values) and graphene-1 wt% MWCNT/ABS (experimental), respectively. The synergic effect of 1 wt% MWCNTs on graphene/ABS for the SE can be clearly noticed while looking at the data shown by symbol ● (experimentally evaluated) for graphene-1 wt% MWCNT/ABS compared to those represented by ◀ (numerically-added individual values). The numerically added values of SE marginally decreases with increase in frequency, for the reason SE for 1 wt% MWCNTs decreases with increasing frequency. The reason for the synergy is attributed to the morphology of the hybrid conductive network. MWCNTs in the hybrid network act as bridging channels that improve the connectivity between graphene flakes, ultimately improving the electrical conduction in the network. For low graphene loadings, the gaps in the graphene/ABS are logically higher in number and greater in size. At higher graphene loadings, these gaps would be smaller in size and fewer in number, since increasing the graphene content decreases the average distance between graphene particles in the matrix. Thus the role of MWCNTs becomes less important for higher graphene content, which is the main reason that the synergy effect is different under low and high graphene contents.
Conclusion
In conclusion, a synergistic effect has been observed in the EMI shielding performance of ABS composites using mixtures of graphene and MWCNTs. Dispersion of the graphene and MWCNTs, attributable to distinctive and diverse morphologies, allowed the design of a superior conductive network. The addition of a small quantity of MWCNTs in the graphene/ABS composites was fairly adequate to improve the connectivity of the graphene network for a low electrical percolation threshold. The improvement in the EMI shielding of the composites is attributed to the connectivity of the conductive network formed by the MWCNTs and graphene in combination. The composite with 5 wt% of graphene showed the maximum improvement in shielding effectiveness by the addition of 1 wt% MWCNTs. The SE increased to 26.3 dB from 7.5 dB, showing an overall improvement of ∼19.8 dB. Comparison of R and A suggests that the contribution of reflection is more than that of absorption in the total attenuation of waves. >2 wt% graphene in graphene-1 wt% MWCNT/ABS nanocomposites produced Aeff values of ∼95–99%. These findings suggest that MWCNTs can be used in small quantities along with graphene to improve the electrical conductivity and EMI shielding properties of nanocomposites, aimed at reducing the cost of materials for product applications.References
- S. E. Lapinsky and A. C. Easty, J. Crit. Care, 2006, 21, 267–270 CrossRef PubMed.
- I. Baba, T. Ito, H. Furuhata, T. Nojima, T. Kano, S. Tsubota and S. Watanabe, J. Clin. Eng., 1998, 23, 122–134 CrossRef.
- N. Lawrentschuk and D. M. Bolton, Med. J. Aust., 2004, 181, 145–149 Search PubMed.
- E. Jay, in AIAA Guidance, Navigation, and Control Conference and Exhibit, American Institute of Aeronautics and Astronautics, 2005 Search PubMed.
- G. Masetti, S. Graffi, D. Golzio and Z. M. Kovács-V, Microelectron. Reliab., 1996, 36, 955–972 CrossRef.
- S. Graffi, Z. M. V. Kovács-V, G. Masetti and D. Golzio, Microelectron. Reliab., 1992, 32, 1551–1557 CrossRef.
- R. W. Habash, L. M. Brodsky, W. Leiss, D. Krewski and M. Repacholi, Crit. Rev. Biomed. Eng., 2003, 31, 56 Search PubMed.
- R. W. Habash, L. M. Brodsky, W. Leiss, D. Krewski and M. Repacholi, Crit. Rev. Biomed. Eng., 2003, 31, 58 Search PubMed.
- P. A. Valberg, T. E. van Deventer and M. H. Repacholi, Environ. Health Perspect., 2007, 416–424 Search PubMed.
- J. D. Boice and R. E. Tarone, J. Natl. Cancer Inst., 2011, 1211 CrossRef PubMed.
- A. Ahlbom, U. Bergqvist, J. Bernhardt, J. Cesarini, M. Grandolfo, M. Hietanen, A. Mckinlay, M. Repacholi, D. Sliney and J. Stolwijk, Health Phys., 1998, 74, 494–522 Search PubMed.
- ANSI Std C95.1-1982, 1982, 0_1.
- IEEE Std C95.1™-2005, (Revision of IEEE Std C95.1-1991), 2005.
- X. C. Tong, Advanced Materials and Design for Electromagnetic Interference Shielding, Taylor & Francis, 2008 Search PubMed.
- I. E. P. World Health Organization, Agenda for research, http://www.who.int/peh-emf/research/agenda/en.
- D. Chung, J. Mater. Eng. Perform., 2000, 9, 350–354 CrossRef CAS.
- J.-M. Thomassin, C. Jérôme, T. Pardoen, C. Bailly, I. Huynen and C. Detrembleur, Mater. Sci. Eng., R, 2013, 74, 211–232 CrossRef.
- J.-C. Huang, Adv. Polym. Technol., 1995, 14, 137–150 CrossRef CAS.
- S. Geetha, K. K. Satheesh Kumar, C. R. K. Rao, M. Vijayan and D. C. Trivedi, J. Appl. Polym. Sci., 2009, 112, 2073–2086 CrossRef CAS.
- D. D. L. Chung, Carbon, 2001, 39, 279–285 CrossRef CAS.
- Z. Fan, G. Luo, Z. Zhang, L. Zhou and F. Wei, Mater. Sci. Eng., B, 2006, 132, 85–89 CrossRef CAS.
- N. Li, Y. Huang, F. Du, X. He, X. Lin, H. Gao, Y. Ma, F. Li, Y. Chen and P. C. Eklund, Nano Lett., 2006, 6, 1141–1145 CrossRef CAS PubMed.
- W.-S. Jou, H.-Z. Cheng and C.-F. Hsu, J. Electron. Mater., 2006, 35, 462–470 CrossRef CAS.
- Z. Spitalsky, D. Tasis, K. Papagelis and C. Galiotis, Prog. Polym. Sci., 2010, 35, 357–401 CrossRef CAS.
- Y. Mamunya, Carbon Nanotubes as Conductive Filler in Segregated Polymer Composites-Electrical Properties, INTECH Open Access Publisher, 2011 Search PubMed.
- C. K. Das, P. Bhattacharya and S. S. Kalra, J. Mater. Sci. Res., 2012, 1, p126 Search PubMed.
- S. Stankovich, D. A. Dikin, G. H. B. Dommett, K. M. Kohlhaas, E. J. Zimney, E. A. Stach, R. D. Piner, S. T. Nguyen and R. S. Ruoff, Nature, 2006, 442, 282–286 CrossRef CAS PubMed.
- H. Kim, A. A. Abdala and C. W. Macosko, Macromolecules, 2010, 43, 6515–6530 CrossRef CAS.
- T. Kuilla, S. Bhadra, D. Yao, N. H. Kim, S. Bose and J. H. Lee, Prog. Polym. Sci., 2010, 35, 1350–1375 CrossRef CAS.
- M. L. Sham, J. Li, P. C. Ma and J.-K. Kim, J. Compos. Mater., 2009, 43, 1537–1564 CrossRef CAS.
- Y. Yang, M. C. Gupta and K. L. Dudley, Nanotechnology, 2007, 18, 345701 CrossRef.
- S. K. Sharma, R. P. Tandon and V. K. Sachdev, RSC Adv., 2014, 4, 60733–60740 RSC.
- V. K. Sachdev, S. Bhattacharya, K. Patel, S. K. Sharma, N. C. Mehra and R. P. Tandon, J. Appl. Polym. Sci., 2013, 131, 40201 Search PubMed.
- J. Glatz-Reichenbach, J. Electroceram., 1999, 3, 329–346 CrossRef.
- M. Yoonessi and J. R. Gaier, ACS Nano, 2010, 4, 7211–7220 CrossRef CAS PubMed.
- D. Stauffer and A. Aharony, Introduction To Percolation Theory, Taylor & Francis, 1994 Search PubMed.
- S. Xu, O. Rezvanian, K. Peters and M. A. Zikry, Nanotechnology, 2013, 24, 155706 CrossRef CAS PubMed.
- S. Kirkpatrick, Rev. Mod. Phys., 1973, 45, 574–588 CrossRef.
- B. Marinho, M. Ghislandi, E. Tkalya, C. E. Koning and G. de With, Powder Technol., 2012, 221, 351–358 CrossRef CAS.
- D. S. McLachlan, M. Blaszkiewicz and R. E. Newnham, J. Am. Ceram. Soc., 1990, 73, 2187–2203 CrossRef CAS.
- S. Bhattacharya, R. P. Tandon and V. K. Sachdev, J. Mater. Sci., 2009, 44, 2430–2433 CrossRef CAS.
- H. Pang, L. Xu, D.-X. Yan and Z.-M. Li, Prog. Polym. Sci., 1908-1933, 39 Search PubMed.
- I. Balberg and N. Binenbaum, Phys. Rev. B: Condens. Matter Mater. Phys., 1983, 28, 3799–3812 CrossRef.
- P. Saini and M. Arora, Microwave Absorption and EMI Shielding Behavior of Nanocomposites Based on Intrinsically Conducting Polymers, Graphene and Carbon Nanotubes, 2012 Search PubMed.
| This journal is © The Royal Society of Chemistry 2016 |

