 Open Access Article
Creative Commons Attribution 3.0 Unported Licence
A novel single-phase white light emitting phosphor Ca9La(PO4)5(SiO4)F2:Dy3+: synthesis, crystal structure and luminescence properties
Haikun
Liu
a,
Libing
Liao
*a,
Maxim S.
Molokeev
 bc,
Qingfeng
Guo
a,
Yuanyuan
Zhang
a and
Lefu
Mei
*a
aBeijing Key Laboratory of Materials Utilization of Nonmetallic Minerals and Solid Wastes, National Laboratory of Mineral Materials, School of Materials Science and Technology, China University of Geosciences, Beijing, 100083, China. E-mail: clayl@cugb.edu.cn; mlf@cugb.edu.cn
bLaboratory of Crystal Physics, Institute of Physics, SB RAS, Krasnoyarsk 660036, Russia
cDepartment of Physics, Far Eastern State Transport University, Khabarovsk 680021, Russia
First published on 26th February 2016
Abstract
A novel single-phase white light emitting phosphor Ca9La(PO4)5(SiO4)F2:Dy3+ was prepared through traditional high-temperature solid state technology. The crystal structures of Ca9La(PO4)5(SiO4)F2 with or without Dy3+ ions were refined by the Rietveld method. The diffuse reflection spectra, excitation spectra, emission spectra, and decay times were characterized to investigate the photoluminescence properties for application in white light-emitting diodes. The results showed that the Ca9La(PO4)5(SiO4)F2:Dy3+ phosphor could efficiently assimilate n-UV light and emit blue (∼485 nm) and yellow light (∼580 nm), originating from the f–f transitions of Dy3+. The critical Dy3+ quenching concentration (QC) was determined to be about 15 mol%, and the corresponding QC mechanism was verified to be the dipole–dipole interaction. Additionally, the emission colors of all samples were located close to the ideal white light region, and the optimal chromaticity coordinates and correlated color temperature (CCT) were determined to be (x = 0.338, y = 0.336) and 5262 K. All the above results indicate that the as-prepared Ca9La(PO4)5(SiO4)F2:Dy3+ phosphor could serve as a promising candidate for white-light n-UV-LEDs.
1 Introduction
Over the past few decades, white-light-emitting diodes (w-LEDs) have been considered as the lighting sources with the most potential after incandescent lamps and energy saving lamps, and have attracted considerable attention because of their favorable advantages of high luminous efficiency, reliability and environmentally friendly characteristics.1–3 Presently, the most prevalent w-LEDs in the market generally can be fabricated by a combination of a blue InGaN chip and the yellow-emitting YAG:Ce phosphor on basis of the phosphor-converted emission mechanism. However, this approach faces a low color rendering index and a high correlated color temperature due to the lack of sufficient red component.4,5 Accordingly, another alternative method on fabricating w-LEDs is generated by means of near-ultraviolet (n-UV) chip LED assigned with the mixture of tricolor (blue, green and red) phosphors. This method also faces some disadvantages such as low luminescent efficiency due to the reabsorption of the blue light by the red and green phosphors.6 Therefore, it is instant for the development of a single-phase white-light emitting phosphor to widespread use in w-LEDs application.As an important member in solid state phosphor family, the apatite structure compounds have been extensively studied in solid-state illumination and display manufacturing owing to their stable and adjustable structure for optical materials.7,8 It is well known that the typical apatite compound has an iso-structure to the nature mineral fluorapatite Ca10(PO4)6F2, which belongs to the hexagonal symmetry system (space group of P63/m) with a general chemical formula as A10(PO4)6Z2, where A often represents divalent cations such as Ca2+, Mg2+, Ba2+, Fe2+, Sr2+, Mn2+, Pb2+ and so on. Meanwhile, [PO4]3− can also be isomorphically substituted by [SiO4]4−, [BO4]5−, and [VO4]3− anion groups under different conditions. And Z is always denoted by F, Cl, Br, or O.9–12 Since apatite-type compound possesses the capability of being substituted by versatile ions and forming host structure changeable solid solution, which may endow tunable luminescence and outstanding luminescent properties. That is to say, it is very interesting to build up new inorganic framework to obtain new compounds with apatite structure. Hitherto, several single-component white light emitting phosphors with apatite-type structure suitable for n-UV-pumped w-LED have been reported, such as, Ca2La8(GeO4)6O2:Eu3+/Dy3+,13 Mg2Y8(SiO4)6O2:Ce3+/Tb3+/Sm3+ (ref. 14) and Sr3.5Y6.5O2(PO4)1.5(SiO4)4.5:Ce3+/Tb3+/Mn2+.15 Recently, as a member of trivalent rare earth ions, dysprosium (Dy3+) ions have been received intensively research interests and widely used in luminescence materials because of their unique luminescence properties.16–18 Customarily, Dy3+ ions generate two dominant emissions in blue (475–500 nm) and yellow (570–600 nm) regions, which correspond to 4F9/2 → 6H15/2 (magnetic dipole transition) and 4F9/2 → 6H13/2 (electric dipole transition) transitions, respectively.19 To our knowledge, the electric dipole transitions of Dy3+ ions can be easily affected by the crystal field environment of the host lattice rather than the magnetic dipole transitions of Dy3+ ions. Thus, it is an effective strategy to obtain white light emission in Dy3+ activated luminescent materials by adjusting the chemical environment of the matrix. Consequently, we demonstrated a novel single-component white-light phosphor Ca9La(PO4)5(SiO4)F2:Dy3+ with apatite structure for UV-light emitting diodes via a high-temperature solid-state technology. In addition, the concentration quenching as well as lifetime studies of Dy3+ in Ca9La(PO4)5(SiO4)F2 phosphor was carried out in detail.
2 Experimental
Traditional high-temperature solid-state reaction method was employed to prepare Ca9La1−x(PO4)5(SiO4)F2:xDy3+ phosphors. CaCO3, (NH4)2HPO4, SiO2, NH4HF2, and Dy2O3 were mixed and ground according to the given stoichiometric ratio. An additional amount of NH4HF2 was mixed as flux and balanced the loss of F source at high temperature. Stoichiometric amounts of reactants were thoroughly mixed by grinded together in an agate mortar with a small amount of ethanol, then the final mixture was placed into an alumina crucible and annealed at 1450 °C in a reducing atmosphere (5% H2 + 95% N2) for 5 h. After this, the samples were furnace-cooled to room temperature, and ground again into powder for measurement.X-ray diffraction (XRD) patterns were recorded using an X-ray powder diffractometer (XD-3, PGENERAL, China) with Cu-Kα radiation (λ = 0.15406 nm) operated at 40 kV and 30 mA. The continuous scanning rate (2θ ranging from 10° to 70°) used as phase determination was 8° (2θ)/min. The powder diffraction data of Ca9La(PO4)5(SiO4)F2 and Ca9La0.9Dy0.1(PO4)5(SiO4)F2 for Rietveld analysis were collected at room temperature with a Bruker D8 ADVANCE powder diffractometer (Cu-Kα radiation) and linear VANTEC detector. The step size of 2θ was 0.02°, and the counting time was 3 s per step. Rietveld refinement was performed by using TOPAS 4.2.20 The measures of PL and photoluminescence excitation (PLE) spectra were carried out by a fluorescence spectrophotometer (F-4600, HITACHI, Japan) equipped with a photomultiplier tube operating at 400 V, and a 150 W Xe lamp was used as the excitation lamp. A 400 nm cutoff filter was used in the measurement to eliminate the second-order emission of source radiation. The diffuse-reflectance spectra (DRS) were recorded by UV-Visible spectrometer (TU-1901, China) with integration sphere. The room-temperature luminescence decay curves were obtained from a spectrofluorometer (Horiba, Jobin Yvon TBXPS) using a tunable pulse laser radiation as the excitation. All measurements were carried out at room temperature.
3 Results and discussion
3.1 Crystal structure of Ca9La(PO4)5(SiO4)F2
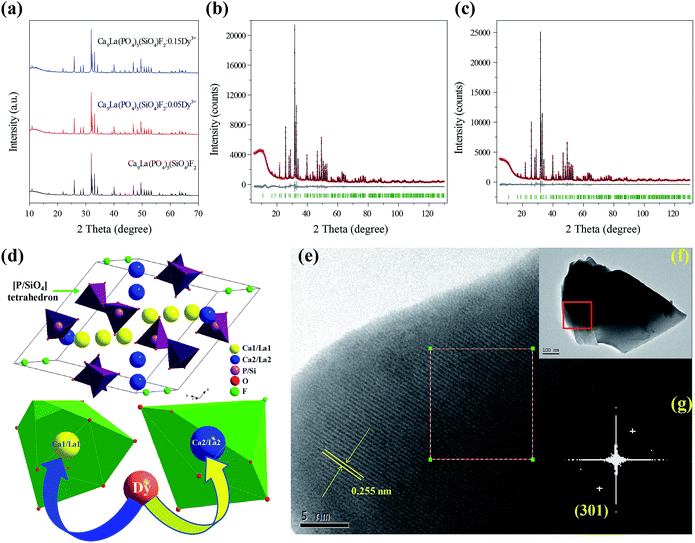
Fig. 1a shows the XRD profiles of as-prepared Ca9La(PO4)5(SiO4)F2, Ca9La0.95(PO4)5(SiO4)F2:0.05Dy3+ and Ca9La0.85(PO4)5(SiO4)F2:0.15Dy3+ phosphors. It is obvious that all the observed diffraction peaks are well indexed to the phases of Ca5(PO4)3F (JCPDS No. 15-0876) and no second phase is observed, which confirmed that the doping Dy3+ ions are completely incorporated into the host lattice and do not cause significant changes in the host.In order to further check the crystal structure of the synthesized phosphor, the Rietveld structural refinements for Ca9La(PO4)5(SiO4)F2 and Ca9La0.90(PO4)5(SiO4)F2:0.10Dy3+ compounds were performed based on the TOPAS 4.2 program. Almost all peaks were indexed by hexagonal cell (P63/m) with parameters very close to Ca9La(PO4)5(SiO4)F2 published earlier.21,22 Therefore this crystal structure was taken as starting model for Rietveld refinement. In this study, two independent sites of Ca were occupied by Ca, La and Dy ions with refined occupation and we assume the sum of occupancies in each site equals 1. Occupancies of P and Si in site were fixed according to suggested formula. No detectable impurity phase was observed in the obtained samples and we found all the observed peaks satisfy the reflection condition. The observed, calculated peaks and their difference for the Rietveld refinement are shown in Fig. 1b and c. Moreover, the final refined residual factors and refined structural parameters are summarized in Tables 1–3. It can be seen that all of the observed peaks satisfy the reflection condition and converge to Rexp = 3.33%, Rwp = 5.63%, Rp = 4.10%, χ2 = 1.69 in the refinement of the Ca9La(PO4)5(SiO4)F2 compound and Rexp = 3.63%, Rwp = 5.55%, Rp = 4.03%, χ2 = 1.53 in the refinement of the Ca9La0.9Dy0.1(PO4)5(SiO4)F2 compound, respectively. The unit cell parameters obtained for Ca9La(PO4)5(SiO4)F2 are a = 9.432 Å, c = 6.926 Å, and V = 533.61 Å3, which are larger than those for Ca9La0.9Dy0.1(PO4)5(SiO4)F2 shown in Table 1. The larger cell parameters are ascribed to the larger-sized La atoms as compared with Dy atoms.
| Compound | Ca9La(PO4)5(SiO4)F2 | Ca9La0.9Dy0.1(PO4)5(SiO4)F2 |
|---|---|---|
| Sp.gr. | P63/m | P63/m |
| a, Å | 9.4320(2) | 9.4272(2) |
| c, Å | 6.9261(1) | 6.9216(1) |
| V, Å3 | 533.61(2) | 532.72(2) |
| Z | 1 | 1 |
| Int2θ, ° | 5–130 | 5–130 |
| N re | 335 | 335 |
| N rp | 51 | 51 |
| R wp, % | 5.63 | 5.55 |
| R p, % | 4.10 | 4.03 |
| R exp, % | 3.33 | 3.63 |
| χ 2 | 1.69 | 1.53 |
| R B, % | 1.63 | 2.11 |
| x | y | z | B iso | Occ. | |
|---|---|---|---|---|---|
| La1 | 2/3 | 1/3 | −0.0003 (6) | 1.3 (1) | 0.042 (3) |
| Ca1 | 2/3 | 1/3 | −0.0003 (6) | 1.3 (1) | 0.958 (3) |
| La2 | 0.2395 (2) | −0.0115 (3) | 1/4 | 1.0 (1) | 0.158 (5) |
| Ca2 | 0.2395 (2) | −0.0115 (3) | 1/4 | 1.0 (1) | 0.842 (5) |
| Si | 0.3990 (4) | 0.3698 (3) | 1/4 | 0.6 (1) | 1/6 |
| P | 0.3990 (4) | 0.3698 (3) | 1/4 | 0.6 (1) | 5/6 |
| O1 | 0.5892 (8) | 0.4637 (9) | 1/4 | 1.5 (1) | 1 |
| O2 | 0.3288 (7) | 0.4849 (8) | 1/4 | 1.5 (1) | 1 |
| O3 | 0.3379 (5) | 0.2592 (5) | 0.0689 (6) | 1.5 (1) | 1 |
| F | 0 | 0 | 1/4 | 1.5 (1) | 1 |
| x | y | z | B iso | Occ. | |
|---|---|---|---|---|---|
| La1 | 2/3 | 1/3 | −0.0013 (4) | 1.24 (8) | 0.033 (2) |
| Ca1 | 2/3 | 1/3 | −0.0013 (4) | 1.24 (8) | 0.964 (2) |
| Dy1 | 2/3 | 1/3 | −0.0013 (4) | 1.24 (8) | 0.0036 (2) |
| La2 | 0.2401 (2) | −0.0109 (2) | 1/4 | 1.01 (8) | 0.132 (3) |
| Ca2 | 0.2401 (2) | −0.0109 (2) | 1/4 | 1.01 (8) | 0.854 (3) |
| Dy2 | 0.2401 (2) | −0.0109 (2) | 1/4 | 1.01 (8) | 0.0147 (3) |
| Si | 0.3984 (3) | 0.3684 (3) | 1/4 | 0.86 (9) | 1/6 |
| P | 0.3984 (3) | 0.3684 (3) | 1/4 | 0.86 (9) | 5/6 |
| O1 | 0.5876 (6) | 0.4650 (6) | 1/4 | 1.4 (1) | 1 |
| O2 | 0.3270 (5) | 0.4859 (5) | 1/4 | 1.4 (1) | 1 |
| O3 | 0.3353 (4) | 0.2529 (4) | 0.0718 (4) | 1.4 (1) | 1 |
As mentioned previously, Ca9La(PO4)5(SiO4)F2 belongs to apatite-type compound, which crystallizes in a hexagonal symmetrical system with space group P63/m and the detailed crystal structure diagram of Ca9La(PO4)5(SiO4)F2 compound is given in Fig. 1d. In this structure, there are two kinds of cationic sites labeled Ca/La(I) and Ca/La(II), the Ca/La(I) site is defined as being nine-fold coordinated with C3 point symmetry, and Ca/La(II) is defined as being seven-fold coordinated with Cs point symmetry, respectively. As depicted in Fig. 1d, the Ca/La(I) site is surrounded by nine O atoms: three O(1), three O(2) and three O(3), forming a CaO9-polyhedron with six short and three long Ca–O bonds. While the Ca/La(II) site is coordinated by six oxygen atoms O(1), O(2), four O(3), and a fluorine atom forming an irregular CaO6F-polyhedron.22 Considering the effective ionic radii and charge balance of cations with different coordination number (CN), the activators Dy3+ ions are predictable to occupy the La3+ sites randomly in the Ca9La(PO4)5(SiO4)F2 host, because the effective ionic radii of Dy3+ (r = 0.97 Å for CN = 7 and r = 1.083 Å for CN = 9) is closest to that of La3+ (r = 1.10 Å for CN = 7 and r = 1.216 Å for CN = 9).23 The fine local structures of Ca9La(PO4)5(SiO4)F2 are further examined by HRTEM, and the fast Fourier transform (FFT) images shown in Fig. 1e–g. It can be seen in Fig. 1e, the lattice fringes with a d spacing of 0.255 nm through the solved structure of the compound by refinement, which could be assigned to (301) plane. The d(301) enlarged (d(301) of 0.251 nm for Ca5(PO4)3F compound) slightly owing to the increase of the cell parameters with the substitution of La3+/Si4+ for Ca2+/P5+ ions as compared with the Ca5(PO4)3F compound.
3.2 Photoluminescence properties of Ca9La(PO4)5(SiO4)F2:Dy3+
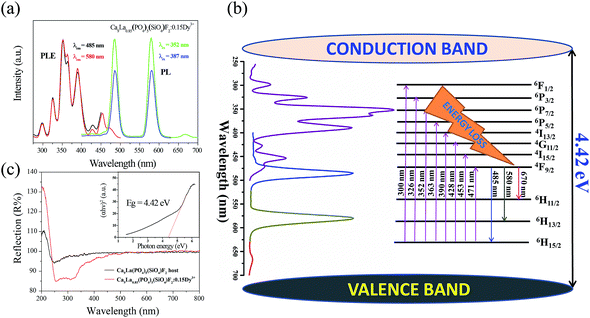
The photoluminescence excitation (PLE) spectra and PL spectra of Ca9La0.85(PO4)5(SiO4)F2:0.15Dy3+ under different monitoring wavelengths are demonstrated in Fig. 2a. Upon 352 and 387 nm excitation, this phosphor exhibits two similar prominent emission peaks in the visible wavelength region, one is locating in the blue region centered at 485 nm, which is attributed to the 4F9/2 → 6H15/2 (magnetic dipole transition) of the doped Dy3+ ions and the other is locating in the yellow region centered at 580 nm, which is corresponding to the 4F9/2 → 6H13/2 (electrical dipole transition) of the doped Dy3+ ions. Furthermore, few weak bands appeared in the red region, which is ascribed to 4F9/2 → 6H11/2 transition of the doped Dy3+ ions in Ca9La0.85(PO4)5(SiO4)F2:0.15Dy3+ phosphors.24The PLE spectrum of Ca9La0.85(PO4)5(SiO4)F2:0.15Dy3+ monitored at the blue region emission of Dy3+ (485 nm) is in consistent with that monitored at the yellow region emission of Dy3+ (580 nm) except for the tiny difference of the relative intensity. It is obvious that several sharp excitation peaks are found in the wavelength region of 275–500 nm to appear at 300, 326, 352, 363, 390, 428, 453 and 471 nm, which could be assigned to transitions from the 6H15/2 ground state to the excited states of Dy3+ 6F1/2, 6P3/2, 6P7/2, 6P5/2, 4I13/2, 4G11/2, 4I15/2, and 4F9/2 levels, respectively. The proposed energy levels scheme of Dy3+ ions in Ca9La(PO4)5(SiO4)F2 host upon excitation with UV radiation is presented in Fig. 2b. In view of the intense absorption band from 300–500 nm, the as-prepared Ca9La(PO4)5(SiO4)F2:Dy3+ phosphor can be used as a potential phosphor for UV/NUV LED lighting.
The UV-Vis reflection spectra of Ca9La(PO4)5(SiO4)F2 host and Ca9La0.85(PO4)5(SiO4)F2:0.15Dy3+ are described in Fig. 2c. The Ca9La(PO4)5(SiO4)F2 matrix exhibits an energy absorption in the region with wavelength less than 300 nm and a high reflection ranging from 300 to 800 nm. The band gap of the virgin Ca9La(PO4)5(SiO4)F2 can be estimated according to the following formula:25,26
| [F(R∞)hν]n = A(hν − Eg) | (1) |
| F(R∞) = (1 − R)2/2R = K/S | (2) |
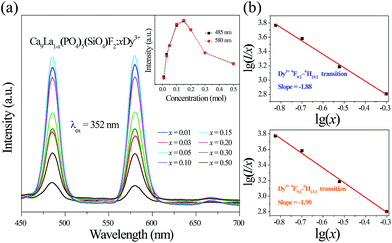
Fig. 3a gives PL spectra of Ca9La1−x(PO4)5(SiO4)F2:xDy3+ (x = 0.01–0.50) under the excitation of 352 nm. According to the inset of Fig. 3a, the optimal doping concentration of Dy3+ in Ca9La1−x(PO4)5(SiO4)F2:xDy3+ is fixed at x = 0.15, then the PL intensity begins to decrease, which could be ascribed to the internal concentration quenching effect via energy transfer from one activator to another. The interaction type between sensitizers or between sensitizer and activator can be estimated via the following equation:27–29
 | (3) |
The PL decay curves and lifetimes of Dy3+ for Ca9La1−x(PO4)5(SiO4)F2:xDy3+ (x = 0.01–0.50) phosphors under the excitation of 352 nm by monitoring different emission bands corresponding to the wavelength at 485 and 580 nm are shown in Fig. 4. It is found that all of the decay curves could be fitted successfully with a typical second-order exponential decay equation as follows:
I(t) = I0 + A1![[thin space (1/6-em)]](https://www.rsc.org/images/entities/char_2009.gif) exp(−t/τ1) + A2 exp(−t/τ1) + A2![[thin space (1/6-em)]](https://www.rsc.org/images/entities/char_2009.gif) exp(−t/τ2) exp(−t/τ2) | (4) |
| τ* = (Aτ12 + A2τ22)/(A1τ1 + A2τ2) | (5) |
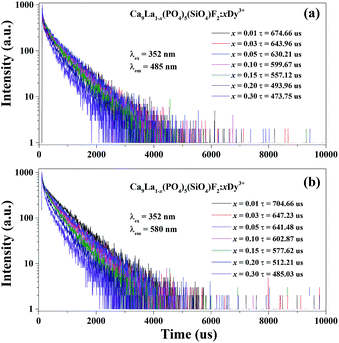 | ||
| Fig. 4 Decay curves of Dy3+ emission in Ca9La1−x(PO4)5(SiO4)F2:xDy3+ (x = 0.01–0.50) phosphors under excitation at 352 nm, monitored at (a) 485 nm and (b) 580 nm. | ||
An obvious phenomenon is found that the decay time begins to decrease gradually with the increasing of Dy3+ concentration. The decay lifetimes at 485 nm are estimated to be 674.66 us, 643.96 us, 630.21 us, 599.67 us, 557.12 us, 493.96 us, and 473.75 us. Meanwhile, the decay lifetimes at 580 nm are estimated to be 704.66 us, 647.23 us, 641.48 us, 602.87 us, 577.62 us, 512.21 us, and 485.93 us. The restrained lifetime is related to the total relaxation rate, which can be expressed by:30
 | (6) |
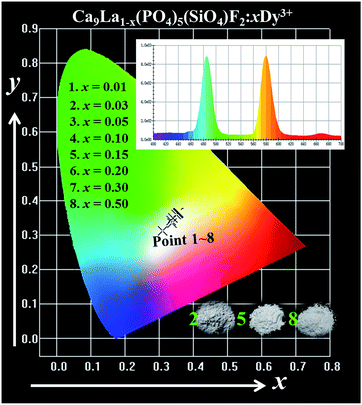
The variation of chromaticity coordination (x, y) of Ca9La1−x(PO4)5(SiO4)F2:xDy3+ (x = 0.01–0.50) excited under 352 nm are calculated based on the corresponding PL spectrum in the CIE 1931 chromaticity, and the chromaticity coordinates and CCT are summarized in Fig. 5 and Table 4, respectively. It can be seen that the emission colors of all of the as-prepared samples locate in the white light region. As we known, the standard white chromaticity coordination was selected with x = 0.333 and y = 0.333 in the CIE 1931 chromaticity. Generally, it exhibits a better white emitting quality when the chromaticity coordination closes to the ideal white chromaticity coordination (x = 0.333, y = 0.333).33 Therefore, the optimal chromaticity coordinates and CCT are designed as (x = 0.338, y = 0.336) and 5262 K, which indicates that Ca9La(PO4)5(SiO4)F2:Dy3+ could serve as a potential single phase white-emitting phosphor in solid-state lighting for white-light n-UV LED devices.
| Sample no. | Sample composition (x) | CIE coordinates (x, y) | CCT (K) |
|---|---|---|---|
| 1 | y = 0.01 | (0.311, 0.313) | 6776 |
| 2 | y = 0.03 | (0.338, 0.336) | 5262 |
| 3 | y = 0.05 | (0.351, 0.360) | 4835 |
| 4 | y = 0.10 | (0.358, 0.366) | 4597 |
| 5 | y = 0.15 | (0.356, 0.366) | 4663 |
| 6 | y = 0.20 | (0.355, 0.363) | 4688 |
| 7 | y = 0.30 | (0.341, 0.349) | 5145 |
| 8 | y = 0.50 | (0.335, 0.342) | 5401 |
The thermal stability of phosphor is one of the important issues for potential applications in high-power LEDs. Fig. 6 shows the temperature-dependent emission spectra for the selected Ca9La0.85(PO4)5(SiO4)F2:0.15Dy3+ phosphor under 390 nm excitation, and the relative emission intensities as a function of temperature were given in the inset of Fig. 6. It can be seen that the PL intensity slowly decreases with increasing temperature. Generally, the phosphors of white LED are require to sustain their emission efficiency up to 150 °C over a long term because the temperature of a LED package rises by the heat generation of LED itself during LED operation. When the temperature rose from room temperature to 150 °C, the PL intensities of Ca9La0.85(PO4)5(SiO4)F2:0.15Dy3+ phosphor decreased to 71% of the initial PL intensity, which indicates that the as-prepared phosphors has great potential application to meet the application requirements for n-UV LEDs.
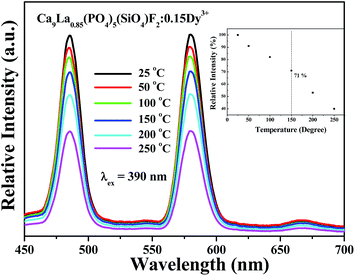 | ||
| Fig. 6 Temperature-dependent PL spectra of Ca9La0.85(PO4)5(SiO4)F2:0.15Dy3+ under different temperatures in the range of 25–300 °C. | ||
4 Conclusions
In summary, a series of novel white-light-emitting phosphors Ca9La1−x(PO4)5(SiO4)F2:xDy3+ were synthesized via a conventional solid-state reaction. Upon 352 nm excitation, these phosphors exhibits two intense emission bands centered at 485 and 580 nm, which ascribes to 4F9/2 → 6H15/2 and 4F9/2 → 6H13/2 transitions of Dy3+, respectively. The spectroscopic data and fluorescence decay dynamics indicate that the energy transfer process takes place between Dy3+–Dy3+ ions via a nonradiative dipole–dipole mechanism. All of the chromaticity coordinates of Ca9La1−x(PO4)5(SiO4)F2:xDy3+ are located in the proximity of the standard white chromaticity coordination, demonstrating Ca9La(PO4)5(SiO4)F2:Dy3+ can be regarded as a potential candidate in solid-state lighting combing with blue chip or near-UV chip.Acknowledgements
We gratefully acknowledge the financial support by the National Natural Science Foundations of China (Grant no. 41172053), the Fundamental Research Funds for the Central Universities (Grant no. 2652013043), and Science and Technology Innovation Fund of the China University of Geosciences (Beijing).Notes and references
- M. M. Shang, C. X. Li and J. Lin, Chem. Soc. Rev., 2014, 43, 1372 RSC.
- W. Lv, Z. D. Hao, X. Zhang, Y. S. Luo, X. J. Wang and J. H. Zhang, Inorg. Chem., 2011, 50, 7846 CrossRef PubMed.
- S. Tonzani, Nature, 2009, 459, 312 CrossRef CAS PubMed.
- C. H. Huang and T. M. Chen, J. Phys. Chem. C, 2011, 115, 2349 CAS.
- H. K. Liu, Y. Y. Zhang, L. B. Liao and Z. G. Xia, J. Lumin., 2014, 156, 49 CrossRef CAS.
- F. W. Kang, Y. Zhang and M. Y. Peng, Inorg. Chem., 2015, 54, 1462 CrossRef CAS PubMed.
- G. Zhu, Y. H. Wang, Z. P. Ci, B. T. Liu, Y. R. Shi and S. Y. Xin, J. Electrochem. Soc., 2011, 158, J236 CrossRef CAS.
- M. M. Shang, G. G. Li, D. L. Geng, D. M. Yang, X. J. Kang, Y. Zhang, H. Z. Lian and J. Lin, J. Phys. Chem. C, 2012, 116, 10222 CAS.
- D. Mazza, M. Tribaudino, A. Delmastro and B. Lebech, J. Solid State Chem., 2000, 155, 389 CrossRef CAS.
- M. M. Jiao, N. Guo, W. Lv, Y. C. Jia, W. Z. Lv, Q. Zhao, B. Q. Shao and H. P. You, Inorg. Chem., 2013, 52, 10340 CrossRef CAS PubMed.
- H. B. Liang, Q. Zeng and Z. F. Tian, J. Electrochem. Soc., 2007, 154, J177 CrossRef CAS.
- X. Chen, P. Dai, X. Zhang, C. Li, S. Lu, X. Wang, Y. Jia and Y. Liu, Inorg. Chem., 2014, 53, 3441 CrossRef CAS PubMed.
- Y. I. Jeon, K. Bharat and J. S. Yu, J. Alloys Compd., 2015, 620, 263 CrossRef CAS.
- J. Lin and Q. Su, J. Mater. Chem., 1995, 5, 1151 RSC.
- H. K. Liu, Y. Luo, Z. Y. Mao, L. B. Liao and Z. G. Xia, J. Mater. Chem. C, 2014, 2, 1619 RSC.
- Q. Long, C. Wang, Y. Y. Li, J. Y. Ding, X. C. Wang and Y. H. Wang, Mater. Res. Bull., 2015, 71, 21 CrossRef CAS.
- M. H. Tong, Y. J. Liang, G. G. Li, Z. G. Xia, M. F. Zhang, F. Yang and Q. Wang, Opt. Mater., 2014, 36, 1566 CrossRef CAS.
- Z. P. Ci, Q. S. Sun, S. C. Qin, M. X. Sun, X. J. Jiang, X. D. Zhang and Y. H. Wang, Phys. Chem. Chem. Phys., 2014, 16, 11597 RSC.
- Z. W. Zhang, A. J. Song, Y. Yue, H. Zhong, X. Y. Zhang, M. Z. Ma and R. P. Liu, J. Alloys Compd., 2015, 650, 410 CrossRef CAS.
- Bruker AXS TOPAS V4: General profile and structure analysis software for powder diffraction data. User's Manual, Bruker AXS, Karlsruhe, Germany, 2008 Search PubMed.
- H. Njema, K. Boughzala, H. Boughzala and K. Bouzouita, J. Rare Earths, 2013, 31, 897 CrossRef CAS.
- H. Njema, M. Debbichi, K. Boughzala, M. Said and K. Bouzouita, Mater. Res. Bull., 2014, 51, 210 CrossRef CAS.
- R. D. Shannon, Acta Crystallogr., Sect. A: Cryst. Phys., Diffr., Theor. Gen. Crystallogr., 1976, 32, 751 CrossRef.
- G. Blasse and B. C. Grabmaier, Luminescent Materials, Springer Verlag, Berlin, 1994 Search PubMed.
- H. Yu, D. G. Deng, D. T. Zhou, W. Yuan, Q. E. Zhao, Y. J. Hua, S. L. Zhao, L. H. Huang and S. Q. Xu, J. Mater. Chem. C, 2013, 1, 5577 RSC.
- H. K. Liu, Y. Y. Zhang, L. B. Liao, Q. F. Guo and L. F. Mei, Ceram. Int., 2014, 40, 13709 CrossRef CAS.
- G. G. Li, D. L. Geng, M. M. Shang, C. Peng, Z. Y. Cheng and J. Lin, J. Mater. Chem., 2011, 21, 13334 RSC.
- G. Blasse, W. L. Wanmaker, J. W. Tervrugt and A. Bril, Philips Res. Rep., 1968, 23, 189 CAS.
- H. Jing, C. F. Guo, G. G. Zhang, X. Y. Su, Z. Yang and J. H. Jeong, J. Mater. Chem., 2012, 22, 13612 RSC.
- Z. G. Xia, H. K. Liu, X. Li and C. Y. Liu, Dalton Trans., 2013, 42, 16588 RSC.
- G. Y. Lee, J. Y. Han, W. B. Im, S. H. Cheong and D. Y. Jeon, Inorg. Chem., 2012, 51, 10688 CrossRef CAS PubMed.
- J. Y. Han, W. B. Im, G. Y. Lee and D. Y. Jeon, J. Mater. Chem., 2012, 22, 8793 RSC.
- Z. Y. Mao, Y. C. Zhu, Y. Wang and L. Gan, J. Mater. Sci., 2014, 49, 4439 CrossRef CAS.
| This journal is © The Royal Society of Chemistry 2016 |

