Synthesis, characterization and fabrication of ultrathin iron pyrite (FeS2) thin films and field-effect transistors

Xi Liuabc, Jacob Y. L. Hoc, Man Wongc, Hoi Sing Kwokc and Zhaojun Liu*abc
aSun Yat-sen University – Carnegie Mellon University Joint Institute of Engineering, Sun Yat-sen University, Guangzhou, China. E-mail: eezhj@ust.hk
bSun Yat-sen University – Carnegie Mellon University Shunde International Joint Research Institute, Sun Yat-sen University, Guangdong, China
cState Key Lab on Advanced Displays and Optoelectronics, Department of Electronic and Computer Engineering, Hong Kong University of Science and Technology, Clear Water Bay, Kowloon, Hong Kong

Received 5th November 2015 , Accepted 4th January 2016

First published on 7th January 2016


Abstract

We reported a synthesis of an ultrathin FeS2 thin film via thermal sulfurization of an iron thin film and its fabrication process for field-effect transistors. Reaction time was found to be essential for the growth of the crystallized FeS2 thin film. The thickness of Fe increased from 10 nm to 35 nm after the reaction. The FeS2 thin film has a resistivity of 0.345 Ω cm and a Hall mobility of 7.1 cm2 V−1 s−1, with a carrier concentration of 2.89 × 1018 cm−3. The fabricated FeS2 transistors have a reported highest current on/off ratio of 3.94 × 10⁴ and Ion of 0.117 mA. Moreover, the FeS2 based transistor not only broader the applications of pyrite, but also provides a platform for investigation of FeS2 materials. Temperature-dependent electrical transport measurements confirmed the rich intrinsic defect states in the FeS2 thin film, which indicates that reducing intrinsic defect might be the key issue to further improve the device performance.

Introduction

Iron pyrite (FeS2), which is also known as fool's gold, is an intriguing semiconductor that is an abundant mineral in the Earth.1 It is widely found in quartz veins, sedimentary rocks and coal beds, and it has attracted continuous interest since the 1970s because it is a rich resource and has unique properties.2–5 FeS2 has a small band gap (0.8–0.95 eV) and a large light absorption coefficient (α = 6 × 105 cm−1, > 1.3 eV), making it a promising candidate for solar energy conversion.6,7 The highest reported electron carrier mobility is approximately 360 cm2 V−1 s−1, with a minority carrier diffusion length of 0.1–1 μm.8 These properties make FeS2 a potential alternative thin layer absorber for photovoltaic (PV)9 and photo-electrochemical solar cells.10

However, despite all the excellent properties of pyrite, the best pyrite-based solar cell only has an energy conversion efficiency of 3%.11 Researchers have experienced difficulties in improving its performance, primarily because of the low fill factor (approximately 0.5) and open circuit voltage (≤200 mV) caused by the high recombination loss and the rich density of the sulfur defect states.12,13 Additionally, the doping mechanism and method of FeS2 materials is not clear. These disadvantages prevent FeS2 from creating a p–n homojunction or a p–i–n junction in solar cells.14 With the emergence of other promising materials for thin film solar cells, including CuInGaSe2,15,16 the potential of FeS2 as a candidate for solar PV applications has waned.

Recently, FeS2 has attracted interest once again because of its low cost and potential applications for field-effect transistors (FETs).17 Several new synthesis methods have been described to improve the FeS2 thin film quality and properties, such as chemical vapor deposition (CVD),18,19 the sulfidation of Fe2O3,20 molecular beam epitaxy (MBE),21 sputtering,3,22 sol–gel,23 and electrodeposition.24 Moreover, substantial effort has been focused on the low-cost colloidal synthesis of pyrite nanocrystals.10,13 Different pyrite morphologies, such as nanowires, nanobelts and nanoplates,9 have also been synthesized and reported.

These synthetic improvements have led to broader applications besides PV and photo-electrochemical solar cell. For instance, Qihua Xiong et al.25 used FeS2 thin film as counter electrodes for Dye-Sensitized Solar Cells (DSSC) utilizing I3−/I and Co(III)/Co(II) as the electrolyte. The new (DSSC) gives a photoconversion efficiency around 8% which is comparable to Pt. Song Jin et al.26 utilized FeS2 nanowires as cathodes materials in Li-ion battery using a liquid electrolyte, which retains a discharge energy density of 534 W h kg−1 at 0.1C rate while has a discharge capacity of 350 mA h g−1. Other potential usage including hole transportation,9 photodetector,27 and even in agriculture.28 FeS2 is earth abundant and low cost materials. Hence the development in FeS2 application will benefit many different fields and further lower the cost for industry.

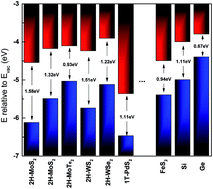
Although FeS2 has a very unique electrical properties, its potential usage in FETs has not yet been fully developed. Fig. 1 shows the computational band structure of FeS2 compared with those of other transition-metal dichalcogenides (TMDs) and commonly used semiconductors.29 The band gap of FeS2 is slightly smaller than that of silicon (1.1 eV), which makes it a natural alternative material for electrical devices. Other TMD materials, including MoS2 (∼1.29 eV) and WS2 (∼1.4 eV), usually have larger band gaps. Although there have been a few research reports addressing FeS2 FET devices, the performance of these devices remains far from satisfactory. For example, although a recently reported FeS2 nanowire FET device has a mobility of approximately 0.1–0.2 cm2 V−1 s−1 at a carrier concentration of approximately 2.9 × 1018 cm−3, it is difficult to pinch off, which leads to a low Ion/Ioff ratio for the output current.30,31 Some of the reported FeS2 thin film materials electrical properties is listed in Table 1 and compared with our work. A further understanding of the electrical transportation for materials and device is needed to further improve the performance of FeS2.


image file: c5ra23344e-f1.tif
Fig. 1 Absolute band edge positions of the selected materials.
Table 1 Reported FeS2 materials electrical properties
Mobility (cm2 V−1 s−1) Carrier concentration (cm−3) Thickness (nm) Resistivity (Ω cm) Reference
1.450 7.69 × 10¹⁸ 90 ± 10 0.5605 23
0.271 2.1 × 10²⁰ 70 0.11 32
11.8 2.5 × 10¹⁸ 400 0.58 33
2.12 4.90 × 10¹⁸ 200 ± 50 0.58 25
7.1 2.89 × 10¹⁸ 35 0.345 This work


In order to develop the application for FeS2 based FET, we studied the growth of FeS2 and improve the quality of the FeS2 thin film. We investigated the simplest synthesis among with the methods mentioned above: ex situ thermal sulfidation of an Fe thin film as Fig. 2. We synthesized a very thin films under atmosphere while many other similar methods require vacuum system. We also manage to obtain an ultrathin FeS2 film with low carrier concentration. The best FeS2 synthesized using this sulfidation time has a mobility of 7.1 cm2 V−1 s−1 and a Hall carrier concentration of approximately 2.9 × 1018 cm−3. It is a general method for synthesizing FeS2 thin film on different substrate, like quartz, for various application. For various applications, we can implement our method on selected substrates, like quartz, Al2O3, ZrO3 etc. We also developed a procedure for the fabrication of FeS2 thin film FETs. We studied the device electrical properties giving a Ion at 0.117 mA with an Ion/Ioff ratio of 3.94 × 10⁴, which is much higher than previously reported FeS2 transistors. The FeS2 based FETs provides us a general platform to study the properties of FeS2. For instance, we investigated the temperature dependence electrical measurement and it revealed a Mott variable range hopping (VRH) electron transport mechanism of FeS2 at low temperatures. It suggests that the carrier transport is dominated by intrinsic defects, which is consistent with previous reports.34 It indicates improve the performance of FeS2 needs to focus on how to reduce the defects states. Further research on FeS2 devices can also draw information from related works, such as the research on MoS2 FETs, which demonstrated that high-k dielectric gate materials might further increase the device performance and modulation capability.35


image file: c5ra23344e-f2.tif
Fig. 2 Schematic diagram of the home-built CVD reaction system.

Experiment section

FeS2 thin film fabrication

The FeS2 thin film was synthesized via two commonly used two-step ex-sulfurization processes. First, we deposited 10 nm of an Fe thin film on a pre-prepared SiO2/Si substrate using D.C. magnetron sputtering with an iron target. The SiO2 layer was approximately 300 nm and was deposited by low pressure chemical vapor deposition (LPCVD). The film was then placed in a custom-designed chemical vapor deposition furnace system on a quartz boat. The furnace set up is shown in Fig. 2, the sulfur was placed upstream, and the film was placed downstream. The sulfur was heated by a silicone rubber heat belt and controlled by a digital temperature controller. At 160 °C, the sulfur existed in both the liquid and gas phases. The mixture was sent into the furnace with argon at a rate of 200 sccm. The sulfurization temperature was held constant at 500 °C with a ramping speed of 10 °C min−1, as reported by other studies.6,9,14 We used reaction times of 180, 240 and 360 min, and the sulfur flow was stopped immediately after the reaction by removing the heat belt. After the sulfurization process, the system cooled to room temperature at the natural cooling rate. The same method is also used on quartz substrate with reaction time for 240 min for optical properties characterization.

FeS2 FET fabrication

The as-synthesized FeS2 thin film was first cleaned using four cycles of deionized (DI) water and then dry-etched with an induced coupled plasma (ICP) etcher after a photolithography process. After dry etching, the drain and source electrodes were defined by a second photolithography process, and then, Ni (200 Å)/Ti (700 Å)/Au (300 Å) stack layers were deposited via E-beam evaporation as the source/drain metal. Acetone and isopropanol were used for the lift-off process, and the device was cleaned with DI water.

Characterization

The thin film X-ray diffraction (TFXRD) pattern of the as-synthesized sample was collected on an Empyrean (PAN analytical) diffractometer using Cu Kα radiation. The tube current and tube tension were 40 mA and 40 kV, respectively. The data were collected from 20 degrees to 60 degrees with a measurement time of 1 second and 0.06 degrees per step. Raman spectra of the as-synthesized sample were collected on an InVia (Renishaw) confocal microscope using an Ar ion laser (514.5 nm and 50 mW). The resistivity, Hall mobility and carrier concentration were collected using a Resistivity/Hall Measurement System, Model HL5500PC (Bio-Rad). Silver paste was placed onto the thin film, which was then used for the four point measurement. The Atomic Force Microscopy (AFM) image was acquired using a Nanoscope-Multi Mode/Dimension 3100 system. The X-ray photoelectron spectroscopy analysis was performed with a PHI 5600 (Physical Electronics) surface analysis system with a monochromatic Al Kα X-ray source (1486.6 eV). Temperature dependence measurement was conducted using the Physical Property Measurement System (Quantum Design). Electrical measurements were collected with a Keithley 2182A nanovoltmeter and a 6221 ac/dc source.

Results and discussion

X-ray diffraction is the primary technique to determine the phase and quality of a thin film. Because of the small thickness, thin film X-ray diffraction (TFXRD) was used in our experiments. The XRD pattern of the as-synthesized FeS2 thin film is plotted in Fig. 3, including the 180, 240 and 360 min samples. All the peaks can be indexed to pyrite (JCPDS no. 00-026-0801), marcasite (JCPDS no. 00-003-0795) and silicon (JCPDS no. 00-003-0544). Increasing the sulfurization time clearly results in an orientation preference and a phase change in the FeS2 thin film. The 180 min and 240 min samples do not show the obvious existence of a marcasite phase, whereas the 360 min sample has clean peaks that represent a marcasite phase. It has been reported that the lattice constant of FeS2 ranges from 5.428 to 5.407 Å because of the sulfur vacancies.36,37 In our experiment, the average lattice parameter is 5.418 Å, which agrees with previous reports.9
image file: c5ra23344e-f3.tif
Fig. 3 XRD patterns of the 180, 240 and 360 min FeS2 thin film.

To further investigate the FeS2 phase, confocal micro-Raman spectroscopy was used. It has been shown that Raman spectroscopy is more sensitive to different phases of FeS2, and it is widely used in characterization. The Raman spectrum in Fig. 4 for the 180 min sample shows three peaks at 338 (S2 libration, Eg), 372 (S–S in-phase stretch, Ag) and 424 cm−1 (coupled libration and stretch, Tg(3)) that belong to pyrite.10,13,38 Increasing the sulfurization time to 240 min causes a blue shift of the peaks from 338 to 339 cm−1,from 372 to 374 cm−1 and 424 to 427 cm−1. The peak further blue shift to 341,[thin space (1/6-em)]376 and 427 cm−1 respectively when the reaction time increase to 360 min. It also generated of a marcasite peak at approximately 320 cm−1, which agrees with the TFXRD result. We attribute the blue shift to a strong interaction between the S–S and Fe–S bonds because of the longer annealing time.9,39,40


image file: c5ra23344e-f4.tif
Fig. 4 Raman spectra of the 180, 240 and 360 min FeS2 thin film.

AFM is a useful technique to study the morphology of thin films. In Fig. 5, the reaction time can be seen to have a critical impact on the thin film surface. For the reaction time of 180 min shown in Fig. 5a, the sample surface is extremely uneven with a surface roughness of approximately 17.47 nm. This sample is likely in the process of crystallization, and hence, the quality of the sample is poor. The gain is difficult to distinct. For the reaction time of 240 min shown in Fig. 5b, the quality of the thin film is clearly improved. The small grains are evenly distributed on the substrate, and the grain size is approximately 80 nm, which is comparable to reported results for other sulfurization methods.25 The surface roughness is also reduced to 6.41 nm. However, when the reaction time is increased to 360 min, the quality of the thin film becomes worse. The grains start to grow together and create small discontinuous areas, as shown in Fig. 5c, which gives a grain size around 90 nm. The surface roughness of the 360 min sample is slightly larger than for the 240 min sample (approximately 7.7 nm). The grain size is average of 50 gains in the AFM image.


image file: c5ra23344e-f5.tif
Fig. 5 AFM images of different samples.

XPS was then used to determine the elemental composition of the FeS2 thin film surface. The XPS spectra of the 240 min sample are shown in Fig. 6a. The peak at a binding energy of 162.4 eV is attributed to intrinsic bulk-like disulfides (BD) and belongs to S 2p3/2. S 2p1/2 has a peak at 163.5 eV, which is also characteristic of FeS2.13,41 Additionally, a small shoulder at 161.3 eV is attributed to surface disulfides (NSD and SD) on the {100} surface of iron pyrite caused by sulfur vacancies.12,13 The peak at 164.8 eV is often described as high energy, and it is caused by a core hole effect, as discussed in recent papers.13,42 All the results show that the FeS2 thin film surface contains many sulfur defects, which will be discussed later in the paper. Fig. 6b reveals the binding energies of the Fe 2p. The peaks at 707.1 eV and 719.8 eV belong to Fe–S 2p3/2 and Fe 2p1/2, respectively.20 The small peak at approximately 711 eV is attributed to Fe–O and is the result of exposure to air.43


image file: c5ra23344e-f6.tif
Fig. 6 XPS spectra of the 240 min FeS2 sample.

The optical property of the FeS2 thin film of our synthesis is also investigated. We grew FeS2 thin film on quartz substrate. Raman spectrum showed the FeS2 has very good quality in Fig. S1. Detail of the optical property can be seen in Fig. S2.

The electrical properties of the FeS2 thin film were studied and are shown in Fig. 7. The 240 min sample shows superior properties compared with the 180 and 360 min samples, primarily because of the improved crystallization, its mobility and carrier concentration are suitable for FETs. The values recorded for these properties are about 2.9 × 1018 cm−3 and 7.13 cm2 V−1 s−1, respectively, which are relatively high compared with other reports.10,34,44 Although the 360 min sample shows some discontinuity, it maintains a high conductivity because of the larger grain size.


image file: c5ra23344e-f7.tif
Fig. 7 Electrical properties of different samples of FeS2.

Based on the electrical properties of the FeS2 thin film, we fabricated FeS2 FETs using the 240 min sample, as mentioned in the Experimental section. A schematic and an optical microscope image of the FET are shown in Fig. 8a. There is a narrow edge (green edge and circled out) around the FET device, which will be discussed in detail later. Additionally, the cracks at the surface were generated by the device fabrication process. The thin film may have folded due to the stress, thus creating cracks. The thickness of the FeS2 thin film is approximately 35 nm, as measured by a profilometer, which is 3.5 times that of the iron thin film precursor deposited by E-beam evaporation. The expansion factor is consistent with other reported results.14,32 The transfer curve (Ids vs. Vg) and output curve (Ids vs. Vds) are shown in Fig. 8b and c, respectively. The device edge is also clearly shown in the insert image of Fig. 8b. An Ion/Ioff ratio of 3.94 × 10⁴ was obtained, which is larger than for any other FeS2 FET devices reported. Two steps are needed to increase the Id in the transfer curve. The first step, which has an Ion/Ioff ratio of approximately 104, is caused by the edge effect caused by the thin slice mentioned above. Although increasing the Vg will overcome the edge effect, the device will fully turn on at approximately Vg = −25 V. Although the change is small, the IdsVds in Fig. 8c shows that the active channel of the device can be modulated by the gate voltage. No saturation is observed in the output curve of the device, which indicates that further investigation is needed to increase the resistivity and reduce the carrier concentration of the FeS2 thin film. The details of the electrical performance of the FeS2 FET device are listed in Table 2. The device mobility requires attention because it is lower than the Hall mobility of the FeS2 thin film that was measured using the Resistivity/Hall system. This may be due to the thick gate dielectric that lowers the control ability of the gate voltage over the active channel. High-k dielectric materials, including Al2O3 and ZrO2, may increase the device mobility and enhance its performance.45


image file: c5ra23344e-f8.tif
Fig. 8 (a) Schematic of the FeS2 FET device, (b) the IdsVg with the image of channel edge, (c) the IdsVds curve and (d) the resistance vs. distance curve with the layout of the pads and TLM Structure.
Table 2 Parameters of the FeS2 FET device
Parameter Value Unit Parameter Value Unit
W/L 40/2 μm On–off ratio 3.94 × 10⁴  
Gate dielectric layer thickness 300 nm Vth −25 V
Cox 1.15 × 10⁻⁴ F m−2 Device mobility 0.223 cm2 V−1 s−1
On-state resistance 4.38 × 10⁵ Ω gm 0.256 μS
Off current 2.97 × 10⁻⁹ A ρ 0.96 Ω cm
On current 1.17 × 10⁻⁴ A Carrier concentration 2.94 × 1019 cm−3


To test the electrical contact used in the device, Fig. 8d shows the transmission line method (TLM) test of the FeS2 devices. The linear slope shows the ohmic contact for the FeS2 thin film. According to the slope, the device has a sheet resistance of approximately 3467 Ω sq−1, and the sheet resistance observed via the TLM is smaller than recorded using the Resistivity/Hall Measurement System, which may be due to the low contact resistance of the metal contact. Instead of pristine silver paste, a stack layer of Ti/Ni/Au was deposited by E-beam evaporation with the thickness 10 nm/90 nm/20 nm. Here, the thin Ti layer was used as the glue layer to improve the contact of the metal electrode with the FeS2 thin film. The layer of gold was used to reduce the contact resistance between the probes and the metal pads of devices during the measurement. Thus, the metal exhibited a low series resistance of approximately 1827 Ω, which is shown at the plot intercept in Fig. 8d.46

Although the Ion/Ioff ratio is much higher than previous reported FeS2 transistor, it is still low for further application in electronics area. In order to reveal the problem that cause the low Ion/Ioff ratio, we studied the electrical transport mechanisms of the FeS2 thin film using a temperature-dependent four probe electrical measurement. Fig. 9a shows the IdsVds curves at different temperatures. The resistance of the active channel increased as the temperature decreased. The conductivity was calculated using the parameters of the FeS2 device. Fig. 9b is plotted as ln(σ) versus T1/4, and we obtained a linear relationship for low temperature. This finding indicates that the conductivity follows the Mott VRH mechanism:47

image file: c5ra23344e-t1.tif
where σ0 is the prefactor and T0 is the Mott VRH temperature.48 This mechanism indicates that the electron is hopping among localized states in the disordered system.49,50 In the FeS2 thin film, the disorder is attributed to the random distribution of defects and impurities that results in the localization of charge carriers.48,51 As we discussed in the XPS section, the FeS2 thin film is a defect-rich system. Combined with the FET transport behaviour, these results suggest that the electrical transport is primarily influenced by localized defects in the crystalline FeS2 thin film.


image file: c5ra23344e-f9.tif
Fig. 9 Temperature dependence of the FeS2 samples.

Conclusion

We demonstrated a successful method for synthesizing an ultrathin FeS2 thin film via thermal sulfidation of an iron thin film. The phase of the FeS2 thin film was confirmed using TFXRD and Raman spectroscopy. Although a small amount of marcasite is present, the FeS2 thin film obtained using 240 min of sulfidation exhibits the best electrical properties, including resistivity, mobility and carrier concentration, for FET applications. Given the quality of the FeS2 thin film, we fabricated a FET device with an Ion/Ioff ratio of approximately 4 × 10⁴. Although the device is relatively difficult to control with the gate voltage, the potential for the use of FeS2 in FET applications was demonstrated. The electron transport mechanism was also studied using temperature-dependent electrical transport measurements. The methodology used to generate the thin film and FET device provides a versatile platform to further improve the quality of FeS2 thin films as promising candidates in FET materials.

We found that our polycrystalline film has many surface defects and grain boundaries, which sharply reduce the material's quality and device performance. These are also an issue for FeS2 photovoltaic solar cells. A high density surface state will cause high recombination, which limits the conversion efficiency. The low mobility of the FET device is the main challenge limiting the utility of FeS2. To enhance the mobility of the device, we believe that a high k-dielectric gate layer and an effective passivation layer are the solution.34,45 High k-dielectric materials reduce the gate layer thickness and increase the control ability of the gate voltage, whereas the passivation layer can reduce the surface defect states. Both methods could further enhance the channel modulation capability of FeS2 devices.

Acknowledgements

This work was supported by “Pearl River Talent Plan” 5th Innovation Team of Guangdong Province (Grant No. 2014ZT05D340), Special Project of Applicable Science and Technology of Guangdong Province (Grant No. 2015B010129010). The authors would also like to thank Mr Guijun Li, Mr Meng Zhang and staff in PSKL. The authors also would like to thank Prof. Kei May Lau, Mr Wilson Tang, and staff in Photonic Technology Center (PTC), Nanoelectronic Fabrication Facility (NFF), and Material Characterization & Preparation Facility (MCPF).

References

  1. F. Alharbi, J. D. Bass, A. Salhi, A. Alyamani, H. C. Kim and R. D. Miller, Renewable Energy, 2011, 36, 2753–2758 CrossRef CAS.
  2. J. Oertel, K. Ellmer, W. Bohne, J. Ro and H. Tributsch, J. Cryst. Growth, 1999, 199, 1205–1210 CrossRef.
  3. G. Willeke, R. Dasbach, B. Sailer and E. Bucher, Thin Solid Films, 1992, 213, 271–276 CrossRef CAS.
  4. L. Meng and M. S. Liu, Mater. Sci. Eng., B, 1999, 60, 168–172 CrossRef.
  5. W. Dong and C. Zhu, J. Mater. Chem., 2002, 12, 1676–1683 RSC.
  6. D. G. Moon, A. Cho, J. H. Park, S. Ahn, H. Kwon, Y. S. Cho and S. Ahn, J. Mater. Chem. A, 2014, 2, 17779–17786 CAS.
  7. X. Shi, A. Tian, X. Xue, H. Yang and Q. Xu, Mater. Lett., 2015, 141, 104–106 CrossRef CAS.
  8. A. Ennaoui and H. Tributsch, Sol. Energy Mater., 1986, 14, 461–474 CrossRef CAS.
  9. M. Cabán-Acevedo, D. Liang, K. S. Chew, J. P. Degrave, N. S. Kaiser and S. Jin, ACS Nano, 2013, 7, 1731–1739 CrossRef PubMed.
  10. Y. Bi, Y. Yuan, C. L. Exstrom, S. A. Darveau and J. Huang, Nano Lett., 2011, 11, 4953–4957 CrossRef CAS PubMed.
  11. A. Ennaoui, S. Fiechter, C. Pettenkofer, N. Alonso-Vante, K. Büker, M. Bronold, C. Höpfner and H. Tributsch, Sol. Energy Mater. Sol. Cells, 1993, 29, 289–370 CrossRef CAS.
  12. K. J. Andersson, H. Ogasawara, D. Nordlund, G. E. Brown and A. Nilsson, J. Phys. Chem. C, 2014, 118, 21896–21903 CAS.
  13. M. Cabán-Acevedo, N. S. Kaiser, C. R. English, D. Liang, B. J. Thompson, H.-E. Chen, K. J. Czech, J. C. Wright, R. J. Hamers and S. Jin, J. Am. Chem. Soc., 2014, 136, 17163–17179 CrossRef PubMed.
  14. X. Zhang, M. Manno, A. Baruth, M. Johnson, E. S. Aydil and C. Leighton, ACS Nano, 2013, 7, 2781–2789 CrossRef CAS PubMed.
  15. C.-H. Liu, C.-H. Chen, S.-Y. Chen, Y.-T. Yen, W.-C. Kuo, Y.-K. Liao, J.-Y. Juang, H.-C. Kuo, C.-H. Lai, L.-J. Chen and Y.-L. Chueh, Nano Lett., 2011, 11, 4443–4448 CrossRef CAS PubMed.
  16. Y.-C. Wang, H.-Y. Cheng, Y.-T. Yen, T.-T. Wu, C.-H. Hsu, H.-W. Tsai, C.-H. Shen, J.-M. Shieh and Y.-L. Chueh, ACS Nano, 2015, 9, 3907–3916 CrossRef CAS PubMed.
  17. D.-Y. Wang, M. Gong, H.-L. Chou, C.-J. Pan, H.-A. Chen, Y. Wu, M.-C. Lin, M. Guan, J. Yang, C.-W. Chen, Y.-L. Wang, B.-J. Hwang, C.-C. Chen and H. Dai, J. Am. Chem. Soc., 2015, 137, 1587–1592 CrossRef CAS PubMed.
  18. N. Berry, M. Cheng, C. L. Perkins, M. Limpinsel, J. C. Hemminger and M. Law, Adv. Energy Mater., 2012, 2, 1124–1135 CrossRef CAS.
  19. J. Hu, Y. Zhang, M. Law and R. Wu, Phys. Rev. B: Condens. Matter Mater. Phys., 2012, 85, 1–10 Search PubMed.
  20. R. Morrish, R. Silverstein and C. A Wolden, J. Am. Chem. Soc., 2012, 134, 17854–17857 CrossRef CAS PubMed.
  21. M. Bronold, S. Kubala, C. Pettenkofer and W. Jaegermann, Thin Solid Films, 1997, 304, 178–182 CrossRef CAS.
  22. H. Liu and D. Chi, J. Vac. Sci. Technol., A, 2012, 30, 04D102 Search PubMed.
  23. L. Huang, F. Wang, Z. Luan and L. Meng, Mater. Lett., 2010, 64, 2612–2615 CrossRef CAS.
  24. Y. Z. Dong, Y. F. Zheng, H. Duan, Y. F. Sun and Y. H. Chen, Mater. Lett., 2005, 59, 2398–2402 CrossRef CAS.
  25. S. Shukla, N. H. Loc, P. P. Boix, T. M. Koh, R. R. Prabhakar, H. K. Mulmudi, J. Zhang, S. Chen, C. F. Ng, C. H. A. Huan, N. Mathews, T. Sritharan and Q. Xiong, ACS Nano, 2014, 8, 10597–10605 CrossRef CAS PubMed.
  26. L. Li, M. Cabán-Acevedo, S. N. Girard and S. Jin, Nanoscale, 2014, 6, 2112–2118 RSC.
  27. M. Gong, A. Kirkeminde, Y. Xie, R. Lu, J. Liu, J. Z. Wu and S. Ren, Adv. Opt. Mater., 2013, 1, 78–83 CrossRef.
  28. G. Srivastava, C. K. Das, A. Das, S. K. Singh, M. Roy, H. Kim, N. Sethy, A. Kumar, R. K. Sharma, S. K. Singh, D. Philip and M. Das, RSC Adv., 2014, 4, 58495–58504 RSC.
  29. F. A. Rasmussen and K. S. Thygesen, J. Phys. Chem. C, 2015, 150430115624006 Search PubMed.
  30. M. Cabán-Acevedo, M. S. Faber, Y. Tan, R. J. Hamers and S. Jin, Nano Lett., 2012, 12, 1977–1982 CrossRef PubMed.
  31. M. Limpinsel, N. Farhi, N. Berry, J. Lindemuth, C. L. Perkins, Q. Lin and M. Law, Energy Environ. Sci., 2014, 7, 1974 CAS.
  32. Y. H. Liu, L. Meng and L. Zhang, Thin Solid Films, 2005, 479, 83–88 CrossRef CAS.
  33. K. Sun, Z. Su, J. Yang, Z. Han, F. Liu, Y. Lai, J. Li and Y. Liu, Thin Solid Films, 2013, 542, 123–128 CrossRef CAS.
  34. D. Liang, M. Cabán-Acevedo, N. S. Kaiser and S. Jin, Nano Lett., 2014, 14, 6754–6760 CrossRef CAS PubMed.
  35. F. Withers, O. Del Pozo-Zamudio, A. Mishchenko, A. P. Rooney, A. Gholinia, K. Watanabe, T. Taniguchi, S. J. Haigh, A. K. Geim, A. I. Tartakovskii and K. S. Novoselov, Nat. Mater., 2015, 14, 301–306 CrossRef CAS PubMed.
  36. S. Fiechter, M. Birkholz, A. Hartmann, P. Dulski, M. Giersig, H. Tributsch and R. J. D. Tilley, J. Mater. Res., 1992, 7, 1829–1838 CrossRef CAS.
  37. C. de las Heras, J. L. M. de Vidales, I. J. Ferrer and C. Sánchez, J. Mater. Res., 2011, 11, 211–220 CrossRef.
  38. X. Qiu, M. Liu, T. Hayashi, M. Miyauchi and K. Hashimoto, Chem. Commun., 2013, 49, 1232–1234 RSC.
  39. H. Vogt, T. Chattopadhyay and H. J. Stolz, J. Phys. Chem. Solids, 1983, 44, 869–873 CrossRef CAS.
  40. A. K. Kleppe and A. P. Jephcoat, Mineral. Mag., 2004, 68, 433–441 CrossRef CAS.
  41. M. Bronold, Y. Tomm and W. Jaegermann, Surf. Sci., 1994, 314, L931–L936 CrossRef CAS.
  42. F. W. Herbert, A. Krishnamoorthy, W. Ma, K. J. van Vliet and B. Yildiz, Electrochim. Acta, 2014, 127, 416–426 CrossRef CAS.
  43. J. Xu, H. Xue, X. Yang, H. Wei, W. Li, Z. Li, W. Zhang and C.-S. Lee, Small, 2014, 1–6 Search PubMed.
  44. J. P. Degrave, D. Liang and S. Jin, Nano Lett., 2013, 13, 2704–2709 CrossRef CAS PubMed.
  45. B. Radisavljevic, A. Radenovic, J. Brivio, V. Giacometti and A. Kis, Nat. Nanotechnol., 2011, 6, 147–150 CrossRef CAS PubMed.
  46. R. J. Soukup, P. Prabukanthan, N. J. Ianno, A. Sarkar, C. A. Kamler and D. G. Sekora, J. Vac. Sci. Technol., A, 2011, 29, 011001 Search PubMed.
  47. C. Lu, Q. Fu, S. Huang and J. Liu, Nano Lett., 2004, 4, 623–627 CrossRef CAS.
  48. N. F. Mott, Mott-Insulator Transition, Taylor-Francis, London, 1990 Search PubMed.
  49. D. Lichtenberger, K. Ellmer, R. Schieck, S. Fiechter and H. Tributsch, Thin Solid Films, 1994, 246, 6–12 CrossRef CAS.
  50. K. Ellmer, D. Lichtenberger, A. Ennaoui, C. Hopfner, S. Fiechter and H. Tributsch, in Conference Record of the Twenty Third IEEE Photovoltaic Specialists Conference - 1993 (Cat. No.93CH3283-9), IEEE, 1993, pp. 535–538 Search PubMed.
  51. A. L. Shklovskii and B. I. Efros, Electronic Properties of Doped Semiconductors, Springer-Verlag, Berlin, 1984 Search PubMed.

Footnote

Electronic supplementary information (ESI) available: The FeS2 FET device parameter calculations and structure characterization and optical properties of FeS2 thin film on quartz substrate are provided in the ESI. See DOI: 10.1039/c5ra23344e

This journal is © The Royal Society of Chemistry 2016