DOI:
10.1039/C5RA23187F
(Paper)
RSC Adv., 2016,
6, 23942-23948
Catalytic hydrogenation of 2-ethylanthraquinone using an in situ synthesized Pd catalyst
Received
4th November 2015
, Accepted 22nd February 2016
First published on 24th February 2016
Abstract
An in situ synthesized Pd catalyst with an egg–shell structure was employed to catalyze the hydrogenation of 2-ethylanthraquinone in a fixed bed. The effects of residence time, gas to liquid phase ratio, reaction temperature and Pd loading amounts on the yield and hydrogenation efficiency were investigated specifically. The yield and hydrogenation efficiency attained values of 35.5% and 6.6 g L−1 using the optimum Pd loading amount of 0.32%, respectively, with a residence time of less than 4 seconds and exhibiting excellent catalytic activity. Meanwhile, within the temperature range of 50 °C to 70 °C, the Thiele modulus and effective internal diffusion factors were calculated to be about 0.008 to 0.033 and 0.9996 to 0.9999, respectively, which indicates that the prepared catalyst with an egg–shell structure weakened the internal diffusion resistance effectively and is suitable for fast reactions. The maximum space time yield value reached 567.5 gH2O2 gPd−1 h−1 and was much higher than the reported results from other literature.
Introduction
Hydrogen peroxide, an ideal environmentally friendly and widely used chemical agent,1–3 has been primarily produced through the commercial anthraquinone route and the involved chemical reactions are listed in Scheme 1. Notably, the most paramount reaction step is the hydrogenation of active quinones (2-ethylanthraquinone or tetrahydro-2-ethylanthraquinone) using a Pd catalyst, which has received extensive attention in the catalytic field.4–6
 |
| | Scheme 1 Involved chemical reactions through anthraquinone route. | |
For instance, E. Santacesaria et al.7–9 studied the kinetics and mass transfer aspects of the hydrogenation stage in a conventional slurry reactor with supported Pd catalyst. It was found that the hydrogenation in the presence of palladium catalyst is a very fast reaction limited by mass transfer resistance. The reaction rate was given by eqn (1):
where
kH is reaction rate constant and
η is overall effectiveness factor, ranging from 0.02 to 0.15 suggesting that only a thin shell of the catalyst particles is normally involved in the hydrogenation process.
Therefore, supported Pd catalyst, especially with egg–shell type, was normally employed in the hydrogenation of 2-ethylanthraquinone to reduce diffusion resistance considering its nature of fast reaction.10–13 However, general commercial supported Pd catalysts which normally have alumina or porous carbon as their supports are unreal egg–shell type catalysts in their true sense. Active Pd components are introduced onto the outer surface of the supports, but the reagents and products could continue to penetrate into the inner parts of the supports resulting in longer molecular diffusion time.
In our previous work,13 a novel Pd catalyst with an egg–shell structure supported on glass beads was prepared through the combination of the subcritical water treatment, ion-exchange process and reduction methods. The catalyst with solid inner parts could prohibit the excessive diffusion of molecules. It showed potential excellent catalytic performance in the hydrogenation of 2-ethylanthraquinone but with the drawback of intricate preparation method. Then, the preparation procedure was improved and a corresponding new room temperature facile in situ method14 was reported.
However, it should be pointed out that the systematic and intensive examination on the hydrogenation of 2-ethylanthraquinone using this kind of Pd/glass beads catalyst was lacking and, to our best knowledge, has never been discussed before. Most importantly, the surface Na2SiO3 and MgSiO3 on porous glass beads support result in the alkalinity of the catalyst, which seems to be in favor of the hydrogenation of 2-ethylanthraquinone. In the study of Drelinkiewicz and coworkers,15 a silica carrier was found to benefit the main hydrogenation reactions, whereas alumina do not. In addition, alumina support pre-impregnated with alkaline solutions such as Na2SiO3 presented more promise catalytic performance than single alumina support in which hydrogenolytic side reactions dominated.
Furthermore, the Thiele modulus and effective internal diffusion factors16–19 are introduced for the reaction system of hydrogenation of 2-ethylanthraquinone in this work to quantify the internal mass transfer resistance eventually with a goal to prove the superiority of catalyst with egg–shell type. Similarly, Zhang et al.20 studied the influence of internal diffusion limitation on transesterification of (S)-α-cyano-3-phenoxybenzyl (CPB) alcohol with vinylacetate catalyzed by immobilized lipase and the internal diffusion effectiveness factor value (0.55) was finally obtained to express the effect of internal diffusion limitation quantitatively indicating non-negligible mass transfer limitation.
Accordingly, it is reasonable and useful to study the catalytic performance on hydrogenation of 2-ethylanthraquinone using the catalyst of Pd/glass-beads in detail, especially considering the insightful internal diffusion limitation issues. In this paper, the catalyst was synthesized through the new in situ procedure considering its easy facility. Scanning electron microscopy (SEM) and transmission electron microscopy (TEM) analyses were employed to characterize the surface morphology of as prepared Pd catalyst. The catalytic activity of prepared catalysts on the hydrogenation of 2-ethylanthraquinoe was tested in a fixed bed considering the influence of residence time, gas to liquid phase ratio, reaction temperature and Pd loading amounts on the yield and hydrogenation efficiency. Four experiments were designed to determine apparent first order rate constants under a series of reaction temperatures as well as the Thiele modulus and effective internal diffusion factors. The activation energy value is also presented.
Experimental
Materials and chemicals
The anthraquinone working solution (130 ± 5 g L−1) was supplied by Sinopec Group and consisted of a polar solvent (trioctyl phosphate) and a non-polar solvent (1,3,5-trimethylbenzene) with volume ratio of 1![[thin space (1/6-em)]](https://www.rsc.org/images/entities/char_2009.gif) :3. Porous glass beads with diameters of 100 μm, composed of 59.7 wt% SiO2, 9.8 wt% MgO, 25.1 wt% Na2O, and 4.9 wt% CaO, were purchased from Hebei Chiye Corporation. KMnO4, H2SO4 and PdCl2 were all analytical grade reagents, and were purchased from Beijing Chemical Plant. High purity (99.999%) nitrogen and hydrogen gases were purchased from Beijing Hua Yuan Gas Chemical Industry.
:3. Porous glass beads with diameters of 100 μm, composed of 59.7 wt% SiO2, 9.8 wt% MgO, 25.1 wt% Na2O, and 4.9 wt% CaO, were purchased from Hebei Chiye Corporation. KMnO4, H2SO4 and PdCl2 were all analytical grade reagents, and were purchased from Beijing Chemical Plant. High purity (99.999%) nitrogen and hydrogen gases were purchased from Beijing Hua Yuan Gas Chemical Industry.
Preparation and characterization of porous glass beads supported with Pd nanoparticles
The catalyst was prepared according to our previous methods.13 First, 5.0 g glass beads and 200 mL deionized water were put together into a tank reactor. The reactor was then gradually heated to 573 K with pressure of 8.3 MPa and kept for 1 hour. Afterwards, the glass beads were separated by filtration and washed with deionized water. Then, the mixture of 1.0 g treated glass beads and 120 g palladium chloride–ethanol solution with a concentration of 100 ppm were shaken together for 12 h at 160 rpm and 298 K in a temperature-controlled shaker. The catalyst with different Pd loading amounts could be obtained through the change of initial concentration of palladium chloride–ethanol solutions.
The surface morphology and egg–shell structure of prepared catalysts were investigated using a scanning electron microscopy (SEM, JEOL JSM 7401F, JEOL Ltd., Japan). The supported Pd nanoparticles on porous glass beads were investigated using a transmission electron microscope (TEM, EOL JSM 2010, JEOL Ltd, Japan). The loading amount of Pd elements was evaluated by measuring the concentration change of PdCl2–ethanol solutions before and after ion-exchange process using an atomic absorption spectrophotometer (AAS, Z5000, Hitachi).
Analytical methods
The hydrogenation of 2-ethylanthraquinone using the prepared catalyst was conducted in a fixed bed. The fixed tubular reactor filled with 1.2 g prepared catalyst, with length of 10 cm and inner diameter of 4 mm, was immersed in water bath to keep the reaction temperature constant. Net wires on both sides of the reactor were presented to prevent the catalyst from being washed away. The reaction pressure was adjusted with a back pressure valve at the end of system.
Then, volume of 15 mL reaction products were placed into a water-bath cup with a constant temperature of 45 °C and were completely oxidized using compressed air gas at 0.2 MPa. The oxidization extent could be determined through the color of the hydrogenated working solution. About 25 minutes elapsed after the working solution color totally changed from red to bright yellow, indicating that the oxidization was complete. After that, 15 wt% sulfuric acid solution was added into the above oxidized working solution to extract the generated hydrogen peroxide.21 The amount of hydrogen peroxide was calculated through titration with standard KMnO4 solutions. To characterize the reaction, the yield (y), hydrogenation efficiency (H) and space time yield (STY) in this paper were defined using eqn (2)–(4), respectively.
| |
 | (2) |
| |
 | (3) |
| |
 | (4) |
Results and discussion
Characteristics of porous glass beads supported with Pd nanoparticles
Fig. 1(a) and (b) show the color changes of glass bead support before and after Pd loading. Notably, the egg–shell structure of prepared Pd catalyst can be clearly observed in the Fig. 1(c). In addition, Fig. 1(d) shows the high resolution TEM images of the supported Pd. The average diameter of the Pd nanoparticles was approximately 4 nm to 5 nm with a lattice fringe width of 0.224 nm. Also, electron diffraction showed that the polycrystalline nature of prepared Pd particles.
 |
| | Fig. 1 Changes in colors of (a) glass bead support (b) glass bead after Pd loading (c) SEM images of prepared Pd catalyst with egg–shell structure (d) high-resolution TEM images of Pd nanoparticles with (e) electron diffraction pattern. | |
Effect of residence time on the yield and hydrogenation efficiency
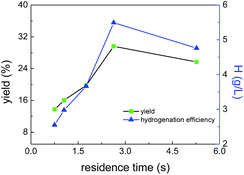
Fig. 2 shows the effect of residence time on the yield and hydrogenation efficiency. The experiment was conducted while varying the liquid flow rates ranging from 0.1 mL min−1 to 0.7 mL min−1 but with a fixed hydrogen gas to liquid phase ratio of 30 used in all experiments. It was found that the yield and hydrogenation efficiency both increased to a peak value then decreased with increasing residence time. The yield and hydrogenation efficiency reached to the maximum values of 29.6% and 5.5 g L−1, respectively, at a residence time of 2.6 seconds.
 |
| | Fig. 2 Effect of residence time on yield and hydrogenation efficiency (reaction temperature 70 °C, reactor outlet absolute pressure 0.35 MPa, gas to liquid ratio 30). | |
Under experimental conditions, with increasing residence time, the contact time between the two mixing flow phases and catalysts increases, resulting in an increased yield and hydrogenation efficiency. However, the increase in the residence time also means a slower liquid flow rate, which, in turn leads to a lower gas–liquid mass transfer area as well as a thicker mass transfer boundary layer around the hydrogen gas bubble. Therefore, the mass transfer resistance of hydrogen gas penetrating into the catalyst surface through liquid film is enhanced; the yield and hydrogen efficiency were decreased too.
Effect of Pd loading amounts on yield and hydrogenation efficiency
Fig. 3 shows the effect of different Pd loading amounts on yield and hydrogenation efficiency. The experimental condition was fixed at reaction temperature 75 °C, liquid flow rate 0.2 mL min−1 and gas to liquid ratio 20. As shown in Fig. 4, the yield and hydrogenation efficiency at first increased and then decreased with the increasing Pd loading amounts. The maximum yield and hydrogenation efficiency reached to 35.5% and 6.6 g L−1, respectively, with a Pd loading amount of 0.32 wt%. The relative decrease in yield and hydrogenation when Pd loading amounts were much higher than 0.32 wt% is theorized to be due to the increase in diameter of Pd nanoparticles, which indicates that the use of Pd particles were lower. Meanwhile, the larger Pd particles are, the worse particle dispersion might be, resulting into poor yields.
 |
| | Fig. 3 Effect of Pd loading amounts on yield and hydrogenation efficiency (reaction temperature 75 °C, reactor absolute pressure 0.35 MPa, liquid flow rate 0.2 mL min−1, gas to liquid ratio 20). | |
 |
| | Fig. 4 TEM images of different Pd loading amounts and corresponding mean size distribution: (a) 0.17 wt% (b) 0.32 wt% (c) 0.61 wt% (d) 0.81 wt%. | |
Fig. 4 shows the TEM images of different Pd loading amounts and corresponding particle size distribution. The mean Pd particle diameters for catalysts with different Pd loading amounts were quantified based on a statistical number-weighted method by surveying more than 150 particles. Accordingly, the average Pd diameters with the loading amount of 0.17 wt%, 0.32 wt%, 0.61 wt% and 0.81 wt% were determined to be 3.75 ± 0.19 nm, 3.93 ± 0.21 nm, 4.92 ± 0.16 nm and 6.37 ± 0.23 nm, respectively. The result shows that the Pd average particle size increases slightly with the increase of Pd loading amounts. Furthermore, Fig. 4(b) has much well-dispersed Pd nanoparticles while Fig. 4(d) has the worst accounting for the corresponding lower yields and hydrogenation efficiency.
Effect of gas to liquid phase ratio on the yield and hydrogenation efficiency
The effect of gas to liquid flow phase ratio on the yield and hydrogenation efficiency is shown in Fig. 5. The experiment was conducted under a fixed liquid flow rate of 0.2 mL min−1 and varied hydrogen gas flow rates from 2 mL min−1 to 8 mL min−1. The results show that the yield improved by 34% between flow rates of 2 mL min−1 to 4 mL min−1. A similar behavior to that of residence time as observed in the previous experiment is also noticed in the altering of the gas to liquid phase ratio. This results in an increase in yield and hydrogenation efficiency, whereby first increasing then decreasing with increasing gas flow rate, however the magnitude of these changes is seen to be much smaller.
 |
| | Fig. 5 Effect of phase ratio of gas to liquid on yield and hydrogenation efficiency (reaction temperature 70 °C, reactor outlet absolute pressure 0.35 MPa, liquid flow rate 0.2 mL min−1). | |
With increasing gas flow rate, the mixing of both gas and liquid flow was enhanced, which resulted in an increase of the yield as well as hydrogenation efficiency. Nevertheless, when the hydrogen flow rate exceeded 4 mL min−1 under experiment conditions, the two mixing phases flowed too quickly to contact sufficiently with the catalyst. This decreased contact time lead to the decrease of the yield and hydrogenation efficiency. Notably, there was adequate hydrogen gas present for the hydrogenation reaction, which accounts for the observation of a slight decrease in reaction with a large growth in the gas to liquid ratio.
Effect of reaction temperature on the yield and hydrogenation efficiency
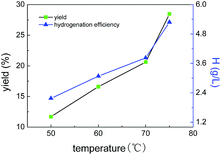
Fig. 6 shows the effects of reaction temperature on the yield and hydrogenation efficiency. The liquid flow rate and gas to liquid phase ratio were fixed at 0.3 mL min−1 and 30 respectively. The results show that the yield and hydrogen efficiency both increased largely and improved by 1.4 times with the increasing reaction temperature from 50 °C to 75 °C, indicating that the reaction temperature has an significant influence on the hydrogenation of 2-ethylanthraquinone. This is mainly due to the reaction rate constant will also increase with increasing reaction temperature, causing an increase in the yield and hydrogenation efficiency.
 |
| | Fig. 6 Effect of reaction temperature on yield and hydrogenation efficiency (reactor outlet absolute pressure 0.35 MPa, liquid flow rate 0.3 mL min−1, gas to liquid ratio 30). | |
To further investigate the effects of reaction temperatures on the intrinsic kinetics of hydrogenated 2-ethylanthraquinone reactions, four comparison experiments were conducted under condition of high liquid flow speeds to prevent interference from external diffusion with the optimum Pd loading amount.
The outlet pressure and gas to liquid phase ratio were fixed at 0.35 MPa and 20, respectively. The reaction temperature was varied for these experiments. Fig. 7 shows the plot of ln(1/(1 − y)) versus residence time. Interestingly, a linear relationship was observed between the reaction yield and residence time. The corresponding R2 values of each fitting line at different temperatures were 0.9944, 0.999, 0.9939 and 0.9986 with slopes of 0.0028, 0.0139, 0.0275 and 0.0668, respectively.
 |
| | Fig. 7 Plot of ln(1/(1 − y)) versus residence time. | |
Santacesaria et al.7 found that the reaction approximately follows first order kinetics with respect to EAQ concentration and zero order kinetics with respect to hydrogen in the presence of supported Pd catalyst in a slurry semibatch reactor, as said before. With regard to our experimental fixed bed, a similar conclusion could also be drawn from the favorable linearity of the plot ln(1/(1 − y)) versus liquid residence time shown in Fig. 7. Apparently, this kind of linear relationship would only appear in a first-order or pseudo-first-order dynamic reaction. Moreover, considering the two high phase flow rates and egg–shell structure of the Pd catalyst, eqn (1) could be simplified as
Based on the integrated formula of Arrhenius equation shown in eqn (6) below, the activation energy was calculated to be 140 kJ mol−1. The linear plot of lnk versus 1/T is shown in Fig. 8 with a R2 value of 0.9981.
| |
 | (6) |
 |
| | Fig. 8 Plot of lnk versus 1/T. | |
Effect of internal mass transfer resistance on yield and hydrogenation efficiency
To gain a deeper insight into the influence of internal mass transfer resistance on macroscopic dynamics, the Thiele modulus (ϕ) and effective internal diffusion factors (ξ) were determined under different reaction temperatures. Considering the obtained apparent reaction rate constants below, the Weisz modulus (ϕa) was introduced to deduce the value of Thiele modulus by using the eqn (7).22 Notably, for the first-order reaction in the isothermal egg–shell structure catalyst, the Weisz modulus and effective internal diffusion factor can be calculated by eqn (8) and (9), respectively.16,23| |
 | (8) |
| | |
ξ = tanhϕ/ϕ
| (9) |
where L is the thickness of shell part of catalyst; De,H2 is the effective diffusion constant of hydrogen and defined as:| |
 | (10) |
where θ is the porosity (0.32 for glass beads used in our experiment), δ is the tortuosity factor, associated with pore structure of catalyst (4.5 for our prepared catalyst), and DH2 is the diffusion constant of hydrogen.7,24
Table 1 shows the calculated Thiele modulus and effective internal diffusion factors under different temperatures. Thiele modulus and effective internal diffusion factors were determined to be 0.008 to 0.033 and 0.9996 to 0.9999, respectively, under the reaction temperature range of 50 °C to 70 °C. This indicates that the prepared egg–shell structure catalysts, with highly dispersed active Pd on the surface of porous glass beads support, weaken the internal diffusion resistance effectively and have potential applications for mass transfer dominated reactions.
Table 1 The Thiele modulus and effective internal diffusion factors under different temperatures
| Parameter |
Values |
| T |
323 |
328 |
333 |
338 |
343 |
| k |
0.0028 |
0.0062 |
0.0138 |
0.0298 |
0.0630 |
| De,H2 |
6.766 × 10⁻⁶ |
7.27 × 10⁻⁶ |
7.792 × 10⁻⁶ |
8.34 × 10⁻⁶ |
8.90 × 10⁻⁶ |
| ϕ |
0.0081 |
0.0117 |
0.0168 |
0.0239 |
0.0336 |
| ξ |
0.99997 |
0.99995 |
0.99991 |
0.99981 |
0.99962 |
Stability of the in situ synthesized Pd catalyst
A series of runs have been performed to study the stability of the prepared Pd catalyst in the hydrogenation of 2-ethylanthraquinone, as shown in Fig. 9. The experimental condition was fixed at reaction temperature 70 °C, reactor outlet absolute pressure 0.35 MPa, liquid flow rate 0.2 mL min−1 and gas to liquid ratio 30. The reaction was conducted for six successive runs with each lasting 4 h. The results show that a little amount of decreasing on the yield and hydrogenation efficiency were observed after six runs compared with that of fresh catalyst. It may be due to the increase of Pd nanoparticles size after six successive reactions, which changed from ca. 3.91 nm to ca. 4.21 nm as shown in Fig. 10. In addition, the catalyst may be slightly poisoned by the reactants or products causing the deactivation. However, it should be pointed out that the hydrogenation efficiency just dropped by ca. 1.9% after six runs and this in situ prepared Pd catalyst still presents favorable chemical stability and potential feasibility in practical applications.
 |
| | Fig. 9 Effect of run times on yield and hydrogenation efficiency (reaction temperature 70 °C, reactor outlet absolute pressure 0.35 MPa, liquid flow rate 0.2 mL min−1, gas to liquid ratio 30). | |
 |
| | Fig. 10 TEM images of Pd catalyst (a) fresh and (b) after six-run reaction. | |
Comparison of STY results with other literature
Under the abovementioned experimental conditions and analyses, the most profitable reactor productivity for our system with STY values of 567.5 gH2O2 gPd−1 h−1 was achieved. This result was obtained with a liquid flow rate 0.2 mL min−1, reaction temperature and pressure of 75 °C and 0.35 MPa, respectively, and gas to liquid phase ratio of 30. Other experimental STY results from the literature are also presented here, as shown in Table 2. Drelinkiewicz et al.25 conducted the reaction in a fixed-bed reactor with a volume of 25 cm2 filled with 19 g of supported Pd catalyst (2% loading amount). The gained amount of hydrogen peroxide after 1 hour of circulation was 0.282 mol corresponding STY of 25 gH2O2 gPd−1 h−1 at a reaction temperature 50 °C and pressure of 5 bars. Albers et al.26 used Pd/alumina with diameter of 2 mm as catalyst to hydrogenate anthraquinone in a fixed-bed at a reaction temperature of 55 °C and pressure of 200 kPa and obtained a STY of 105 gH2O2 gPd−1 h−1. Therefore, the STY of this study is 23 times and 5 times those of the two abovementioned studies. Moreover, even at a reaction temperature of 50 °C, STY results in our study still reached 156.2 gH2O2 gPd−1 h−1.
Table 2 Comparison of space time yield (STY) results with other literature
| Catalyst |
Reaction temperature and pressure |
STY, gH2O2 gPd−1 h−1 |
| 2 wt% Pd/Al2O325 |
50 °C, 5 bars |
25 |
| 0.3 wt% Pd/Al2O326 |
55 °C, 200 kPa |
105 |
| 0.32 wt% Pd/glass bead |
50 °C, 0.35 MPa |
156.2 |
| 0.32 wt% Pd/glass bead |
75 °C, 0.35 MPa |
567.5 |
As mentioned before, small size Pd catalysts with egg–shell structure play an important role in improving the catalytic performance in the hydrogenation of 2-ethylanthraquinone, which is a fast reaction and dominated by mass transfer resistance. The prepared catalyst with diameter of 100 μm and shell thickness of 3 μm to 4 μm is a true egg–shell type and has small mono-dispersed Pd nanoparticles of 4 nm to 5 nm on its surface. Thus the prepared egg–shell structure catalysts reduces the internal diffusion resistance greatly, which is proved by the determined results of Thiele modulus and effective internal diffusion factors, and leads to much higher STY results. Further study of the catalytic performance should be conducted in the future, such as the effect of varying thickness of shell parts on the yields and hydrogenation efficiency.
Conclusion
In this work, an in situ prepared catalyst with an egg–shell structure was synthesized according to our previous work and was employed in the hydrogenation of 2-ethylanthraquinone. With the purpose of examining its catalytic performance, the effect of residence time, gas to liquid phase ratio reaction temperature and different Pd loading amounts were taken into account. Under the optimized conditions, the resulting STY was as high as 567.5 gH2O2 gPd−1 h−1 with a liquid flow rate 0.2 mL min−1, reaction temperature and pressure of 75 °C and 0.35 MPa, respectively, and gas to liquid phase ratio of 30. In addition, a linear relationship was observed between ln(1/(1 − y)) and residence time. This phenomenon could be explained by the intrinsic kinetics of the reaction, which was first-order with respect to EAQ concentration and zero-order with respect to hydrogen gas. In addition, four experiments were designed to determine the effective internal diffusion factors of the catalyst at temperatures ranging from 50 °C to 70 °C. The calculated data shows that this prepared catalyst lowered the internal mass transfer resistance and is suitable for fast reactions.
Nomenclature
| De,H2 [cm2 s−1] | Effective diffusion constant of hydrogen |
| DH2 [cm2 s−1] | Diffusion constant of hydrogen |
| E [kJ mol−1] | Activation energy |
| gH2O2 [g] | Actual mass of hydrogen peroxide |
| gt,H2O2 [g] | Theoretical mass of hydrogen peroxide |
| H [g L−1] | Hydrogenation efficiency |
| k [s−1] | Apparent first order rate constant |
| k0 [s−1] | Pre-exponential factor |
| L [μm] | Thickness of shell part of the catalyst |
| mpd [g] | Mass of loading Pd |
| STY [gH2O2 gPd−1 h−1] | Space time yield |
| T [K] | Absolute temperature |
| tc [°C] | Centigrade temperature |
| t [s] | Residence time |
| Vq [mL] | Volume of working solution |
| vH2 [mL min−1] | Flow rate of hydrogen |
| xPd [%] | Percentage of Pd loading amounts |
| y [%] | Yield |
| θ | Porosity, 0.32 |
| δ | Tortuosity factor, 4.5 |
| ϕ | Thiele modulus |
| ϕa | Weisz modulus |
| ξ | Effective internal diffusion factor |
Acknowledgements
We gratefully acknowledge the support of the National Basic Research Program of China (2013CB733600) and the National Natural Science Foundation of China (21276140, 20976069 and 21036002).
References
- J. M. Campos-Martin, G. Blanco-Brieva and J. L. G. Fierro, Angew. Chem., Int. Ed., 2006, 45, 6962–6984 CrossRef CAS PubMed.
- S. Chen, R. Yuan, Y. Chai and F. Hu, Microchim. Acta, 2013, 180, 15–32 CrossRef CAS.
- E. Ramos, S. F. Calatrava and L. Jimenez, Afinidad, 2008, 65, 366–373 CAS.
- T. Berglin and N. H. Schoon, Ind. Eng. Chem. Process Des. Dev., 1981, 20, 615–621 CAS.
- R. Kosydar, A. Drelinkiewicz and J. P. Ganhy, Catal. Lett., 2010, 139, 105–113 CrossRef CAS.
- A. Drelinkiewicz and A. Waksmundzka-Gora, J. Mol. Catal. A: Chem., 2006, 246, 167–175 CrossRef CAS.
- E. Santacesaria, M. Di Serio, A. Russo, U. Leone and R. Velotti, Chem. Eng. Sci., 1999, 54, 2799–2806 CrossRef CAS.
- E. Santacesaria, M. Diserio, R. Velotti and U. Leone, Ind. Eng. Chem. Res., 1994, 33, 277–284 CrossRef CAS.
- E. Santacesaria, P. Wilkinson, P. Babini and S. Carra, Ind. Eng. Chem. Res., 1988, 27, 780–784 CrossRef CAS.
- R. Krishna and S. T. Sie, Chem. Eng. Sci., 1994, 49, 4029–4065 CrossRef CAS.
- R. G. Chaudhuri and S. Paria, Chem. Rev., 2012, 112, 2373–2433 CrossRef PubMed.
- J.-T. Feng, H.-Y. Wang, D. G. Evans, X. Duan and D.-Q. Li, Appl. Catal., A, 2010, 382, 240–245 CrossRef CAS.
- C. Shen, Y. J. Wang, J. H. Xu, Y. C. Lu and G. S. Luo, Chem. Eng. J., 2011, 173, 226–232 CrossRef CAS.
- C. Shen, Y. J. Wang, J. H. Xu, K. Wang and G. S. Luo, Langmuir, 2012, 28, 7519–7527 CrossRef CAS PubMed.
- A. Drelinkiewicz, A. Pukkinen, R. Kangas and R. Laitinen, Catal. Lett., 2004, 94, 157–170 CrossRef CAS.
- E. W. Thiele, Ind. Eng. Chem., 1939, 31, 916–920 CrossRef CAS.
- V. Balakotaiah, Chem. Eng. Sci., 2008, 63, 5802–5812 CrossRef CAS.
- A.-I. Galaction, A. M. Lupasteanu, M. Turnea and D. Cascaval, Environ. Eng. Manage. J., 2010, 9, 675–680 CAS.
- S. A. Meier, M. A. Peter, A. Muntean and M. Boehm, Chem. Eng. Sci., 2007, 62, 1125–1137 CrossRef CAS.
- T. Z. Zhang, L. R. Yang and Z. Q. Zhu, Enzyme Microb. Technol., 2005, 36, 203–209 CrossRef CAS.
- R. Halder and A. Lawal, Catal. Today, 2007, 125, 48–55 CrossRef CAS.
- A. Lyle, Albright's chemical engineering handbook, CRC Press, 2008 Search PubMed.
- C. N. Satterfield, Mass transfer in heterogeneous catalysis, Massachusetts Institute of Technology Press, Cambridge, Mass, 1970 Search PubMed.
- C. R. Wilke and P. Chang, AIChE J., 1955, 1, 264–270 CrossRef CAS.
- A. Drelinkiewicz, R. Laitinen, R. Kangas and J. Pursiainen, Appl. Catal., A, 2005, 284, 59–67 CrossRef CAS.
- R. Edvinsson Albers, M. Nyström, M. Siverström, A. Sellin, A. C. Dellve, U. Andersson, W. Herrmann and T. Berglin, Catal. Today, 2001, 69, 247–252 CrossRef CAS.
|
| This journal is © The Royal Society of Chemistry 2016 |
Click here to see how this site uses Cookies. View our privacy policy here. 


