DOI:
10.1039/C5RA23151E
(Paper)
RSC Adv., 2016,
6, 11967-11972
Hydrothermally synthesized graphene and Fe3O4 nanocomposites for high performance capacitive deionization
Received
4th November 2015
, Accepted 14th January 2016
First published on 18th January 2016
Abstract
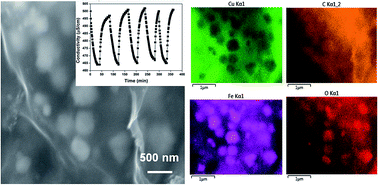
Capacitive deionization (CDI) devices with low energy consumption and high salt removal efficiencies have attracted much attention. Recently, graphene has been proved to be one of the most promising materials for CDI electrodes. However, pristine graphene is far from desirable due to its low removal efficiency and unavoidable decays in performance. In this study, a reduced graphene oxide/Fe3O4 nanoparticle (RGO@Fe3O4) hybrid is proposed and synthesized via a hydrothermal approach for enhanced CDI. Electrochemical analysis of this nanocomposite material has revealed typical electrical double layer capacitive behaviour and an improved specific capacitance. Furthermore, the electrosorption capacity and current efficiency of RGO@Fe3O4 were found to be nearly two folds higher than that of RGO. This huge improvement is attributed to the hydroxylation of the Fe3O4 surface. In addition, the maximum electrosorption capacity predicted from the Langmuir isotherm was ∼8.33 and ∼4.63 mg g−1, corresponding to the RGO@Fe3O4 and RGO electrode, respectively.
1. Introduction
In the past decade, capacitive deionization (CDI) has emerged as one of the most promising techniques to produce portable water from saline water. It has attracted much attention due to its low driving energy, high removal efficiency, high water recovery rate, cost effectiveness and low environmental impact.1–5 In a typical CDI process, the charged species in solution are electrostatically attracted to the surface of oppositely charged electrodes to form electrical double layers (EDL) and this generates a diluted solution. Since the desalination performance of CDI is dependent on the electrodes to provide the vacancies to accommodate ions, the physicochemical characteristics associated with electrodes are significant. In CDI research, porous carbon based electrodes using mesoporous carbon,6 carbon nanotubes,7 carbon aerogels8 and graphene9 have been employed as electrode materials for achieving high performance in CDI due to their large surface areas, mild pore size distribution and tunable electrical conductivities.
Among the aforementioned carbon materials, graphene possesses the highest theoretical surface area of ∼2600 m2 g−1. Its high surface area coupled with the ease of mass production through wet synthesis approach makes it an attractive material for investigation. However, graphene sheets are prone to agglomeration during the reduction process of graphene oxide (GO)10 and this leads to uncontrollable pore size distribution and low surface areas. Consequently, it decreases the EDL capacitance of electrodes and deteriorates the CDI performance. To circumvent this problem, a variety of methods have been developed to suppress the restacking of graphene sheets. For example, graphene/mesoporous carbon composites were fabricated to form a mesoporous structure.11 This composite showed an electrosorption capacity of 0.73 mg g−1 with an applied potential of 2.0 V in a 40 mg L−1 NaCl solution. In a separate study, carbon nanotubes (CNT) were synthesized with graphene to form composites with increased specific surface areas.12 These composites exhibit an improved electrosorption capacity of 1.41 mg g−1 at 2.0 V in a 25 mg L−1 NaCl solution. In addition, resorcinol–formaldehyde (RF) resins were coupled with graphene to alleviate the aggregation of graphene sheets.13 The prepared RGO@RF electrode showed a promising electrosorption capacity of 3.47 mg g−1 at a potential of 2.0 V in a 40 mg L−1 NaCl solution. Hence, it has been shown that the functionalization of graphene can improve the overall CDI performance.
Despite these advances, a rational design is needed to fully utilize the high surface area and further improve the CDI performance. To that end, many researchers have embarked on the synthesis of unique graphene architectures with remarkable qualities. One example would be three-dimensional (3D) graphene. This type of graphene has an interconnected macroporous structure which is beneficial in buffering ions and reducing the diffusion distance from an external electrolyte to the internal surfaces. Following this direction, graphene materials with open structures were developed. These include 3D macroporous graphene,14 3D sponge-template graphene15,16 as well as its composite with carbon nanotubes.17,18 3D graphene was synthesized by Zhang et al. via a versatile template-directed method which resulted in a high surface area of 339 m2 g−1 with an average pore diameter of 4 nm.14 It showed an electrosorption capacity of 3.9 mg g−1 with a potential of 1.6 V in a 52 mg L−1 NaCl solution. A downside to this strategy is that the synthesis process is relatively complicated, time-consuming, and costly. More importantly, the calculated theoretical electrosorption capacity of such graphene structures is limited.
An inherent advantage graphene sheets have over amorphous or 1D carbon materials is its ability to easily self-assemble into 3D networks.19 This not only creates a large number of open pores that are accessible to NaCl molecules but also enables the growth and anchoring of functional organic/inorganic materials with high loading amounts.20,21 In particular, the incorporation of metal oxides will significantly improve the capacitance of graphene-based materials.22 Fe3O4 for example, is environmentally benign, chemically stable and has high pseudocapacitance through redox reactions. Potentially, Fe3O4 is a choice material for the synthesis of graphene/metal oxide nanocomposites for energy storage and related technologies.23
In this work, reduced graphene oxide and Fe3O4 (RGO@Fe3O4) hybrids were prepared by a facile hydrothermal method and fabricated as electrodes for symmetrical CDI. The cyclic voltammetry (CV) curve of RGO@Fe3O4 exhibits a typical electrical double layer capacitive behaviour. Compared to RGO, the enhanced capacitance of RGO@Fe3O4 may arise from an exchange activity between the hydrated Fe3O4 and Na+. Subsequently, the electrosorption performance of RGO@Fe3O4 and RGO were comparatively investigated. It is found that the removal capacity, electrosorption rate constant and charge efficiency of RGO@Fe3O4 is nearly twice as high as that of RGO. Additionally, the maximum removal capacity of RGO@Fe3O4 is predicted by the Langmuir model, which shows a high value of ∼8.33 mg g−1.
2. Experimental
2.1 Synthesis of RGO@Fe3O4
Graphene oxide (GO) was prepared according to a modified hummers' method which has been documented in our previous studies.24 A typical synthesis procedure for synthesizing RGO@Fe3O4 is as follows: 0.025 g GO is first dispersed by ultrasonication in 7 mL of ethylene glycol for 1 hour to obtain solution A. Next, 0.1 g of Fe(NO3)3·9H2O and 0.051 g KOH were separately dissolved in 15 mL ethylene glycol under vigorous stirring for 10 minutes to get solution B. Subsequently. Solution A and B were loaded in a Teflon lined autoclave, which was then filled with ethylene glycol up to 80% of the total volume. The autoclave was sealed and maintained at a certain temperature which was controlled from 200 °C to 250 °C for 24 h. Finally, it was cooled down to room temperature naturally. The products were washed several times with deionized water and absolute ethanol to remove any impurities and dried at 60 °C for 6 h to obtain the final product.
2.2 Characterization
The surface morphologies and energy dispersive spectroscopy (EDS) spectrum of the samples were characterized by a field emission scanning electron microscope (FESEM, JEOL JSM-7600F) and a transmission electron microscope (TEM, JEOL JEM-2100F). Next, the Raman measurements were carried out using a WITec alpha 300 confocal Raman microscope equipped with a 532 nm solid-state laser for excitation. The Brunauer–Emmett–Teller (BET) specific surface area were deduced from the automatic high-resolution physisorption (micropore/mesopore) analyzer using an Autosorb-iQ-MP-XR System (Quantachrome, USA), and the pore size distribution was derived from the adsorption branches of the isotherms using the Barrett–Joyner–Halenda (BJH) method. The crystalline nature of the samples was investigated using an X-ray diffractometer (Bruker, D8 Advance-Eco) equipped with a Kα radiation (λ ≈ 1.54 Å) source. Thermogravimetric analysis (TGA) was carried out using Shimadzu DTG-60 under compressed air flow gas at a rate of 5 °C min−1. X-Ray photoelectron spectroscopy (XPS, Thermo ESCALAC250Xi) spectra was collected on a monochromatized Al Kα X-ray source (1486.6 eV).
2.3 Electrochemical test
The RGO@Fe3O4 electrodes were fabricated as follows: RGO@Fe3O4, carbon black and polyvinylidene fluoride were mixed in a mass ratio of 80
:
10
:
10 and dispersed in ethanol with the addition of a few drops of dimethylformamide. The resulting mixture was coated onto the graphite paper with a spatula, followed by drying at 60 °C for 12 h. The electrochemical measurements were performed in a typical three-electrode setup composed of either RGO or RGO@Fe3O4 as working electrodes, Pt foil as the counter electrode and a saturated calomel electrode (SCE) as the reference electrode. CV measurements were performed at various scan rates from 1 to 100 mV s−1 on an electrochemical workstation (VMP3, Bio-logic, France) in 1 M NaCl solutions.
2.4 CDI experiment
The desalination performance of both RGO and RGO@Fe3O4 was investigated by conducting batch-mode electrosorption experiments using a continuously recycling system which has been described in our previous work.25,26 The total mass of electrodes is 0.07 g. At the start of each experiment, an analytically pure NaCl solution of 40 mL was prepared. The concentration of NaCl solution was varied from 50 to 500 mg L−1 whereas the applied direct voltage varied from 1.0 to 1.6 V. Other experimental parameters which remain constant were the flow rate (30 mL min−1) and solution temperature (298 K). The relationship between conductivity and concentration was obtained according to a calibration table made prior to the experiment. The concentration variation was continuously monitored and measured at the outlet of the unit cell using an ion conductivity meter (DSJ 308F, LeiCi, Shanghai). The electrosorption capacity (Γ, mg g−1) can be calculated as:where C0 and Cf are the initial and final NaCl concentrations (mg L−1), respectively, V is the volume of NaCl solution (L) and m is the total mass of the electrodes (g).
3. Results and discussion
Fig. 1(a) and (b) show the SEM images of RGO and RGO@Fe3O4. It clearly reveals that Fe3O4 nanoparticles (NPs) have fully incorporated onto RGO layers without aggregation. The EDS mapping analysis on C, Fe and O shown in Fig. 1(e) confirm the chemical composition for the RGO@Fe3O4 hybrid electrode. The detailed nanostructures of the hybrid RGO@Fe3O4 is further investigated by high-resolution TEM (HRTEM) imaging. As shown in Fig. 1(c) and (d), a large amount of Fe3O4 NPs with diameters ranging from 10 to 200 nm is uniformly distributed on the RGO layers. Moreover, an enlarged image containing a Fe3O4 NP is given in inset of Fig. 1(c). It can be seen that the Fe3O4 NP is tightly wrapped with RGO sheets. This surface decoration by RGO promotes an interconnected architecture between individual clusters of Fe3O4 nanocrystals to form a 3D network structure, thus facilitating ion transportation between Fe3O4 and RGO sheets. Further, the inset of Fig. 1(c) shows the lattice fringes of Fe3O4 and reveals an interspacing of ∼0.296 nm which corresponds to the (311) plane of Fe3O4.
 |
| Fig. 1 SEM image of RGO (a) and RGO@Fe3O4 (b), (c) TEM image of RGO@Fe3O4 (inset is the TEM image of a Fe3O4 NP) and (d) SAED pattern, (e) the SEM image and EDX mapping of (b) Cu, (c) C, (d) Fe and (e) O for RGO@Fe3O4 (note that the Cu is from the substrate). | |
The selected area electron diffraction (SAED) pattern shows a face centered cubic crystal structure of Fe3O4, which is confirmed by the XRD pattern shown in Fig. 2(a) as well. Fig. 2(b) is the Raman spectra of RGO@Fe3O4. It shows 4 typical peaks of the Fe–O stretching vibration which indicates successful synthesis of RGO@Fe3O4 nanocomposites. The Raman bands at 218.8 and 491.3 cm−1 are attributed to the scattering of A1g mode of Fe3O4, whereas the bands at 283, 394.1 and 593.4 cm−1 are attributed to the scattering of Eg mode of Fe3O4. Besides that, the characteristic D and G bands of the RGO@Fe3O4 hybrid were observed at 1344 and 1586 cm−1 respectively. The D band is associated with disordered samples or graphene edges, while the G band is the result of first-order scattering of the E2g mode of sp2 carbon domains. Both the position and intensity of D and G bands are highly susceptible to structural changes of the carbon matrix and many factors affect the position and intensity of D and G bands. These include doping effects, layer numbers, defects, strains and substrates. It is observed that the ratio of ID over IG is 1.05 which is higher than 1, thus confirming the reduction of GO to RGO. The N2 adsorption–desorption isotherm is presented in Fig. 2(c). It shows cross curves between type-I and type-IV curves, demonstrating the presence of micro/mesopores in this composite. The BET surface area of RGO@Fe3O4 is measured to be 150.8 m2 g−1 and the corresponding BJH desorption pore volume is 0.166 m3 g−1. The high specific surface area is attributed to excellent dispersion of RGO and promotes the diffusion of electrolyte to the activate sites.27 The inset in Fig. 2(c) represents the pore size distribution of RGO@Fe3O4. A broad peak from 2 to 5 nm is observed in the curve, confirming the mesoporosity of RGO@Fe3O4 according to the IUPAC classification. TGA was utilized to determine the amount of RGO within the hybrid. Fig. 2(d) shows the TGA graph for the RGO@Fe3O4. From this figure, it can be seen that the burning of RGO ranges approximately from 150 °C to 420 °C. The residual remains after 420 °C is due to the presence of Fe3O4 NPs. Thus, the weight ratio of RGO over Fe3O4 NPs is ∼1
:
1.5. It should be mentioned that low amount of RGO in the hybrid would result in low specific surface area which is not desirable in CDI experiment.
 |
| Fig. 2 The XRD (a), Raman (b), N2 adsorption–desorption isotherm (c) and (d) TGA curve of RGO@Fe3O4 (inset in (b) is magnified selected area while inset in (c) is corresponding pore size distribution). | |
The extent of the residual oxygen on the graphene sheet during hydrothermal treatment is examined by XPS. Fig. 3(a) shows the XPS spectrum of C1s for Fe3O4-RGO which could be deconvoluted into three peaks (colored lines) with different carbon ratios: sp2 bonded carbon at 284.5 eV (C–C), epoxy/hydroxyls at 286.4 eV (C–O) and carbonyls at 288.4 eV (C
O). Obviously, it presents the high percentage of oxygen-containing functional groups due to incomplete reduction by hydrothermal reaction. It should be noted that XPS spectrum of O1s shows the similar results. Fig. 3(b) exhibits the Fe2p spectrum of Fe3O4. Clearly, due to the spin–orbit coupling, Fe2p core level is split into 2p1/2 and 2p3/2 components. Because the binding energy of Fe2+ and Fe3+ in the Fe2p3/2 spectrum is expected to be 709.4 eV and 710.8 eV, respectively, the asymmetric broadband centered at around 710 eV manifests the coexistence of Fe3+ and Fe2+.
 |
| Fig. 3 C1s (a) and Fe 2p (b) region in the XPS spectrum of the as-synthesized RGO@Fe3O4. | |
CV measurements were extensively employed to study the electrochemical behavior and to determine the specific capacitance of the electrodes. Fig. 4(a) displays the representative CV curves of RGO/RGO@Fe3O4 at a scanning rate of 10 mV s−1 in 1 M NaCl solution while Fig. 4(b) depicts the corresponding specific capacitance at scanning rates ranging from 1 to 100 mV s−1. The curves of both RGO and RGO@Fe3O4 demonstrate an almost rectangular shape without presenting any peaks, suggesting double layer capacitive behavior. Compared to that of RGO electrode, the CV curve of RGO@Fe3O4 has a larger integrated CV area, implying a higher specific capacity. The improvement of the specific capacity from RGO to RGO@Fe3O4 is mainly ascribed to the hydroxylation of Fe3O4 surface.28 Thus, diffusion and adsorption of ions become facile on the hybrid electrode. The mechanism of this process is probably as follows:
|
Fe3O4(H2O)n = Fe3O4(OH)−n + nH+
| (2) |
|
Fe3O4(OH)−n + nNa+ = Fe3O4(OH)nNan
| (3) |
 |
| Fig. 4 (a) The CV curve of RGO and RGO@Fe3O4 in 1 M NaCl solution at the scanning rate of 10 mV s−1, (b) the specific capacity of RGO and RGO@Fe3O4 dependent on scanning rate, (c) a complete electrosorption–desorption cycle for RGO@Fe3O4 electrode at 1.2 V and (d) electrosorption performance of RGO@Fe3O4 at different electrical voltage in NaCl solution with an initial conductivity of 500 μS cm−1 (inset in (c) and (d) are corresponding current transient). | |
Fig. 4(c) exhibits the electrosorption–desorption cycle of RGO@Fe3O4 in NaCl solution with an initial conductivity of 500 μS cm−1 at a voltage of 1.2 V and the inset shows the corresponding current transient. Once the electrical voltage is applied, the conductivity decreases significantly. After 30 minutes, the conductivity gradually decreases to 465 μS cm−1 and does not change anymore, indicating that equilibrium is reached. Then the CDI unit is shorted, resulting in a desorption process. The solution conductivity returns to its initial level and regeneration is completed. Similarly, the current curve follows the same transient (inset). Fig. 4(d) shows the conductivity and current transition (inset) of RGO@Fe3O4 at electrical voltages of 1.0, 1.2, 1.4 and 1.6 V respectively. Clearly, the higher voltage is, the higher salt removal capacity is.
In order to make reasonable comparisons, the normalized removal capacity (mg g−1) of the RGO/RGO@Fe3O4 electrode under different cell voltages (V) is plotted in Fig. 5(a). For both electrodes, an increase in electrical voltage results in higher removal capacity due to higher electrostatic force. At a certain voltage, the removal capacity of RGO@Fe3O4 is nearly two folds higher than RGO. The current efficiency is also calculated and shown in Fig. 6(a). It is defined as:
|
 | (4) |
where
F is the Faraday constant (96
![[thin space (1/6-em)]](https://www.rsc.org/images/entities/char_2009.gif)
485 s A mol
−1),
Γ (removal capacity, mg g
−1) and
Σ (specific charge which is obtained by integrating the current (A) with time (s), C g
−1). In the case of an ideal CDI process, each electron charge is fully charge-balanced by a counter ion adsorption and the transfer of an electron from one electrode to another is accompanied by the removal of precisely one salt molecule from the bulk solution. However, due to co-ions impaction caused by simultaneous adsorption, the current efficiency is often less than 1 which means that the majority of input energy is lost, leading to low energy efficiency. It can be seen from
Fig. 6(a) that RGO has a very low current efficiency (0.32 at 1.2 V). This implies that significant co-ions impaction had taken place before electrode charging, probably due to incomplete reduction of GO. As for RGO@Fe
3O
4 electrodes, the current efficiency is highly improved. At each certain electrical voltage, the current efficiency of RGO@Fe
3O
4 is nearly two folds higher than that of RGO, which implies less co-ions impaction had taken place.
 |
| Fig. 5 (a) The mass normalized salt removal capacity and (b) kinetic fitting for RGO and RGO@Fe3O4 at different electrical voltages. | |
 |
| Fig. 6 (a) The current efficiency of RGO and RGO@Fe3O4 at different voltage, (b) the Langmuir isotherm of RGO and RGO@Fe3O4, (c) the regeneration curve of RGO@Fe3O4 in five cycles, (d) the salt removal capacity with respect to cycles. | |
The electrosorption rate of NaCl onto RGO@Fe3O4 is a crucial parameter in our investigations of the CDI process. Therefore, the pseudo-first-order model is employed and its linearized forms of equation can be expressed as:
|
log(Qe − Qt) = log Qe − kad × t/2.303
| (5) |
where
Qe and
Qt are the amounts of the ions adsorbed (mg g
−1) at equilibrium and at time
t (min), respectively.
kad (min
−1) is the rate constant of pseudo-first-order model.
Fig. 5(b) shows the experimental data at various electrical voltages as well as the fitting line using the model equation. The rate constant is obtained from the slope of the lines in
Fig. 5(b) and is summarized in
Table 1. The kinetics of the adsorption process can be evaluated based on how close the regression coefficient (
R2 in
Table 1) is to unity. From the data given in
Table 1, it can be seen that the simulated lines agree well with experimental data and an increase in electrosorption rate constant is observed as the voltage is increased from 1.0 V to 1.6 V. This result is consistent with the conductivity variation observed in
Fig. 4(b). It is also observed that the rate constant
kad of RGO@Fe
3O
4 is much higher than that of RGO regardless of the applied voltage.
Table 1 Parameters of the first order kinetics
|
1.0 V |
1.2 V |
RGO |
RGO@Fe3O4 |
RGO |
RGO@Fe3O4 |
kad (min−1) |
0.2059 |
0.2987 |
0.2349 |
0.3289 |
R2 |
0.9642 |
0.9578 |
0.9949 |
0.9992 |
|
1.4 V |
1.6 V |
RGO |
RGO@Fe3O4 |
RGO |
RGO@Fe3O4 |
kad (min−1) |
0.2836 |
0.3258 |
0.3449 |
0.3455 |
R2 |
0.9611 |
0.9871 |
0.9958 |
0.9839 |
The Langmuir adsorption isotherm is often employed to describe the electrosorption behavior and predict the maximum adsorption capacity of electrodes in NaCl solutions. The equation of Langmuir isotherms is shown as follows:
|
 | (6) |
where
Qm is the maximum adsorption capacity corresponding to complete monolayer coverage (mg g
−1),
KL is the Langmuir constants, and
C is the equilibrium concentration (mg L
−1). The experimental data and fitting line in terms of RGO@Fe
3O
4 and RGO electrode are given in
Fig. 6(b). All parameters involving
Qm,
KL and
R2 (regression coefficient) are presented in
Table 2. Based on the calculated the
R2, it can be seen that the Langmuir isotherm perfectly describes the electrosorption performance of both RGO@Fe
3O
4 and RGO electrodes. Correspondingly, the Langmuir isotherm predicts a higher maximum adsorption capacity,
Qm for RGO@Fe
3O
4 electrodes (8.33 mg g
−1) than RGO (4.63 mg g
−1).
Table 2 Parameters of the Langmuir isotherm
|
Qm (mg g−1) |
KL |
R2 |
RGO |
4.63 |
0.0973 |
0.9859 |
RGO@Fe3O4 |
8.33 |
0.0647 |
0.9927 |
Complete regeneration of electrodes is essential for commercial applications of CDI. Fig. 6(c) shows an experiment of 5 electrosorption–desorption cycles of RGO@Fe3O4 electrode which is carried out by repeating several charging (1.2 V) and discharging (0 V) processes in a NaCl solution with an initial conductivity of 500 μS cm−1. It can be seen that the repeatability of electrosorption process can be realized through RGO@Fe3O4 electrode. Furthermore, the electrosorption capacity declination has not been observed for RGO@Fe3O4 even after over 30 charge–discharge cycles, implying an excellent regeneration.
4. Conclusions
In conclusion, a reduced graphene oxide and Fe3O4 hybrid (RGO@Fe3O4) has been prepared for high performance capacitive deionization (CDI). The resultant Fe3O4 nanoparticle is fully encapsulated by RGO nanosheets and the specific surface area of RGO@Fe3O4 is 150.8 m2 g−1. Cycle voltammetry curves indicate a typical electrical double layer capacitive behaviour and shows a higher specific capacity which is probably due to the hydroxylation of Fe3O4 surface. Compared to RGO, the electrosorption capacity and current efficiency of RGO@Fe3O4 is nearly two folds higher than that of RGO regardless of applied voltage. The kinetics and isotherm results also illustrate a higher electrosorption rate of RGO@Fe3O4 electrode. The maximum electrosorption capacity predicted from the Langmuir isotherm is 8.33 mg g−1 whereas the corresponding value for RGO is 4.63, indicating the great potential of RGO@Fe3O4 in application to CDI.
Acknowledgements
The research project is supported by the Singapore National Research Foundation under its Environmental & Water Technologies Strategic Research Programme and administered by the Environment & Water Industry Programme Office (EWI) of the PUB.
Notes and references
- K. Laxman, M. T. Z. Myint, R. Khan, T. Pervez and J. Dutta, Electrochim. Acta, 2015, 166, 329 CrossRef CAS.
- A. Subramani and J. G. Jacangelo, Water Res., 2015, 75, 164 CrossRef CAS PubMed.
- G. M. Geise, D. R. Paul and B. D. Freeman, Prog. Polym. Sci., 2014, 39, 1 CrossRef CAS.
- S. Porada, R. Zhao, A. van der Wal, V. Presser and P. M. Biesheuvel, Prog. Mater. Sci., 2013, 58, 1388 CrossRef CAS.
- H. B. Li, Y. Gao, L. K. Pan, Y. P. Zhang, Y. W. Chen and Z. Sun, Water Res., 2008, 42, 4923 CrossRef CAS PubMed.
- S. Porada, F. Schipper, M. Aslan, M. Antonietti, V. r. Presser and T.-P. Fellinger, ChemSusChem., 2015, 8, 1867 CrossRef CAS PubMed.
- Q. Dong, G. Wang, T. T. Wu, S. P. Peng and J. S. Qiu, J. Colloid Interface Sci., 2015, 446, 373 CrossRef PubMed.
- P. Xu, J. E. Drewes, D. Heil and G. Wang, Water Res., 2008, 42, 2605 CrossRef CAS PubMed.
- H. B. Li, T. Lu, L. K. Pan, Y. P. Zhang and Z. Sun, J. Mater. Chem., 2009, 19, 6773 RSC.
- D. R. Dreyer, S. J. Park, C. W. Bielawski and R. S. Ruoff, Chem. Soc. Rev., 2010, 39, 228 RSC.
- D. S. Zhang, X. R. Wen, L. Y. Shi, T. T. Yan and J. P. Zhang, Nanoscale, 2012, 4, 5440 RSC.
- H. B. Li, S. Liang, J. Li and L. J. He, J. Mater. Chem. A, 2013, 1, 6335 CAS.
- Z. Wang, B. J. Dou, L. Zheng, G. Zhang, Z. H. Liu and Z. P. Hao, Desalination, 2012, 299, 96 CrossRef CAS.
- H. Wang, D. S. Zhang, T. T. Yan, X. R. Wen, J. P. Zhang and L. Y. Shi, J. Mater. Chem. A, 2013, 1, 6335 Search PubMed.
- X. T. Xu, L. K. Pan, Y. Liu, T. Lu, Z. Sun and D. H. C. Chua, Sci. Rep., 2015, 5, 8458 CrossRef CAS PubMed.
- X. T. Xu, L. K. Pan, Y. Liu, T. Lu and Z. Sun, J. Colloid Interface Sci., 2015, 445, 143 CrossRef CAS PubMed.
- Y. Liu, X. T. Xu, T. Lu, Z. Sun, D. H. C. Chua and L. K. Pan, RSC Adv., 2015, 5, 34117 RSC.
- X. T. Xu, Y. Liu, T. Lu, Z. Sun, D. H. C. Chua and L. K. Pan, J. Mater. Chem. A, 2015, 3, 13418 CAS.
- H. Yin, H. Tang, D. Wang, Y. Gao and Z. Tang, ACS Nano, 2012, 6, 8288 CrossRef CAS PubMed.
- Y. Zhao, C. Hu, Y. Hu, H. Cheng, G. Shi and L. Qu, Angew. Chem. Int. Ed., 2012, 124, 11533 CrossRef.
- H. Wang, L. F. Cui, Y. Yang, H. S. Casalongue, J. T. Robinson, Y. Liang, Y. Cui and H. Dai, J. Am. Chem. Soc., 2010, 132, 13978 CrossRef CAS PubMed.
- K. C. Leonard, W. E. Suyama and M. A. Anderson, Langmuir, 2012, 28, 6476 CrossRef CAS PubMed.
- T. W. Lin, C. S. Dai and K. C. Hung, Sci. Rep., 2015, 4, 7274 CrossRef PubMed.
- H. B. Li, L. D. Zou, L. K. Pan and Z. Sun, Environ. Sci. Technol., 2010, 44, 8692 CrossRef CAS PubMed.
- H. B. Li, F. Zaviska, S. Liang, J. Li, L. J. He and H. Y. Yang, J. Mater. Chem. A, 2014, 2, 3484 CAS.
- H. B. Li, L. K. Pan, C. Y. Nie, Y. Liu and Z. Sun, J. Mater. Chem., 2012, 22, 15556 RSC.
- H. J. Yin, S. L. Zhao, J. W. Wan, H. J. Tang, L. Chang, L. C. He, H. J. Zhao, Y. Gao and Z. Y. Tang, Adv. Mater., 2013, 25, 6270 CrossRef CAS PubMed.
- H. X. Wu, T. J. Wang and Y. Jin, Ind. Eng. Chem. Res., 2007, 46, 761 CrossRef CAS.
|
This journal is © The Royal Society of Chemistry 2016 |
Click here to see how this site uses Cookies. View our privacy policy here.