99mTc-labeled and gadolinium-chelated transferrin enhances the sensitivity and specificity of dual-modality SPECT/MR imaging of breast cancer
Bingxin Guadef,
Jiali Caib,
Jianping Zhangadef,
Xiaoping Xuadef,
Jianming Luoadef,
Xiaobao Zhouc,
Yingying Zhengadef and
Yingjian Zhang*adef
aDepartment of Nuclear Medicine, Fudan University Shanghai Cancer Center, Shanghai, China. E-mail: yjzhang111@aliyun.com
bChangzheng Hospital, Secondary Military Medical University, Shanghai, China
cThe Key Laboratory of Resource Chemistry of Ministry of Education, College of Life and Environmental Science, Shanghai Normal University, Shanghai, China
dCenter for Biomedical Imaging, Fudan University, Shanghai, China
eDepartment of Oncology, Shanghai Medical College, Fudan University, Shanghai, China
fShanghai Engineering Research Center of Molecular Imaging Probes, Shanghai, China
First published on 29th January 2016
Abstract
A tumor-targeting dual-modal probe, 99mTc-labeled and gadolinium (Gd)-chelated transferrin was explored to improve the imaging of solid tumors such as breast cancer. In the present study, the Gd was successfully chelated to transferrin with 26 Gd loaded per protein and calculated longitudinal relaxivity r1 4.34 mM−1 s−1 per Gd, while that of Gd–DTPA was 4.19 mM−1 s−1. 99mTc was labeled to Tf–DTPA–Gd, yielding a labeling rate of approximately 96% and a radiochemical purity of greater than 96%. For the binding between 99mTc–Tf–DTPA–Gd and the transferrin receptor on the surface of 4T1 cells, the equilibrium dissociation constant (Kd) was 3120 ± 600.60 nmol L−1, and the half-inhibition concentration (IC50) was 23.46 ± 1.36 nmol L−1. Furthermore, Tf–DTPA–Gd improved the diagnostic efficiency of breast cancer with the relatively enhanced signal (195.25%) in T1-weighted MR imaging, compared to 131.75% for Magnevist. SPECT/CT imaging with 99mTc–Tf–DTPA–Gd indicated that the tumor imaging was clearest 5 h after the injection. The mean calculated half-lives of 99mTc–Tf–DTPA–Gd in blood were 6.12 and 69.32 minutes, respectively. The high uptake of radioactivity in liver and kidneys suggested that 99mTc–Tf–DTPA–Gd was predominantly metabolized and cleared by the liver and kidneys. This dual-modal probe can be effectively utilized for the specific imaging of breast tumor via SPECT and MR.
Introduction
Breast cancer is now the most frequently diagnosed cancer in women, and is the second leading cause of cancer-related death in the United States1 and the sixth in China.2 The main reason accounting for the high mortality is the late diagnosis of breast cancer at advanced stages. Therefore, early diagnosis is critical to reduce the death of breast cancer patients.Molecular imaging, which represents a wide range of innovative technologies that integrate advances in both imaging sciences and molecular biology,3 aims to characterize and measure the processes of tumor progression in vivo at the cellular and molecular level.4 However, as a result of the heterogeneity of tumors and patients, a single imaging modality couldn't provide necessary reliable and accurate information about the disease due to its intrinsic limits.5 For instance, magnetic resonance imaging (MRI), a non-invasive approach generating high spatial resolution and multi-planar imaging, is currently a preferred method in the diagnosis of breast cancer. However, MRI is not sensitive and lacks molecular detail. Single-photon emission computed tomography (SPECT) can provide high sensitivity, but is limited in resolution.6 On account of the great progress in the development of combination of imaging instruments, multimodal imaging has drawn more attention to overcome the limitations of single imaging modality.7–10 The limitations of MRI and SPECT alone can be overcome by the combination of the two imaging technologies.
To achieve dual-function with magnetic and radioactivity properties, probes containing all information of the two imaging modalities by administration of a single contrast agent are needed. Gadolinium ions (Gd3+), containing seven unpaired electrons that can competently alter the relaxation time of surrounding water protons, provides enhanced signal as a positive contrast.11 However, the commonly used micromolecule gadolinium chelate-based contrast agents, for instance, gadolinium–diethylenetriamine pentaacetic acid (Magnevist), suffer rapid elimination, short imaging time, and low specificity to target tissues. To overcome these shortcomings, macromolecular carriers, like albumin,12,13 can be taken into account for their stable, biodegradable, non-toxic, non-immunogenic properties and easy to modify. The isotope 99mTc, which has a half-life of 6 h and emits γ-rays with energy of 141 keV, is considered to be an ideal radionuclide for clinical imaging.14
Transferrin receptor (TfR) is a ubiquitous human cell glycoprotein and binds and internalizes two molecules of the iron-bound transferrin (Tf). TfR plays a major role in supplying the cell with iron and other indispensable micronutrient for nearly all organisms and participates in oxygen transport, energy production, cell growth and DNA synthesis.15,16 The expression level of TfR is correlated with cellular proliferation status, and it is expressed more abundantly in malignant cells including various breast cancer cells than those in normal cells.17 Transferrin–TfR interaction has been used as a potential efficient pathway for cellular uptake of drugs,18 and also for tumor imaging.19,20 Transferrin conjugated probes for breast cancer imaging has been reported.21,22
In this study, we first synthesized a radiolabeled 99mTc-transferrin–DTPA–Gd probe, evaluated it as a specific dual-modal probe for breast tumor imaging using SPECT/MR, and found that 99mTc–Tf–DTPA–Gd displayed higher specificity and sensitivity for detecting TfR-expressing breast tumor cells in culture or in xenografted mice.
Materials and methods
Materials
Holo-transferrin (Tf) from human was purchased from Sigma-Aldrich (St. Louis, Mo, USA). Diethylenetriamine pentaacetic acid dianhydride (DTPAa), Gd(III) chloride hydrate and Stannous chloride (SnCl2·2H2O) were purchased from J&K Scientific Ltd (Shanghai, China). Magnevist (Gd–DTPA) was obtained from Beijing Beilu Pharmaceutical (Beijing, China). Bicinchoninic acid (BCA) and Cell Counting Kit-8 (CCK-8) were purchased from Beyotime Inst Biotech (Shanghai, China). 99mTc-pertechenetate (99mTcO4−) was obtained from Shanghai Xinke (Shanghai, China). Fetal bovine serum (FBS) was purchased from Moregate Biotech (Bulimba QLD, Australia).Cell lines and tumor models
4T1 breast cancer cells were purchased from Cell Bank, Shanghai Institutes for Biological Sciences, Chinese Academy of Sciences, and grown in DMEM medium (Gibco) supplemented with 10% fetal bovine serum and 1% penicillin/streptomycin (P/S) under a humidified atmosphere with 5% CO2 at 37 °C. The cells were collected by trypsinization with 0.25% trypsin/EDTA.Female Balb/c nude mice and female KM mice (4–5 weeks) of 18–20 g body weight were purchased from Lingchang Inst Biotech (Shanghai, China). The 4T1 tumor model was generated by subcutaneous injection of 1 × 10⁶ tumor cells in the right hind legs of the mice. All animal experiments met guidelines evaluated and approved by the ethics committee of Fudan University.
Synthesis and characterization of transferrin–DTPA–Gd
Transferrin (30 mg, 0.38 μmol) was dissolved in 2 mL of 0.1 M bicarbonate buffer, and the pH of the solution was adjusted to 9.0.23 Then the resulting solution was filtered through a 0.22 μm filtration unit. For conjugating DTPA to transferrin, DTPAa (54 mg, 0.15 mmol) was slowly added to the transferrin solution, and the mixture was incubated at room temperature for 10 h under constant shaking at 550 rpm. The DTPA-conjugated transferrin was purified by Amicon Ultra-15 Centrifugal Filter Units (Millipore) through a membrane (cutoff = 10 kDa) and redissolved in 0.1 M citrate buffer (pH 6.5, 2 mL). Then Tf–DTPA was reacted with GdCl3 (4 mg, 0.015 mmol) in 0.1 M citrate buffer (pH 6.5, 2 mL)24 for 10 h at room temperature under constant shaking at 550 rpm. To indirectly measure the amount of DTPA per protein, Tf–DTPA was reacted with 20 mg (0.075 mmol) of GdCl3 at the same reaction condition. The final construct, Tf–DTPA–Gd was purified by ultrafiltration through a membrane (cutoff = 10 kDa) and redissolved in saline.The concentration of Tf–DTPA–Gd was determined by bicinchoninic acid (BCA) method. The number of Gd per protein was measured using inductively coupled plasma atomic emission spectroscopy (ICP-AES).
MALDI-TOF MS
A Voyager-DE STR Matrix Assisted Laser Desorption Ionization-Time Of Flight Mass Spectrometer (MALDI-TOF MS, AB SCIEX, USA) was used to analysis Tf–DTPA–Gd and transferrin. For the sample prepared, Tf–DTPA–Gd (10 mg mL−1) and transferrin (20 mg mL−1) were mixed with 5 mg mL−1 of sinapinic acid dissolved in a 0.1% (v/v) TFA and 30% (v/v) acetonitrile solution. Measurements were performed in positive ion and linear mode. Typically mass spectra were acquired by averaging 10 accumulated spectra of 200 single laser shots, and the measurement was repeated at least 3 times. For mass calibration, bovine serum albumin was used.Relaxivity measurements
To investigate the r1 longitudinal relaxivity of Tf–DTPA–Gd, the samples were diluted in saline transferred to a 96-well elisa plate, with Gd concentrations in the range of 0.075–1.2 mM. Magnevist was used as control. T1-weighted MR images and T1 relaxation times were acquired by using Bruker Biospec 7.0 T/20 cm scanner. The parameters were set as follows: echo time (TE) = 8.02 ms, number of T1 experiments with repetition time (TR) = 50, 100, 250, 500, 1000, 1500 ms, slice thickness = 1.0 mm, field of view (FOV) = 58 × 58 mm, and matrix size = 192 × 192.Images reconstruction and analysis were performed using ParaVision 6.0 (Bruker, Germany). T1 relaxation times were calculated from the multi-TR MRI data. Relaxation rates (R1 = 1/T1) were calculated directly from the T1 maps. By plotting the R1 value for each sample against the Gd concentration, the final r1 longitudinal relaxivity for Tf–DTPA–Gd was calculated by curve fitting.
In vitro cytotoxicity
The in vitro cytotoxicity was evaluated using the CCK-8 assay. The 4T1 cells were placed into a 96-well plate at a density of 1000 cells per well. After 24 h of pre-incubation, the cells were further incubated for 12, 24, and 48 h in fresh culture media containing Tf–DTPA–Gd at eight concentration levels: 0, 50, 100, 250, 500, 1000, 2000, and 4000 μg mL−1. Six replicate wells were established for each sample. The cells were then washed twice with PBS to remove excess samples. The culture media without cells was used as control. Subsequently, 10 μL of CCK-8 was added to each well and incubation for 1 h. The absorbance value (OD) of each well was measured at 450 nm. Experiments were performed three times. The relative cell viability was calculated as following equation:| Relative cell viability (%) = (ODexp − ODcon)/(OD0 − ODcon) × 100%, |
Radiolabeling
Tf–DTPA–Gd in saline (a volume of 0.5 mL containing protein at 1 mg mL−1) was labeled with 99mTc-pertechnetate at pH 7.0, with SnCl2·2H2O as a reducing agent. In the labeling reaction, 5 μL of SnCl2 (1 mg mL−1) and 125 μL of 99mTc-pertechnetate in saline (40 mCi mL−1, 1.48 GBq mL−1) were sequentially added to Tf–DTPA–Gd solution. The mixture was allowed to react for 30 min with shaking at room temperature. Small molecules and free 99mTcO4− were separated by ultrafiltration through a membrane (cutoff = 10 kDa).After the reaction was completed, the labeling efficiency was determined by instant thin-layer chromatography (ITLC) developed with 85% methanol. The stability of 99mTc–Tf–DTPA–Gd in 50% fetal bovine serum at 37 °C was measured at 0, 2, 4, 6, and 8 h after radiolabeling.
Receptor saturation binding experiments
The receptor saturation binding experiments were performed with 4T1 cells. The cells were seeded onto 24-well plates at a density of approximately 5 × 10⁵ cells per well, and cultured in a cell incubator at 37 °C and 5% CO2. After 24 h, the cells were washed 3 times with 1× PBS. Various amounts (0, 84.86, 2546, 4243, 5941, 8486 and 16![[thin space (1/6-em)]](https://www.rsc.org/images/entities/char_2009.gif) 972 nmol L−1) of 99mTc–Tf–DTPA–Gd were added to the wells, and the total volume of each well was 500 μL. Three replicate wells were established for each sample. After incubation for 1 h, the supernatant was removed, and the cells were rinsed 3 times with cold PBS containing 0.5% bovine serum albumin (BSA). Finally, the cells were lysed by 500 μL of 0.1 mol L−1 NaOH and collected into a plastic test tube. The radioactivity in each tube was measured using a γ counter (Shanghai Rihuan Photoelectric Instrument, China).
972 nmol L−1) of 99mTc–Tf–DTPA–Gd were added to the wells, and the total volume of each well was 500 μL. Three replicate wells were established for each sample. After incubation for 1 h, the supernatant was removed, and the cells were rinsed 3 times with cold PBS containing 0.5% bovine serum albumin (BSA). Finally, the cells were lysed by 500 μL of 0.1 mol L−1 NaOH and collected into a plastic test tube. The radioactivity in each tube was measured using a γ counter (Shanghai Rihuan Photoelectric Instrument, China).
The saturation curve for 99mTc–Tf–DTPA–Gd was drawn using the single-site saturation binding curve fitting program from GraphPad Prism 6 (GraphPad Software, USA). The Kd and Bmax values were calculated by nonlinear regression analysis using the GraphPad Prism 6.
Competitive binding experiments
For the competitive binding assays, exponentially growing 4T1 cells were seeded into 24-well plates at a concentration of approximately 5 × 10⁵ cells per well, and cultured in a cell incubator at 37 °C and 5% CO2 for 24 h. Then the cells were washed 3 times with 1× PBS. 99mTc–Tf–DTPA–Gd was added to each well to a concentration of 100 nmol L−1, and unlabeled transferrin was added in each well to concentrations of 0, 1, 10, 100, 1000, and 10![[thin space (1/6-em)]](https://www.rsc.org/images/entities/char_2009.gif) 000 nmol L−1. The total volume of each well was 500 μL. Three replicate wells were established for each concentration. After incubation for 1 h, the supernatant was removed, and the cells were rinsed 3 times with cold PBS containing 0.5% BSA. Finally, the cells were lysed by 500 μL of 0.1 mol L−1 NaOH and collected into a plastic test tube. The radioactivity in each tube was measured using a γ counter.
000 nmol L−1. The total volume of each well was 500 μL. Three replicate wells were established for each concentration. After incubation for 1 h, the supernatant was removed, and the cells were rinsed 3 times with cold PBS containing 0.5% BSA. Finally, the cells were lysed by 500 μL of 0.1 mol L−1 NaOH and collected into a plastic test tube. The radioactivity in each tube was measured using a γ counter.
The competitive binding curve for 99mTc–Tf–DTPA–Gd was drawn using the single-site competitive binding curve fitting program from GraphPad Prism 6. The IC50 value (by nonlinear regression analysis) representing the half-inhibition concentration of transferrin for 99mTc–Tf–DTPA–Gd was calculated.
Cellular uptake of 99mTc–Tf–DTPA–Gd
Cellular uptake was performed to evaluate the internalization efficacy of 99mTc–Tf–DTPA–Gd for tumor cells. The 4T1 cells were placed into 24-well plates at a density of approximately 5 × 10⁵ cells per well, and cultured in a cell incubator at 37 °C and 5% CO2. After incubation for 24 h, the cells were washed 3 times with 1× PBS. 99mTc–Tf–DTPA–Gd at a radioactivity of 5 μCi (0.185 MBq) per well was added, and used as experiment group. For the blocking group, 100 μg of unlabeled transferrin was added to the well 30 min prior to the addition of 99mTc–Tf–DTPA–Gd. 99mTc-pertechenetate was used as control. The cells without any radioactivity were used for background rejection. The total volume of each well was 500 μL. Three replicate wells were established for each sample. After incubation for 5 min, 15 min, 30 min, 60 min, 90 min and 120 min, the supernatant was removed, and the cells were rinsed 3 times with cold PBS containing 0.5% BSA, lysed by 500 μL of 0.1 mol L−1 NaOH and collected into a plastic test tube. The radioactivity in each tube was measured using a γ counter.The cellular uptake rate was calculated as following equation:
| Cellular uptake rate (%) = (Ra − Rb)/Rt × 100%, |
Blood clearance of 99mTc–Tf–DTPA–Gd
To investigate the blood clearance25,26 of 99mTc–Tf–DTPA–Gd in vivo, blood was collected from female KM mice through the tail vein using heparinized capillary tube. Blood was harvested at 1, 3, 5, 7, 10, 15, 30, 60, 180, 300, 420, and 600 min after injection of 0.74 MBq (20 μCi) 99mTc–Tf–DTPA–Gd via tail vein (n = 5). The blood was transformed to plastic test tubes, and the radioactivity of blood in each tube was measured using a γ counter. Correction was made for background radiation and physical decay during counting. The amount of radioactivity in the blood at each time point was expressed as percentage injected dose per gram (% ID per g). The blood-clearance curve was fitted using Drug And Statistics version 2.0.Biodistribution studies
Biodistribution studies were conducted to evaluate the uptake of 99mTc–Tf–DTPA–Gd in KM mice. Female KM mice were administered 0.74 MBq (20 μCi) of 99mTc–Tf–DTPA–Gd via intravenous tail vein injection. Mice (n = 3, per time point) were sacrificed at 1, 3, 5, and 7 h post-injection. Blood, tumor, and major organs or tissues were harvested and wet-weighed. The counts per minute of each sample were measured on a γ counter. The tissue uptake measured in units of % ID per g for each sample was calculated.In vivo MR imaging
To directly examine whether Tf–DTPA–Gd can exactly identify the tumor lesion, mice (n = 3) with subcutaneous 4T1 xenografts were tail intravenous injected with Tf–DTPA–Gd at a concentration of 0.05 mmol Gd per kg. Imaging was performed using a Bruker Biospec 7.0 T/20 cm scanner with a 40 mm diameter mouse body volume coil. During the scanning, mice were maintained anesthetization using 2.5% isoflurane/oxygen. Breathe was monitored and breathing rate was kept 20–30 times per minute by changing the ratio of isoflurane/oxygen. T1-weighted images were acquired with the following parameters: TR = 400 ms, TE = 8.02 ms, slice thickness = 1.00 mm, FOV = 35 × 25 mm, matrix size = 256 × 256, and number of averages = 3. T1 maps were acquired with the following parameters: TE = 8.02 ms, number of T1 experiments with repetition time (TR) = 500, 1000, 1500, 2000, 3000 ms, slice thickness = 1.00 mm, FOV = 35 × 25 mm, matrix size = 192 × 192, and number of averages = 1. Scans were completed before injection and 5, 30 min, 1, 3, 5, 7 and 24 h after injection. Magnevist was used as control.Image reconstruction and analysis were performed using ParaVision 6.0 (Bruker, Germany). For quantitative analysis of MR images, the average MR T1 relaxation times within manually drawn regions of interest (ROIs) for tumors were measured. The MR signal intensities (SI) of each tumor were also measured using Image J (NIH, USA). The relative signal enhancement was then calculated as the quotient of the SI in the post-contrast image and the pre-contrast image.
In vivo SPECT/CT imaging
In vivo SPECT/CT scans and image analysis were performed using a Mediso nanoScan SPECT/CT (Bioscan, USA). Each 4T1 tumor-bearing mouse (n = 3) was injected with 22.2 MBq (600 μCi) of 99mTc–Tf–DTPA–Gd via tail vein. For blocking experiment, 1 mg of unlabeled transferrin was injected into the tail veins of each tumor-bearing mouse (n = 3) 1 h prior to the injection of 99mTc–Tf–DTPA–Gd. Each nude mouse was placed into an induction chamber prior to imaging, and the mice were anesthetized with 5% isoflurane. At 1 h, 3 h, 5 h, and 7 h after the injection of 99mTc–Tf–DTPA–Gd, the raw images were acquired, and the reconstructed images were accomplished using InVivoScope (Bioscan, USA).After SPECT/CT imaging, the mice were sacrificed, and the tumors were dissected, and wet-weighed in plastic test tubes. The radioactivity of each tumor in tube was measured using a γ counter. The mean activities were used to obtain the % ID per g for each tumor.
Statistical analysis
Data were presented as the mean ± SD, and statistical analysis was performed by one-way analysis of variance (ANOVA) followed by Tukey–Kramer Multiple Comparisons Test using GraphPad Prism 6. A p value of less than 0.05 was considered statistically significant.Results
MALDI-TOF MS
Representative spectra of transferrin and Tf–DTPA–Gd were shown in Fig. 1. The average mass observed for transferrin was 79![[thin space (1/6-em)]](https://www.rsc.org/images/entities/char_2009.gif) 095.57 Da (Fig. 1A), close to the previous reports (79
095.57 Da (Fig. 1A), close to the previous reports (79![[thin space (1/6-em)]](https://www.rsc.org/images/entities/char_2009.gif) 246 Da).27,28 The molecular weight of Tf–DTPA–Gd was 89
246 Da).27,28 The molecular weight of Tf–DTPA–Gd was 89![[thin space (1/6-em)]](https://www.rsc.org/images/entities/char_2009.gif) 247.36 Da (Fig. 1B), which is 10
247.36 Da (Fig. 1B), which is 10![[thin space (1/6-em)]](https://www.rsc.org/images/entities/char_2009.gif) 151.79 Da more than that of transferrin alone. The result confirms that DTPA and Gd were successfully chelated to transferrin.
151.79 Da more than that of transferrin alone. The result confirms that DTPA and Gd were successfully chelated to transferrin.
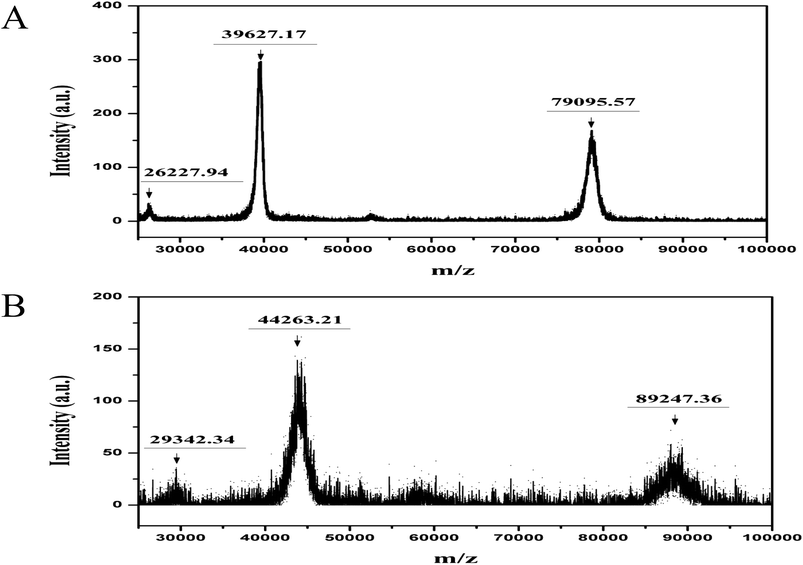 | ||
| Fig. 1 MALDI-TOF MS spectra of transferrin (A) and Tf–DTPA–Gd (B) using sinapinic acid as the matrix detected in positive mode. | ||
Relaxivity measurements
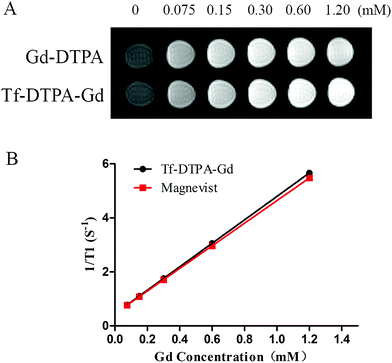
To further characterize the synthesized Tf–DTPA–Gd probe, we utilized ICP-AES and in vitro T1-weighted MR imaging to determine the number of Gd ions incorporated into transferrin and the relaxation rate (Fig. 2). According to the quantity measured by ICP-AES, there were 26 Gd ions per protein for 4 mg of GdCl3 group and 31 Gd ions per protein for 20 mg of GdCl3 group. The amount of DTPA was 31 molecules per protein, and we utilized 26 of them for chelating Gd ions, the rest 5 of them for labeling 99mTc. The Gd-loaded proteins were evaluated for their capacity to alter the relaxation rate of water using a Bruker Biospec 7.0 T/20 cm scanner. The relaxivity was calculated as the slope of the curves 1/T1 versus Gd concentration (Fig. 2B). The calculated r1 relaxivity value of Tf–DTPA–Gd was 4.34 mM−1 s−1 per Gd, while that of Gd–DTPA was 4.19 mM−1 s−1.In vitro cytotoxicity of Tf–DTPA–Gd
The in vitro cytotoxicity of Tf–DTPA–Gd was examined in 4T1 cells (Fig. 3). Cells were treated with Tf–DTPA–Gd at various doses for 12 h, 24 h, or 48 h, respectively, and the viability of the resulting cells was measured using CCK-8 kit. No notable cytotoxicity was observed even at dose of 4000 μg mL−1 of Tf–DTPA–Gd after 48 h of incubation, suggesting Tf–DTPA–Gd is a safe probe and can be applied to cells as transferrin does.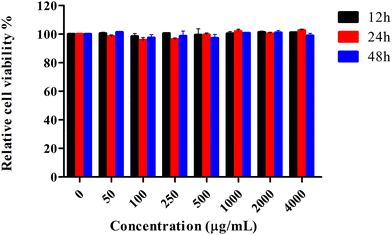 | ||
| Fig. 3 In vitro cytotoxicity of Tf–DTPA–Gd. Relative viabilities of 4T1 cells were measured after being incubated with various concentrations of Tf–DTPA–Gd for 12 h, 24 h, and 48 h. | ||
Radiolabeling
The final labeling rate of 99mTc–Tf–DTPA–Gd was approximately 96%, and the radiochemical purity was greater than 96%. The stability in 50% fetal bovine serum at 37 °C showed 95.96%, 93.32%, 92.82%, 92.11%, 90.51% of intact protein at 0, 2, 4, 6, 8 h, respectively.Saturation curve
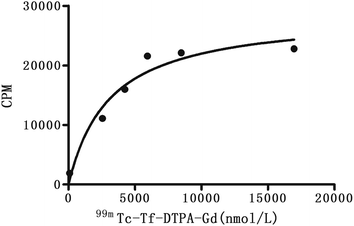
In vitro binding assay was performed to assess the affinity of 99mTc–Tf–DTPA–Gd. Saturation curve (Fig. 4) was fitted by GraphPad Prism 6. The equilibrium dissociation constant Kd for binding between 99mTc–Tf–DTPA–Gd and the transferrin receptor of 4T1 cells was calculated to be 3120 ± 600.6 nmol L−1, and the maximum binding constant Bmax was determined to be (2.88 ± 0.18) × 104.Competition binding curve
The competitive binding assay with 99mTc–Tf–DTPA–Gd was carried out to describe the binding of transferrin and 99mTc–Tf–DTPA–Gd to this receptor, and the competitive binding curve (Fig. 5) was drawn using GraphPad Prism 6. The IC50 value representing the half-inhibition concentration for the inhibition of 99mTc–Tf–DTPA–Gd by transferrin was calculated to be 23.46 ± 1.36 nmol L−1.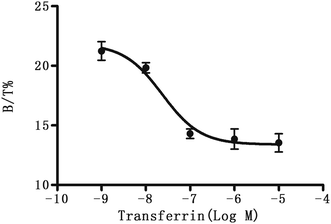 | ||
| Fig. 5 Competitive binding curve. The half-inhibition concentration (IC50) of transferrin for the inhibition of 99mTc–Tf–DTPA–Gd was 23.46 ± 1.36 nmol L−1. | ||
Cellular uptake of 99mTc–Tf–DTPA–Gd
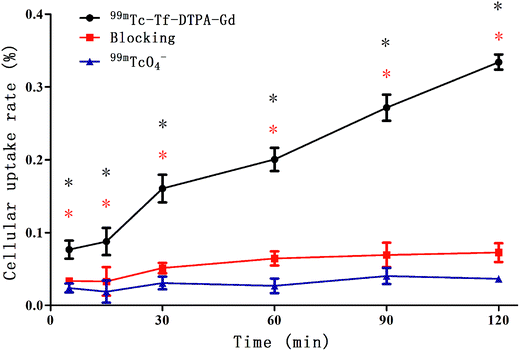
To evaluate the internalization efficacy of 99mTc–Tf–DTPA–Gd for tumor cells, cellular uptake was carried out in 4T1 cells for various time points. As showed in Fig. 6, there was higher radioactivity uptake for experiment group than that for blocking and control group, which showed significant statistical difference (p < 0.001). The radioactivity uptake was increased over time in experiment group. With the pre-incubation of unlabeled transferrin, the blocking group significantly decreased the uptake of 99mTc–Tf–DTPA–Gd, and the radioactivity uptake increased inconspicuously over time.Blood clearance of 99mTc–Tf–DTPA–Gd
The blood radioactivity of 99mTc–Tf–DTPA–Gd was assessed at different time points, and the clearance of radioactivity from blood was showed as a biphasic clearance curve (Fig. 7). Assays of blood samples indicated that 99mTc–Tf–DTPA–Gd was rapidly cleared from the blood. The mean calculated half-lives were 6.12 and 69.32 minutes.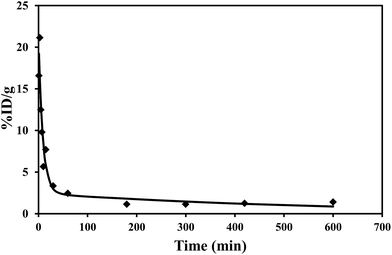 | ||
| Fig. 7 Blood clearance. This figure illustrates the mean blood clearance of 99mTc–Tf–DTPA–Gd over 10 h obtained from serial blood samples. | ||
Biodistribution
Biodistribution studies were performed in female KM mice. The mice were injected intravenously with 99mTc–Tf–DTPA–Gd. The tissue uptake data of 99mTc–Tf–DTPA–Gd was presented in Table 1 as a percent of the injected dose per gram tissue (% ID per g). The liver and spleen tissues had high proportions of radioactivity, which indicates that the probe is cleared primarily through the reticuloendothelial system. High radioactivity was also found in kidneys, which suggests the probe is also renal clearable.| Organ | % IDa per g (n = 3) | ||||
|---|---|---|---|---|---|
| 1 h | 3 h | 5 h | 7 h | 12 h | |
| a Data are expressed as the mean ± one standard deviation (S.D.). | |||||
| Blood | 3.29 ± 0.31 | 1.56 ± 0.42 | 0.84 ± 0.04 | 0.59 ± 0.03 | 0.38 ± 0.02 |
| Heart | 1.42 ± 0.11 | 1.23 ± 0.17 | 0.87 ± 0.03 | 0.73 ± 0.02 | 0.55 ± 0.11 |
| Lungs | 2.10 ± 0.09 | 1.47 ± 0.23 | 1.15 ± 0.10 | 1.06 ± 0.13 | 0.89 ± 0.17 |
| Liver | 29.54 ± 6.90 | 29.52 ± 6.25 | 26.27 ± 5.27 | 21.73 ± 2.74 | 15.72 ± 4.12 |
| Spleen | 23.54 ± 2.97 | 22.55 ± 5.43 | 14.19 ± 1.95 | 13.18 ± 2.23 | 8.95 ± 3.28 |
| Pancreas | 0.45 ± 0.05 | 0.40 ± 0.03 | 0.30 ± 0.06 | 0.25 ± 0.02 | 0.20 ± 0.90 |
| Stomach | 0.80 ± 0.13 | 0.85 ± 0.31 | 0.68 ± 0.06 | 0.55 ± 0.03 | 0.54 ± 0.05 |
| Intestines | 1.44 ± 0.75 | 1.26 ± 0.70 | 0.58 ± 0.04 | 0.50 ± 0.06 | 0.29 ± 0.09 |
| Kidneys | 13.45 ± 2.39 | 11.86 ± 2.36 | 10.93 ± 0.40 | 8.72 ± 0.82 | 4.83 ± 0.42 |
| Bladder | 1.84 ± 0.68 | 0.99 ± 0.25 | 0.79 ± 0.05 | 0.97 ± 0.11 | 0.45 ± 0.16 |
| Brain | 0.22 ± 0.04 | 0.17 ± 0.01 | 0.13 ± 0.03 | 0.10 ± 0.01 | 0.11 ± 0.03 |
| Muscle | 0.30 ± 0.05 | 0.28 ± 0.09 | 0.18 ± 0.01 | 0.18 ± 0.01 | 0.15 ± 0.03 |
| Bone | 5.48 ± 2.16 | 5.62 ± 1.43 | 4.38 ± 0.18 | 3.96 ± 0.35 | 2.39 ± 0.26 |
In vivo MR imaging
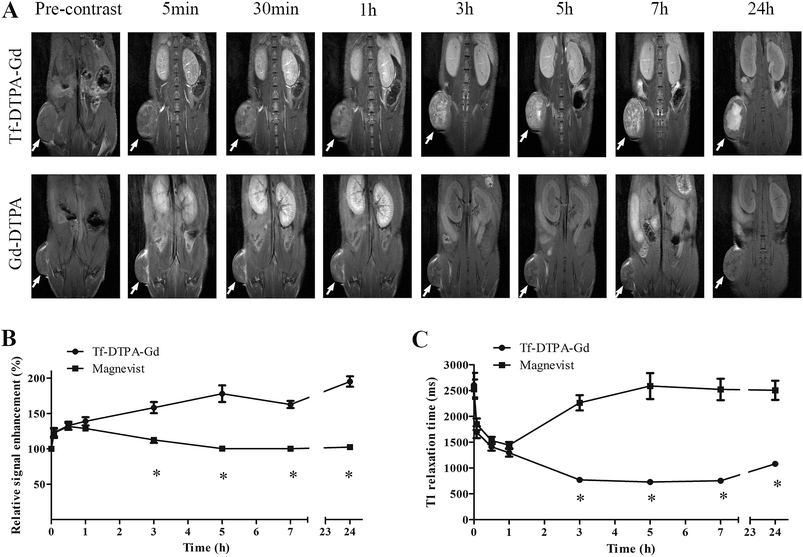
To examine whether Tf–DTPA–Gd can be used as a tumor specific MR contrast agent, coronal MR images (Fig. 8A) were acquired pre-contrast and at various time after administration with Tf–DTPA–Gd and Magnevist (0.05 mmol Gd per kg). In the pre-contrast image, the signal in subcutaneous 4T1 tumor lesion was little difference with that of surrounding muscle or organs. Five minutes after the tail intravenous injection of Tf–DTPA–Gd, the signal in tumor appeared hyper. With the passage of time, the signal in tumor lesion enhanced gradually. And the obvious contrast between tumor and surrounding muscle was maintained until 24 h. In mice treated with Gd–DTPA, the signal of tumor lesion was fast increased but faded rapidly. Three hours after injection, the signal in tumor recovered to the level of pre-contrast. For quantitative analysis of the images, the relative signal enhancement (Fig. 8B) and T1 relaxation times (Fig. 8C) were measured. At the first one hour, the relative tumor signal enhancement by Tf–DTPA–Gd was just a little higher than that of Gd–DTPA. Strikingly, three hours later, it showed significant difference of signal between the two groups. The relative signal enhancement by Tf–DTPA–Gd achieved at the maximum of 178.05% at 5 h, and then decreased to 162.83% at 7 h. In addition, the signal enhancement by Tf–DTPA–Gd could last a longer time, and the relative signal enhancement arrived at the maximum again of 195.25% at 24 h. However, for mice treated with Gd–DTPA, the relative signal enhancement at the maximum of 131.75% maintained for the first 30 min and then disappeared. The T1 relaxation times showed the same trend as the relative signal enhancement causing by the two contrast agents in addition to the last time point, which may be caused by the receiver automatically gaining.In vivo SPECT/CT imaging
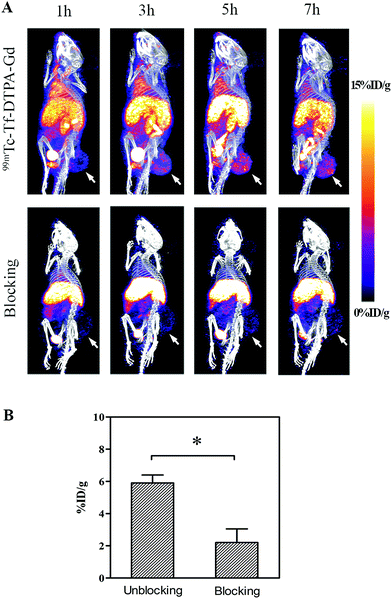
To further investigate the tumor-targeted performance of Tf–DTPA–Gd after radiolabeling with 99mTc, small-animal SPECT/CT images using the established 4T1 model were acquired at various times after administration with 99mTc–Tf–DTPA–Gd. As showed in Fig. 9A, the tumor was clearly visible at 1 h after the injection of 99mTc–Tf–DTPA–Gd. The image of the tumor was clearest at 5 h after this injection, but started fading by 7 h after the injection. As the control, the tumor of blocking group was not clear at 1 h after the injection of 99mTc–Tf–DTPA–Gd. And the radioactivity uptake of the tumor was only a little increased at 5 h after injection. The radioactivity of the tumor site maintained at low levels during the whole experiment. The % ID per g of the tumor of the blocking group at 7 h were 2.20, while that of 99mTc–Tf–DTPA–Gd group were 5.90 (Fig. 9B), which showed significant statistical difference (p < 0.001). In addition, images of the liver, kidneys, spleen, intestine and bladder were visible to various degrees in the images, although radioactivity remained at low levels in the muscle tissue throughout the experiment.Discussion
In current study, we designed and constructed 99mTc–Tf–DTPA–Gd as a dual-modal probe for in vivo target-specific T1-weighted contrast-enhanced MR imaging, and SPECT imaging of tumors based on transferrin receptor, which could provide high-spatial-resolution anatomic information and early stage information of breast tumors with the specific targeting capability.Macromolercular proteins have been reported as carries to load Gd for higher r1 relaxivity and enhance the signal contrast of MRI contrast agent with surrounding tissues in vivo.12,13 In this study, we successfully chelated Gd to transferrin (MW = 76–81 kDa) by coupling DTPA, which was verified by MALDI-TOF MS, ICP-AES and in vitro T1-weighted MR imaging. The r1 relaxivity value per Gd was 4.34 mM−1 s−1 for Tf–DTPA–Gd, which is similar to the r1 relaxivity value of HSA-Gd-IR825 (4.82 mM−1 s−1) reported by Qian Chen et al.12 Tf–DTPA–Gd showed almost no cytotoxicity in vitro. Moreover, we didn't observe that the mice displayed any obvious discomfort after the injection of Tf–DTPA–Gd. To achieve the dual-modal probe, we didn't chelate all the DTPA which is covalently bonded to transferrin with Gd that we could radiolabel Tf–DTPA–Gd with 99mTc using stannous chloride reduction method. The assay of ITLC showed Tf–DTPA–Gd is stable in 50% fetal bovine serum. Therefore, these results indicated that 99mTc–Tf–DTPA–Gd can be used as an ideal SPECT/MRI dual-modal probe.
Transferrin receptor is highly expressed in many malignant tumor cells including breast cancer cells, and has been used as a target for imaging probes29–31 to detect tumors. Walker et al.32 found that TfR was expressed on breast cancer cells at levels approximately 5 times higher than those of normal cells. TfR antisense oligonucleotides effectively suppressed the growth of 4T1 tumors,33 indicating the expression of TfR on 4T1 breast cancer cells. In our study, we found the amount of TfR expressed on 4T1 cells was (2.88 ± 0.18) × 104. However, the value of Kd for binding between 99mTc–Tf–DTPA–Gd and the transferrin receptor of 4T1 cells was a little high. It may be that the coupling process of our probe has a little impact on the binding sites of transferrin. Nevertheless, our dual-modal probe showed the great target property in vivo.
Small molecules like Gd chelates accumulate in tumor vessels primarily via passive enhanced permeation and retention (EPR) effect, sustain in extracellular space and are excreted rapidly into the blood flow.11,34 These contrast agents mainly depend on features of the poorly formed leaky vessels and very plentiful blood supply in tumor to visualize neoplastic lesion. In our study, after injection of Magnevist the signal intensity in the tumor was enhanced very quickly, reaching the maximum within 30 min and then was rapidly declining because of the elimination of Gd–DTPA. Compared to Magnevist, we observed significant enhancement of 4T1 breast cancer with Tf–DTPA–Gd accumulating in tumor tissues, and owning appropriate signal level, as well as long retention in tumor center up to 24 h post-injection. Tf–DTPA–Gd could reach the tumor cells by the passive EPR effect, then recognize the overexpressed TfR on 4T1 cells and be internalized into the tumor cells via the active receptor-mediated endocytosis with the help of Tf. Therefore it could visualize the tumor tissue specifically and efficiently. Macromolecular contrast agents based on proteins with molecular weight higher than 45 kDa are excreted by renal glomerular filtration slowly, therefore they prolong the retention of Gd ions in the body.35 In our study, there was still obvious enhanced signal in the tumor area after 24 h post-injection with Tf–DTPA–Gd, which indicated that the images using Tf–DTPA–Gd could provide more accurate information about tumor with abundant imaging time.
In SPECT imaging, 99mTc–Tf–DTPA–Gd showed specific targeting to 4T1 breast cancer with high uptake in tumor, which was consistent with MR imaging. The blocking experiment also confirmed the active targeting capacity of 99mTc–Tf–DTPA–Gd to TfR. Meanwhile, high uptake of 99mTc–Tf–DTPA–Gd was observed in liver and spleen. The high liver uptake was caused by the high level of TfR expression on normal liver cells as well as the interaction of the macromolecular material with the Kupffer cells of the liver.13 The distribution of radioactivity in the kidneys remained at high levels throughout the experiments, which demonstrates the renal clearance of our probe. In this study, there was significantly lower radioactivity in the muscle tissues than in the bone. Similar result was also observed in Eun-Mi Kim's research.36
The MR and SPECT images demonstrated that 99mTc–Tf–DTPA–Gd can be detected with both techniques and can be used as dual-modality probe for breast cancer imaging. MR images provide significant anatomic information and favourable soft-tissue contrast, allowing analysis of the size and shape of the tumor, while SPECT has high sensitivity, so that even a small dose (nmol level) of probe can be detected.
Conclusions
In summary, we, for the first time, utilized transferrin as a contrast agent carrier for loading Gd and 99mTc, meanwhile a specific tumor target for diagnosing the breast cancer. The synthesis process of 99mTc–Tf–DTPA–Gd was simple and easy to operate. The synthesized 99mTc–Tf–DTPA–Gd with dual-modality magnetic and radioactive properties could provide high spatial resolution and high sensitivity images of the breast tumor. The work presented here with 99mTc–Tf–DTPA–Gd serves as the foundation for future studies of targeted breast cancer imaging and broad applications of MR and SPECT imaging other tumors with overexpressed TfR as well as assessment of the recurrent tumor after tumor resection and postoperative radiotherapy.Acknowledgements
This work was supported by the grants from the Shanghai Engineering Research Center of Molecular Imaging Probes Program (14DZ2251400).Notes and references
- C. DeSantis, J. Ma, L. Bryan and A. Jemal, Ca-Cancer J. Clin., 2014, 64, 52–62 CrossRef PubMed.
- L. Fan, K. Strasser-Weippl, J.-J. Li, J. St Louis, D. M. Finkelstein, K.-D. Yu, W.-Q. Chen, Z.-M. Shao and P. E. Goss, Lancet Oncol., 2014, 15, e279–e289 CrossRef PubMed.
- T. E. McCann, N. Kosaka, B. Turkbey, M. Mitsunaga, P. L. Choyke and H. Kobayashi, NMR Biomed., 2011, 24, 561–568 Search PubMed.
- R. Weissleder and U. Mahmood, Radiology, 2001, 219, 316–333 CrossRef CAS PubMed.
- D.-E. Lee, H. Koo, I.-C. Sun, J. H. Ryu, K. Kim and I. C. Kwon, Chem. Soc. Rev., 2012, 41, 2656–2672 RSC.
- B. L. Franc, P. D. Acton, C. Mari and B. H. Hasegawa, J. Nucl. Med., 2008, 49, 1651–1663 CrossRef PubMed.
- J. s. Choi, J. C. Park, H. Nah, S. Woo, J. Oh, K. M. Kim, G. J. Cheon, Y. Chang, J. Yoo and J. Cheon, Angew. Chem., Int. Ed., 2008, 47, 6259–6262 CrossRef CAS PubMed.
- J. Lee, T. S. Lee, J. Ryu, S. Hong, M. Kang, K. Im, J. H. Kang, S. M. Lim, S. Park and R. Song, J. Nucl. Med., 2013, 54, 96–103 CrossRef CAS PubMed.
- A. Louie, Chem. Rev., 2010, 110, 3146–3195 CrossRef CAS PubMed.
- R. Madru, P. Kjellman, F. Olsson, K. Wingårdh, C. Ingvar, F. Ståhlberg, J. Olsrud, J. Lätt, S. Fredriksson and L. Knutsson, J. Nucl. Med., 2012, 53, 459–463 CrossRef CAS PubMed.
- P. Caravan, J. J. Ellison, T. J. McMurry and R. B. Lauffer, Chem. Rev., 1999, 99, 2293–2352 CrossRef CAS PubMed.
- Q. Chen, C. Liang, X. Wang, J. He, Y. Li and Z. Liu, Biomaterials, 2014, 35, 9355–9362 CrossRef CAS PubMed.
- W. Watcharin, C. Schmithals, T. Pleli, V. Köberle, H. Korkusuz, F. Huebner, S. Zeuzem, H. W. Korf, T. J. Vogl and C. Rittmeyer, Eur. J. Pharm. Biopharm., 2014, 87, 132–141 CrossRef CAS PubMed.
- T. A. D. Smith and P. H. Walton, Nucl. Med. Commun., 2002, 23, 1085–1090 CrossRef CAS PubMed.
- P. Aisen, Int J Biochem Cell Biol, 2004, 36, 2137–2143 CrossRef CAS PubMed.
- P. T. Gomme, K. B. McCann and J. Bertolini, Drug Discovery Today, 2005, 10, 267–273 CrossRef CAS PubMed.
- A. C. Prost, F. Menegaux, P. Langlois, J. M. Vidal, M. Koulibaly, J. L. Jost, J. J. Duron, J. P. Chigot, P. Vayre and A. Aurengo, Int. J. Oncol., 1998, 13, 871–876 CAS.
- T. R. Daniels, E. Bernabeu, J. A. Rodríguez, S. Patel, M. Kozman, D. A. Chiappetta, E. Holler, J. Y. Ljubimova, G. Helguera and M. L. Penichet, Biochim. Biophys. Acta, Gen. Subj., 2012, 1820, 291–317 CrossRef CAS PubMed.
- M. Evans, J. Holland, J. Lewis and C. Sawyers, J. Nucl. Med., 2012, 53, 111 Search PubMed.
- L. Han, J. Li, S. Huang, R. Huang, S. Liu, X. Hu, P. Yi, D. Shan, X. Wang and H. Lei, Biomaterials, 2011, 32, 2989–2998 CrossRef CAS PubMed.
- K. Abe, L. Zhao, A. Periasamy, X. Intes and M. Barroso, PLoS One, 2013, 8(11), e80269 Search PubMed.
- J.-L. Li, L. Wang, X.-Y. Liu, Z.-P. Zhang, H.-C. Guo, W.-M. Liu and S.-H. Tang, Cancer Lett., 2009, 274, 319–326 CrossRef CAS PubMed.
- C. H. Paik, M. A. Ebbert, P. R. Murphy, C. R. Lassman, R. C. Reba, W. C. Eckelman, K. Y. Pak, J. Powe, Z. Steplewski and H. Koprowski, J. Nucl. Med., 1983, 24, 1158–1163 CAS.
- S. E. Kornguth, P. A. Turski, W. H. Perman, R. Schultz, T. Kalinke, R. Reale and F. Raybaud, J. Neurosurg., 1987, 66, 898–906 CrossRef CAS PubMed.
- G. Johnson 3rd, D. K. Glover, C. B. Hebert and R. D. Okada, Journal of Nuclear Medicine: Official Publication, Society of Nuclear Medicine, 1993, 34, 630–636 CAS.
- C. Van de Wiele, F. Dumont, R. A. Dierckx, S. H. Peers, J. R. Thornback, G. Slegers and H. Thierens, J. Nucl. Med., 2001, 42, 1722–1727 CAS.
- M. E. del Castillo Busto, M. Montes-Bayón, E. Blanco-González, J. Meija and A. Sanz-Medel, Anal. Chem., 2005, 77, 5615–5621 CrossRef CAS PubMed.
- M. Grebe, D. Profrock, A. Kakuschke, J. A. C. Broekaert and A. Prange, Metallomics, 2010, 2, 683–693 RSC.
- M. J. Evans, J. P. Holland, S. L. Rice, M. G. Doran, S. M. Cheal, C. Campos, S. D. Carlin, I. K. Mellinghoff, C. L. Sawyers and J. S. Lewis, J. Nucl. Med., 2013, 54, 90–95 CrossRef CAS PubMed.
- W. Jiang, H. Xie, D. Ghoorah, Y. Shang, H. Shi, F. Liu, X. Yang and H. Xu, PloS one, 2012, 7, e37376 CAS.
- L.-C. Wu, L.-W. Chu, L.-W. Lo, Y.-C. Liao, Y.-C. Wang and C.-S. Yang, ACS Nano, 2012, 7, 365–375 CrossRef PubMed.
- R. A. Walker and S. J. Day, J. Pathol., 1986, 148, 217–224 CrossRef CAS PubMed.
- X. P. Jiang, R. L. Elliott and J. F. Head, Anticancer Res., 2010, 30, 759–765 CAS.
- H. Maeda, T. Sawa and T. Konno, J. Controlled Release, 2001, 74, 47–61 CrossRef CAS PubMed.
- T. Ke, Y. Feng, J. Guo, D. L. Parker and Z.-R. Lu, Magn. Reson. Imaging, 2006, 24, 931–940 CrossRef CAS PubMed.
- E.-M. Kim, H.-J. Jeong, S.-L. Kim, C.-M. Lee, D. W. Kim, S. T. Lim and M. H. Sohn, J. Drug Targeting, 2007, 15, 595–602 CrossRef CAS PubMed.
| This journal is © The Royal Society of Chemistry 2016 |

