SERS-based immunoassay using a core–shell SiO2@Ag immune probe and Ag-decorated NiCo2O4 nanorods immune substrate
Xiaolong Wanga,
Lu Zhoua,
Guodong Weib,
Tao Jiang*a and
Jun Zhou*a
aInstitute of Photonics, Faculty of Science, Ningbo University, Ningbo, 315211, Zhejiang, China. E-mail: jiangtao@nbu.edu.cn; zhoujun@nbu.edu.cn; Fax: +86-574-87600744; Tel: +86-574-87600794
bCollege of Physics, Jilin University, Changchun, 130012, Jilin, China
First published on 17th December 2015
Abstract
An immunoassay with high sensitivity based on surface enhanced Raman scattering (SERS) was realized by using a SiO2@Ag immune probe and Ag-decorated NiCo2O4 nanorods (NNRs) immune substrate. The SiO2@Ag immune probe was prepared by immobilizing Raman reporter molecules and anti-alpha fetoprotein (AFP) onto the SiO2@Ag hybrid structure. It was discovered that SiO2 colloidal microspheres attached with an appropriate amount of Ag nanoparticles (NPs) maintained the highest SERS intensity. Nanogaps between adjacent Ag NPs were proved to be the primary “hot spots” responsible for the significant Raman enhancement. Then, the immune substrate was synthesized by magnetron sputtering Ag NPs onto a NNRs coated carbon fiber cloth and linking them with anti-AFP. Such a novel substrate exhibited strong SERS activity and excellent reproducibility, due to the large amount of homogeneous Ag aggregates on the one-dimensional NNRs. Finally, a sandwich structure consisting of the SiO2@Ag immune probe and the Ag-decorated NNRs substrate was used to detect AFP and a detection limit as low as 2.1 fg mL−1 was obtained. It is imagined that the proposed strategy will show great advantages in sensitive immunoassays.
1 Introduction
In recent years, enormous attention has been paid to immunoassay research, which plays an important role in the fields of clinical diagnostics, drug discovery, food safety and environmental monitoring.1–4 Two typical conventional immunoassay methods are the enzyme-linked immunosorbent assay (ELISA) and fluorescence-based method.5,6 However, the complex experimental strategy of ELISA and the nearly impossible multiplex detection of the fluorescence-based method have blocked their further progress in rapid and sensitive disease examination.7–9 Compared to these two methods, the surface enhanced Raman scattering (SERS)-based immunoassay has gained significant interest due to its advantageous features like ultrahigh sensitivity, chemical specificity, no photobleaching, narrow spectral bandwidth, multiplex detection capability and single excitation wavelength.10–12 As a consequence, SERS-based immunoassays have been practically applied in detecting tumor markers such as α-fetoprotein, carcinoembryonic antigen, prostate-specific antigen (PSA) and alpha fetoprotein (AFP).13–15 Nowadays, further increase of the sensitivity has become a crucial aspect in these immune detections.A sandwich structure, which contains immune probe, target antigen and antibody immobilized substrate is generally utilized in immunoassay. Consequently, the sensitivity of SERS-based immunoassay is significantly bound up with the probe and the substrate. To get a preferable probe, many researchers have focused on preparing novel noble metal nanostructures with large curvity including nanostars, nanocubes, nanorods and nanoflowers to establish intense electromagnetic fields.16–19 Nevertheless, these novel nanostructures are usually instable and prone to coalesce due to their high activity, which can lead to a deactivation in their practical utilizations. Moreover, to exactly adjust the shape of these nanostructures is always difficult. One solution to these problems is the incorporation of Ag nanoparticles (NPs) onto SiO2 colloidal microspheres to form core–shell structures. On the one hand, the long-term stability and homogeneity of the Ag NPs can be guaranteed, which is significant in the practical immune application. On the other hand, the roughness of the hybrid structure is controllable by adjusting the synthesis condition. An optimal aggregation degree of Ag NPs on SiO2 microspheres can be easily obtained to realize strong SERS activity.20–22
With regard to the substrate, a variety of hybrid substrates such as Ag-decorated ZnO nanoflowers, Ag-attached porous ZnO nanosheets and Ag-coated TiO2 nanoporous have been extensively developed due to their high SERS activity and easy physical or chemical deposition technology.23–25 Nevertheless, it is still highly desirable for economic assays to design brighter SERS substrates that combine facile and versatile synthesis with high stability. Accordingly, as a new class of SERS substrates, one dimensional NiCo2O4 nanorods (NNRs) can provide not only large flat surface area for the formation of homogeneous Ag deposition with small nanogaps, but also tiny tips for the enrichment of Ag aggregates.26,27 As it is known, intense electromagnetic fields will exhibit near these nanogaps and aggregates to form the so-called “hot spots” under laser excitation. Therefore, both stability and sensibility of SERS signals will be much improved. However, it has been scarcely reported that such novel one dimensional NNRs with a uniform orientation was adopted as an alternative SERS substrate.28
In this work, we carried out a SERS-based immunoassay combined with immune SiO2@Ag microspheres and Ag-decorated NNRs. A variety of SiO2 microspheres coated with different amount of Ag NPs were synthesized by a simple hydrothermal method and their SERS activities were investigated by using 4-mercaptobenzoic acid (4MBA) as Raman report molecules. Then, Ag-decorated NNRs on carbon fiber cloth (CFC) was prepared by magnetron sputtering and its higher Raman scattering enhancement efficiency than the Ag-coated bare CFC was demonstrated. Finally, a sandwich immune strategy based on the above two hybrid structures was applied to detect AFP and a limitation as low as 2.1 fg mL−1 was observed.
2 Experimental
2.1 Chemicals
Tetraethoxysilane (TEOS, 99%), poly(vinyl pyrrolidone) (PVP, K30), ammonia aqueous (28%), ethanol (99.5%), tetrahydrofuran (99.9%) and silver nitrate (AgNO3, 99.5%) were purchased from Sinopharm Chemical Reagent Co., Ltd. Nickel nitrate (Ni(NO3)2·6H2O) and cobalt nitrate (Co(NO3)2·6H2O) were purchased from Shanghai Chemical Reagent Co., Ltd. NH4F (99%) and Co(NH2)2 (99%) were purchased from Jiangsu Powerful Functional Co., Ltd. 4MBA was obtained from J&K Scientific Ltd. Phosphate buffered saline (PBS, pH = 7), tris-buffered saline (TBS, pH = 7.6), and TBS/0.05% Tween buffer solution (0.05 M Tris, 0.138 M NaCl, 0.0027 M KCl, 0.05% Tween 20, pH = 8) were purchased from Sigma-Aldrich. AFP, anti-AFP, PSA, and ApoB were obtained from Ningbo Rui Biotechnology Co. Ltd. Bovine serum albumin (BSA) was purchased from Nanjing Sunshine Biotechnology Co. Ltd. Milli-Q water (18.2 MΩ) was used throughout the whole experiment.2.2 Synthesis of the 4MBA-labelled immune SiO2@Ag microspheres
Firstly, the SiO2 microspheres were prepared via the facile Stöber method.29 In the following coating experiment, different amount of AgNO3 was first dissolved into a mixed solution of 2 mL water and 0.2 mL ammonia, and 1 g PVP was added into 13 mL SiO2 (1.9 M) ethanol solution. The above two solutions were then mixed together and transferred to a 20 mL autoclave, sealed and maintained at 120 °C for 12 h. After the autoclave was cooled to room temperature naturally, the resulting samples were separated by centrifugation at 5000 rpm for 2 min, washed with deionized water, ethanol, tetrahydrofuran and stored in ethanol for further experiments. Secondly, 4MBA-labelled SiO2@Ag microspheres were prepared as follows: 20 μL of 4MBA (1 mM) ethanol solution was added to 5 mL of the purified SiO2@Ag microspheres solution under stirring and agitated for 12 h at room temperature. Then, the unbound 4MBA molecules were removed by centrifugation, and the result samples were redissolved in 1 mL of PBS solution under ultrasonic oscillation. Thirdly, the anti-AFP was immobilized on the 4MBA-labelled SiO2@Ag microspheres via static and hydrophobic interactions.30 20 μL of anti-AFP PBS solution (2 mg mL−1) was added to 1 mL of the 4MBA-labelled SiO2@Ag microspheres solution and incubated at 4 °C for 1.5 h. Subsequently, the excess anti-AFP in the mixture was removed by centrifugation. After that, a blocking solution (3% BSA in PBS solution) was added to the above mixed solution to shield the bare sites on the surfaces of SiO2@Ag microspheres. After incubation at room temperature for 1 h, the mixture was washed twice by centrifugation to remove the excess BSA. The sediment was dissolved in 1 mL of PBS solution under ultrasonic oscillation again, and the 4MBA-labelled immune SiO2@Ag microspheres probes were finally obtained.2.3 Preparation of the SERS-active immune substrate
Firstly, NNRs were synthesized on CFC by a simple hydrothermal method according to the literature.27 Secondly, Ag NPs were coated onto the as-synthesized NNRs by sputtering an Ag target (99.99%) with a radio-frequency magnetron sputtering system operated at 0.5 Pa in an ambient of Ar. The sputtering power was 50 W, which led to a 12 nm min−1 deposition rate. The sputtering deposition was carried out at room temperature. Finally, the obtained Ag-decorated NNRs were carefully dipped in 20 μL of anti-AFP PBS solution (2 mg mL−1) and incubated at 4 °C for more than 12 h to modify the antibodies onto the substrate. The antibody-modified substrate was then washed successively with TBS/0.05% Tween 20 buffer solution, TBS, and deionized water to remove any residual protein from its surface, and dried in a gentle flow of argon gas. Next, the antibody-modified substrate was blocked by BSA solution for 3 h at room temperature, and the SERS-active immune substrate was washed again to remove the residual BSA and dried by argon gas. After these processes, the obtained SERS-active immune substrate was stored at 4 °C for further test.2.4 Sandwich immunoassay
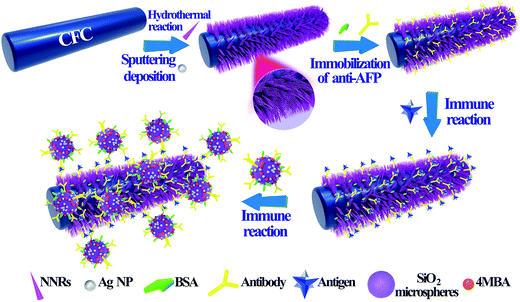
The AFP sandwich assay was performed in the principle of antigen and antibody interactions. 20 μL of AFP solution with different concentration was dropped homogeneously onto the prepared SERS-active immune substrate and incubated at 37 °C for 2 h to promote the immune reactions between anti-AFP and AFP. The SERS-active immune substrate was then washed with buffer solution and deionized water to remove the residual antigen that was not captured by the antibody. Next, the substrate was covered with 20 μL of 4MBA-labelled immune SiO2@Ag microspheres solution and incubated at 37 °C for 2 h. After being washed with buffer solution and deionized water again to remove the unbound SERS probes, the substrates were dried by argon gas and stored at 4 °C before SERS measurements. The process to fabricate the typical protocol is illustrated in Scheme 1.2.5 Instruments
Scanning electron microscopy (SEM) (SU-70, Hitachi) and transmission electron microscopy (TEM) (Tecnai G2 F20, FEI) was utilized to characterize the morphologies of the products. UV-Vis spectrometer (TU-1901, Pgeneral) was used to monitor the absorption properties of the prepared samples. The phase structures of the products were identified by X-ray diffraction (XRD) patterns using a Model Rigaku Ru-200b powder diffractometer with nickel-filtered Cu-Ka radiation (λ = 1.5406 Å). The SERS properties of the samples were examined by a miniature Raman spectrometer (BWS415, B&W Tek Inc.) using a 785 nm semiconductor laser as the excitation source. The specifications of the Raman spectrometer were set as follows: the laser power at the sample position was 49.55 mW and the accumulation time was 10 s; the scattered radiation was collected by a 40× objective lens with a numerical aperture (NA) of 0.65 and dispersed by the grating of 1200 lines per mm, and then passed through a slit with 20 μm width to the charge-coupled device (CCD, 2048 × 2048 pixels) detector. All the analysis was performed at room temperature.3 Results and discussion
3.1 Characterization of the 4MBA-labelled immune SiO2@Ag microspheres
The morphologies of the products were investigated by SEM and TEM. As illustrated in Fig. 1a, monodispersed SiO2 microspheres exhibit a uniform shape and smooth surfaces with diameters of about 440 ± 30 nm. After Ag coating, almost all the particles still maintain similar spherical profiles with a little larger average diameter of about 480 ± 20 nm. However, they exhibit highly rough surfaces consisting of many irregular but homogeneously arranged Ag protrusions as shown in Fig. 1b. The size of these Ag protrusions was identified as 5 to 50 nm and the distance between adjacent ones was discerned to be 5 to 20 nm. The smooth surfaces of the bare SiO2 microspheres and the core–shell structure of the Ag-coated microspheres were further confirmed by the TEM images in Fig. 1c and d. The tiny protrusions of the Ag NPs were clearly observed from the magnified TEM image in Fig. 1e. The lattice fringes of the Ag NPs shown in the HRTEM image (Fig. 1f) indicate the high crystalline of these Ag NPs, and the measured lattice spacing of 0.203 nm is consistent with the d-spacing of the (200) plane of the face-centered-cubic Ag crystal. Then, the chemical compositions of the two samples were analyzed by the EDS under SEM as provided in Fig. 2a. Besides the peaks of element Al from the substrates, the peaks of O and Si are dominant in the two spectra with a molar ratio of 2, indicating the high quality of the as-prepared SiO2 microspheres. In the EDS of the coated sample, the appearance of Ag peaks indicates the successful modification of Ag NPs. The XRD patterns of the two samples are displayed in Fig. 2b. The broad band at around 23° show the amorphous phase of the SiO2 microspheres, while a set of well defined diffraction peaks in the second pattern depict the crystalline nature of the coated Ag. The observed diffraction peaks at two theta (2θ) values of 38.28°, 44.29°, 64.55° and 77.71° can be assigned to the (111), (200), (220) and (311) planes of the face-centered-cubic Ag. All the above analyses thus reveal the formation of a binary structure consisting of SiO2 and Ag.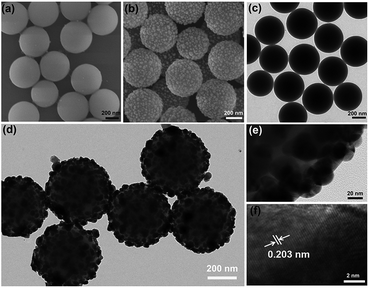 | ||
| Fig. 1 (a and b) SEM images, (c–e) TEM images and (f) HRTEM image of SiO2 microspheres and SiO2@Ag microspheres synthesized with 0.04 M AgNO3. | ||
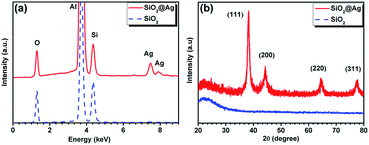 | ||
| Fig. 2 (a) EDS spectra and (b) XRD spectra of SiO2 microspheres and SiO2@Ag microspheres synthesized with 0.04 M AgNO3. | ||
In order to explore the optimal coating amount of Ag in the hybrid structure for the best SERS property, the concentration of AgNO3 in precursor solution was adjusted from 0.005, 0.02 and 0.04 to 0.06 M in our experiment. The morphological evolution of these samples was examined using SEM as shown in Fig. 3. As it is clearly seen in Fig. 3a, nearly all the SiO2 microspheres are successfully coated by a small number of Ag NPs when 0.005 M AgNO3 was applied. However, these few Ag NPs with diameters of about 15 ± 5 nm distribute on the surfaces of SiO2 microspheres sparsely. The coated Ag NPs with larger sizes of 25 ± 5 nm and become more with increasing AgNO3 to 0.02 M as shown in Fig. 3b. When the added AgNO3 further increased to 0.04 M, the diameters of the irregular Ag NPs increase to about 50 nm as shown in Fig. 3c. Apparently, these Ag NPs served as seeds for the growth of newly formed Ag NPs, which become larger and denser, and the SiO2 microspheres are finally covered with nearly complete Ag shells. When the concentration of AgNO3 reached 0.06 M, it is interesting to find a significant change of the morphology. The obtained Ag NPs with diameters of about 80 ± 25 nm are much larger than those ones in the above three conditions and the adjacent distances between them become larger again, which could be clearly see in Fig. 3d. This phenomenon is probably due to the fact that too many Ag nuclei tend to coalesce and form aggregates with larger sizes owing to their high activities under the high temperature and pressure of the hydrothermal condition. The UV-Vis spectra were then used to investigate the localized surface plasmon resonance (LSPR) properties of these hybrid microspheres. As depicted in Fig. 4a, the narrow LSPR band of the sample synthesized with 0.005 M AgNO3 locates at around 436 nm. With the increase of AgNO3, the LSPR band shows an obvious red shift and becomes broader. This phenomenon can be attributed to the fact that the coverage degree of Ag NPs on SiO2 microspheres increases and their sizes become larger. The LSPR peak moves to as far as 603 nm with the broadest band from 350 to 700 nm when these Ag NPs eventually coalesce together and form a nearly compact nano-shell on SiO2 microspheres. The further increase of AgNO3 to 0.06 M did not sustain the tendency of such a red shift due to the disassembly of Ag nanoshell and appearance of scattered Ag NPs with much larger sizes. The LSPR band of the sample blue-shifts to 475 nm, finally.
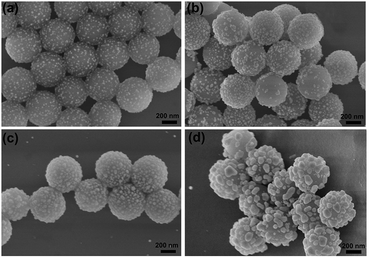 | ||
| Fig. 3 SEM images of SiO2@Ag microspheres synthesized with different amount of AgNO3: (a) 0.005, (b) 0.02, (c) 0.04 and (d) 0.06 M. | ||
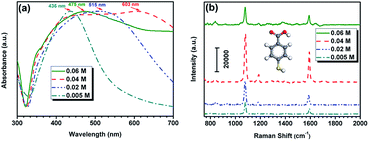 | ||
| Fig. 4 (a) UV-Vis spectra and (b) 4MBA SERS spectra of SiO2@Ag microspheres synthesized with different amount of AgNO3: 0.005, 0.02, 0.04 and 0.06 M. | ||
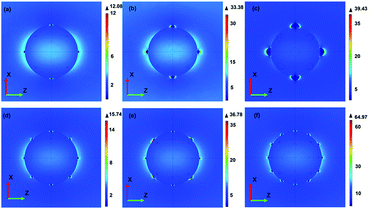
After analysis of the LSPR properties of these SiO2@Ag microspheres, we further evaluated their SERS activities with an excitation wavelength of 785 nm. Such a wavelength was chose because that it locates at the “window of optical transparency” for biological tissues. This window will cause much deeper penetration depth of incident light and relatively smaller damage to the biological sample.31 As illustrated in Fig. 4b, all the samples present characteristic bands of 4MBA with strong intensities, indicating their exceptional SERS enhancement. Although all of them shown the same peak positions and enhanced Raman signals, the peak intensity is obviously different. It can be observed that the SERS intensities of the samples increased first as the increase of Ag NPs in the samples and reached the highest intensity when the incompact nanoshell formed on SiO2 microspheres. And then, the SERS intensities oppositely decreased. The SERS signal intensity at 1076 cm−1 from the sample synthesized with 0.04 M AgNO3 is approximately 1.5 times higher than that from the sample prepared with 0.005 M AgNO3. Such an excellent SERS performance can be attributed to not only the much higher surface roughness but also the large amount of deposited Ag NPs. As shown in the above SEM images, uniform and well-defined interparticle nanogap as small as 5–20 nm has formed between adjacent Ag NPs. Enhanced localized electric field can be imagined to locate around these nanogaps and therefore much more “hot spots” may appear on the surfaces of the samples. Another possible reason for much better SERS performance of the sample synthesized with 0.04 M AgNO3 is the fact that its SPR band is much closer to the excitation wavelength. To better understand the electromagnetic field distribution around the SiO2@Ag microspheres with different Ag sizes and numbers, theoretical calculations were carried out using the three-dimensional finite element method. The diameter of core SiO2 microspheres was set as 440 nm, which was taken from the SEM images. Considering the geometry symmetry, the number of Ag NPs with different diameters of 20, 40 and 80 nm was set as 14 and then the number of Ag NPs with diameter of 20 nm was change to 18, 26 and 38 to simplify our models. The refractive index of the surrounding and the core SiO2 microspheres was set as 1.0 and 1.5, respectively. In the following calculations, light sources with a central wavelength equivalent to 785 nm were incident normally to the surfaces of the models in the x-axis and the polarization of the excitation was along the z-axis. Fig. 5 shows the E-field distributions of these SiO2@Ag models in the x–z plane. It was found that hot SERS-active sites appear mostly around the Ag NPs. We first focus on the effect of Ag size on the electric field distribution. As shown in Fig. 5(a)–(c), larger Ag NPs lead to a progressively larger magnitude of the maximally enhanced electric field. Fig. 5(a) and (d)–(f) further show the effect of Ag number on the electric field distribution. As expected, more Ag NPs generate higher electromagnetic enhancement around the surfaces of the hybrid nanostructures. Both the above two tendencies could be attributed to a stronger plasmonic coupling effect with the growth of Ag NPs in size and number.32 It should be noted that, the maximum electromagnetic field enhancement (|E|/|E0|) of 64.97 in the last model with more small Ag NPs (number: 38, diameter: 20 nm) is larger than that of 39.43 in the third model with less large Ag NPs (number: 14, diameter: 40 nm), which is in consonance with our experimental results. Both the experimental and theoretical results indicate that SiO2@Ag microspheres with an optimal Ag coating are highly desirable for biosensor applications in the “window of optical transparency”. Thus, the SiO2@Ag microspheres synthesized with 0.04 M AgNO3 was used in the following immunoassay.
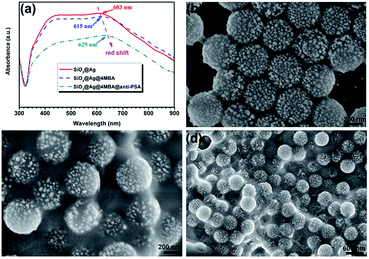
The formation process of the 4MBA-labelled immune SiO2@Ag composite microspheres was then investigated using UV-Vis absorption spectroscopy. Fig. 6a shows the absorption spectra recorded from the pure, the 4MBA-modified, and the 4MBA-labelled immune SiO2@Ag microspheres. The main absorption band of SiO2@Ag microspheres captured with 4MBA red-shifted from 603 to 615 nm corresponding to an increase of their sizes. After the addition of anti-AFP, the absorption peak further red-shifted from 615 to 629 nm as shown in Fig. 6a. This phenomenon indicated that the size of the aggregate further increased due to the successful attachment of anti-AFP onto the 4MBA-labelled SiO2@Ag microspheres. Moreover, the corresponding morphologies of these three samples are displayed in Fig. 1b and 6. As shown in Fig. 1b, the bare SiO2@Ag microspheres exhibit good monodispersity and large interparticle distance. However, after the addition of 4MBA, these microspheres contact to each other tightly and their interparticle distance decreases obviously as shown in Fig. 6b. After the bounding of anti-AFP to the 4MBA-labelled SiO2@Ag microspheres, the aggregation degree of these microspheres increases significantly and they further assemble disorderly instead of the former regular arrangement as shown in Fig. 6c and d.
3.2 Characterization of the SERS-active substrate
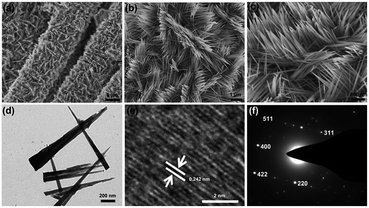
Fig. 7a illustrates the morphology and microstructure of the hydrothermal synthesized NNRs, which show unique interconnected 3D network architecture. High-magnification SEM image (Fig. 7b) shows that these nanorods with uniform shape are diagonally aligned on the CFC. The diameters and lengths of these nanorods are estimated to be 30–200 nm and 2–3 μm. Remarkably, as can be seen from Fig. 7c, they possess flat and smooth surfaces as well as tiny ends, which is benefit for loading additional Ag NPs and generating homogeneous “hot spots”. As can be further discerned from TEM image in Fig. 7d, the long NNRs gradually decrease to only several nanometers at the tips. The HRTEM image of the NNRs shows clear lattice fringes, and the indexed fringe spacing of 0.242 nm is consistent with the interplanar distance of the (311) planes of NNRs (Fig. 7e). The SAED pattern in Fig. 7f shows spotty single crystalline diffraction array corresponding to the (220), (311), (400), (422) and (511) planes of the NNRs lattice. After the magnetron sputtering, the surfaces of these NNRs are fully covered by Ag NPs as revealed in Fig. 8a and b. It should be noted that most of the decorated Ag NPs uniformly arrange along these one dimensional nanorods with an obvious interparticle gap to form a bead chain structure, although some large nonuniform aggregates also appear. The sizes of the coated Ag NPs and the interparticle gaps can be calculated as 40–150 and 5–40 nm, respectively. Particularly, the NNRs still preserve their sharp tips assembled with small Ag caps as shown in Fig. 8c. The TEM image in Fig. 8d shows the synthesized Ag-decorated NNR, depicting the presence of Ag NPs on the surfaces of NNRs. The measured spacings of the lattice planes in a typical Ag NP are about 0.24 and 0.21 nm, being assigned to the (111) and (200) planes of Ag as shown in Fig. 8e. Furthermore, the elemental composition of the Ag-decorated NNRs was analyzed using energy-dispersive spectroscopy (EDS) as presented in the inset of Fig. 8f. Besides the peaks of C, Cl and K from the CFC substrate, the peaks of Ni, Co, O and Ag are dominant in the spectrum, confirming the formation of the Ag-decorated NNRs. To our knowledge, such a novel 3D periodical structure has not been applied as SERS-base immunoassay substrate.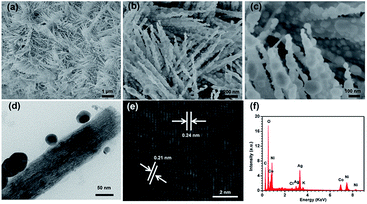 | ||
| Fig. 8 (a–c) SEM images, (d) TEM images, (e) HRTEM image of the Ag-decorated NNRs and (f) EDS spectrum of the Ag-decorated NNRs. | ||
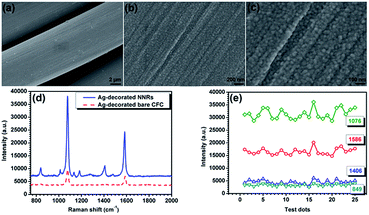
According to the literatures, individual electromagnetic wave may transfer between Ag NPs and even the adjacent Ag-coated NNRs, spread and couple on their rough surfaces under laser excitation. Intense electromagnetic fields may subsequently originate around their nanoscale gaps and Ag-active tips, enabling high detection sensitivity.33 To examine the role of the NNRs on the SERS applications, a controlled experiment was performed by directly deposit Ag NPs on the bare CFC. A dense Ag shell appears on the CFC as shown in Fig. 9a and b. The size of the compacted Ag NPs can be identified as around 10–50 nm (Fig. 9c). Consequently, the Raman enhancement efficiency of these two substrates was compared as presented in Fig. 9d. It can be seen that the SERS intensity of Ag-decorated bare CFC is much lower than that of Ag-decorated NNRs, which should be attributed to the shortage of interparticle gaps and sharp Ag-active tips. The problem of reproducibility has always been a critical aspect in SERS, which has hampered the practical application of SERS technology in immunoassay. Therefore, uniformity and reproducibility of the Ag-decorated NNRs substrates were also evaluated. The SERS spectra of the 4MBA molecules were recorded at 25 random spots on the substrate and the relative standard deviation of the measured Raman vibration at 849, 1076, 1406 and 1586 cm−1 were calculated to be 16%, 6.5%, 19% and 6.1% as shown in Fig. 9e. It is apparent that the obtained SERS-active substrate is an alternative one in immunoassay.
3.3 SERS-based immunoassay of AFP
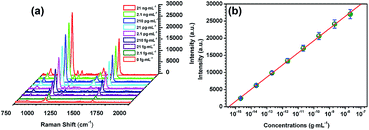
By using the immune SiO2@Ag microspheres and immune Ag-decorated NNRs, a sandwich type assay was performed to detect AFP. After the immune reaction, it can be clearly seen that many aggregated SiO2@Ag microspheres adsorb on the Ag-decorated NNRs as illustrated in Fig. 10. The aggregations are caused by the modification of 4MBA and anti-AFP on the SiO2@Ag microspheres, which was validated in Fig. 6. Next, to evaluate the sensitivity of immunoassay based on this novel structure, the relationship between SERS intensity and the concentration of antigen was examined. Fig. 11a displays the SERS spectra of the sandwich immune complexes in the presence of AFP with various concentrations from 21 ng mL−1 to 2.1 fg mL−1. The spectra were obtained by averaging five readings of each sample. It is observed that the intensity of the 1076 and 1586 cm−1 from 4MBA are noticeably decreased with the decrease of AFP concentration. It is easy to find that a weak SERS signal appears in the absence of AFP as shown in Fig. 11a. The result indicates that more intense SERS signals were detected from the sandwich structure after the immune reaction of AFP and anti-AFP compared with the sample without adding AFP. Fig. 11b portrays the SERS intensity change of the peak centered at 1076 cm−1 as a function of AFP concentration. The SERS intensity of the designated peak was proportional to AFP concentration within the whole range. The linear regression equation was Y = 3544.883X + 52![[thin space (1/6-em)]](https://www.rsc.org/images/entities/char_2009.gif) 332.597 with a correlation coefficient R2 = 0.996. The immunoassay results demonstrated that the detection limit of AFP was as low as 2.1 fg mL−1. Such high detection sensitivity might be due to the novel immune probe and one dimensional NNRs immune substrate which can bring about enormous SERS “hot spots” between the junctions of the sandwich structured composites. In addition, compared with the two typical multiplex immunoassays for AFP, such as chemiluminescent method with a linear response range from 0.3 to 0.008 ng mL−1 and a detection limit of 5 pg mL−1 reported by Yang et al. and ELISA strategy with a linear response range from 500 to 1 pg mL−1 and a detection limit of 1 pg mL−1 achieved by Liu et al., SERS-based immunoassay in this work showed a wider linear range and an extremely lower detection limit.34,35
332.597 with a correlation coefficient R2 = 0.996. The immunoassay results demonstrated that the detection limit of AFP was as low as 2.1 fg mL−1. Such high detection sensitivity might be due to the novel immune probe and one dimensional NNRs immune substrate which can bring about enormous SERS “hot spots” between the junctions of the sandwich structured composites. In addition, compared with the two typical multiplex immunoassays for AFP, such as chemiluminescent method with a linear response range from 0.3 to 0.008 ng mL−1 and a detection limit of 5 pg mL−1 reported by Yang et al. and ELISA strategy with a linear response range from 500 to 1 pg mL−1 and a detection limit of 1 pg mL−1 achieved by Liu et al., SERS-based immunoassay in this work showed a wider linear range and an extremely lower detection limit.34,35
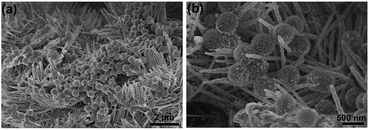 | ||
| Fig. 10 (a and b) SEM images under different magnification of the prepared sandwich immune structure. | ||
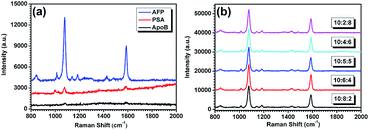
Finally, the immunologic specificity of the SERS-based immunoassay with the 4MBA-labelled immune SiO2@Ag microspheres and Ag-decorated NNRs were certified. In the experiment, PSA and ApoB (both 2.1 pg mL−1 in PBS) were chosen as the proteins for unspecific binding with 4MBA-labelled AFP-SiO2@Ag microspheres. The SERS detection results are shown in Fig. 12a. It is clear that weaker SERS signals of 4MBA was obtained from the immune substrates with PSA and ApoB than that with the same amount of AFP after thoroughly washing. A sandwich assay for a mixed antigen solution of AFP, ApoB and PSA was then carried out to further certificate the immunologic specificity for AFP. The concentration of AFP in the solution was fixed at 2.1 pg mL−1, while the mass ratio of AFP, ApoB and PSA was varied from 10![[thin space (1/6-em)]](https://www.rsc.org/images/entities/char_2009.gif) :
:![[thin space (1/6-em)]](https://www.rsc.org/images/entities/char_2009.gif) 8
8![[thin space (1/6-em)]](https://www.rsc.org/images/entities/char_2009.gif) :
:![[thin space (1/6-em)]](https://www.rsc.org/images/entities/char_2009.gif) 2, 10
2, 10![[thin space (1/6-em)]](https://www.rsc.org/images/entities/char_2009.gif) :
:![[thin space (1/6-em)]](https://www.rsc.org/images/entities/char_2009.gif) 6
6![[thin space (1/6-em)]](https://www.rsc.org/images/entities/char_2009.gif) :
:![[thin space (1/6-em)]](https://www.rsc.org/images/entities/char_2009.gif) 4, 10
4, 10![[thin space (1/6-em)]](https://www.rsc.org/images/entities/char_2009.gif) :
:![[thin space (1/6-em)]](https://www.rsc.org/images/entities/char_2009.gif) 5
5![[thin space (1/6-em)]](https://www.rsc.org/images/entities/char_2009.gif) :
:![[thin space (1/6-em)]](https://www.rsc.org/images/entities/char_2009.gif) 5 and 10
5 and 10![[thin space (1/6-em)]](https://www.rsc.org/images/entities/char_2009.gif) :
:![[thin space (1/6-em)]](https://www.rsc.org/images/entities/char_2009.gif) 4
4![[thin space (1/6-em)]](https://www.rsc.org/images/entities/char_2009.gif) :
:![[thin space (1/6-em)]](https://www.rsc.org/images/entities/char_2009.gif) 6 to 10
6 to 10![[thin space (1/6-em)]](https://www.rsc.org/images/entities/char_2009.gif) :
:![[thin space (1/6-em)]](https://www.rsc.org/images/entities/char_2009.gif) 2
2![[thin space (1/6-em)]](https://www.rsc.org/images/entities/char_2009.gif) :
:![[thin space (1/6-em)]](https://www.rsc.org/images/entities/char_2009.gif) 8. As illustrated in Fig. 12b, the SERS signals of 4MBA are nearly the same, when these mixed antigens were detected. Such a phenomenon showed clearly that ApoB and PSA in the solutions have no influence on the final immune result, indicating non-specificity for ApoB and PSA by using this sandwich assay. Thus, the SERS-based assay only responds to AFP, revealing the high specificity inherent in our detection system.
8. As illustrated in Fig. 12b, the SERS signals of 4MBA are nearly the same, when these mixed antigens were detected. Such a phenomenon showed clearly that ApoB and PSA in the solutions have no influence on the final immune result, indicating non-specificity for ApoB and PSA by using this sandwich assay. Thus, the SERS-based assay only responds to AFP, revealing the high specificity inherent in our detection system.
4 Conclusions
In this study, a novel SERS-based sandwich immunoassay platform using SiO2@Ag microspheres and Ag-patterned NNRs was developed for sensitive detection of AFP. The size, shape, and density of Ag NPs on SiO2 microspheres were easily adjusted by tailoring the concentration of AgNO3 from 0.005 to 0.06 M, when a nearly compact Ag nanoshell formed on SiO2 microspheres, the LSPR peak of the obtained hybrid microspheres moved to as far as 603 nm, which is nearest to the excitation wavelength. Significantly, the SERS signal intensity at 1076 cm−1 from the sample synthesized with 0.04 M AgNO3 was approximately 1.5 times higher than that from the sample prepared with 0.005 M AgNO3. Theoretical calculations were also carried out to better understand the dependence of electromagnetic field distribution around the hybrid microspheres on the size and number of the coated Ag NPs. And Ag-decorated NNRs showed excellent sensitivity and reproducibility of SERS signal due to their homogeneous nanoscale gaps with the size of 5–40 nm and Ag-active sharp tips. The SERS intensity Ag-decorated NNRs was much higher than that of Ag-decorated bare CFC, which further confirms the critical role of the NNRs on the SERS. A sandwich immunoassay strategy based on the above two hybrid structures was successfully performed to detect AFP with a wider linear range from 21 ng mL−1 to 2.1 fg mL−1 and a low detection limit of 2.1 fg mL−1. Such a SERS-based immunoassay were finally proved to maintain excellent specificity for AFP.Acknowledgements
This work was supported by the National Natural Science Foundation of China (NSFC) (grant no. 61320106014, 61275153 and 11404177), the Foundation of Zhejiang Educational Commission (grant no. Y201430403), the Natural Science Foundation of Ningbo (grant no. 2014A610120) and K. C. Wong Magna Foundation of Ningbo University, China.Notes and references
- Y. Wang, P. Li, Z. Majkova, C. R. Bever, H. J. Kim, Q. Zhang, J. E. Dechant, S. J. Gee and B. D. Hammock, Anal. Chem., 2013, 85, 8298–8303 CrossRef CAS PubMed.
- M. Jin, G. Zhu, R. Jin, S. Liu, H. Shao, F. Jin, Y. Guo and J. Wang, Food Agric. Immunol., 2013, 24, 345–356 CrossRef CAS.
- Y. M. C. Wang, V. Jawa and M. Ma, Bioanalysis, 2014, 6, 79–87 CrossRef CAS PubMed.
- O. Sadik, A. Wanekaya and S. Andreescu, J. Environ. Monit., 2004, 6, 513–522 RSC.
- Y. Naot and J. S. Remington, J. Infect. Dis., 1980, 142, 757–766 CrossRef CAS PubMed.
- R. T. Ranasinghe and T. Brown, Chem. Commun., 2011, 47, 3717–3735 RSC.
- A. Y. Rubina, A. Kolchinsky, A. A. Makarov and A. S. Zasedatelev, Proteomics, 2008, 8, 817–831 CrossRef CAS PubMed.
- Y. Wang, B. Yan and L. Chen, Chem. Rev., 2012, 113, 1391–1428 CrossRef PubMed.
- H. Chon, C. Lim, S. M. Ha, Y. Ahn, E. K. Lee, S. I. Chang, G. H. Seong and J. Choo, Anal. Chem., 2010, 82, 5290–5295 CrossRef CAS PubMed.
- J. Adams, M. Aggarwal, Z. Ahammed, J. Amonett, B. Anderson, D. Arkhipkin, G. Averichev, S. Badyal, Y. Bai and J. Balewski, Nucl. Phys. A, 2005, 757, 102–183 CrossRef.
- B. H. Jun, J. H. Kim, H. Park, J. S. Kim, K. N. Yu, S. M. Lee, H. Choi, S. Y. Kwak, Y. K. Kim and D. H. Jeong, J. Comb. Chem., 2007, 9, 237–244 CrossRef CAS PubMed.
- T. V. Dinh, H. N. Wang and J. Scaffidi, J. Biophotonics, 2010, 3, 89–102 CrossRef PubMed.
- M. Lee, K. Lee, K. H. Kim, K. W. Oh and J. Choo, Lab Chip, 2012, 12, 3720–3727 RSC.
- T. Jiang, L. Zhang and J. Zhou, Analyst, 2014, 139, 5893–5900 RSC.
- T. T. B. Quyen, C. C. Chang, W. N. Su, Y. H. Uen, C. J. Pan, J. Y. Liu, J. Rick, K. Y. Lin and B. J. Hwang, J. Mater. Chem. B, 2014, 2, 629–636 RSC.
- T. V. Dinh, A. M. Fales, G. D. Griffin, C. G. Khoury, Y. Liu, H. Ngo, S. J. Norton, J. K. Register, H. N. Wang and H. Yuan, Nanoscale, 2013, 5, 10127–10140 RSC.
- L. Zhang, Y. Zhang, Y. Hu, Q. Fan, W. Yang, A. Li, S. Li, W. Huang and L. Wang, Chem. Commun., 2014, 51, 294–297 RSC.
- Y. Zhu, H. Kuang, L. Xu, W. Ma, C. Peng, Y. Hua, L. Wang and C. Xu, J. Mater. Chem., 2012, 22, 2387–2391 RSC.
- L. Zhao, X. Ji, X. Sun, J. Li, W. Yang and X. Peng, J. Phys. Chem. Lett., 2009, 113, 16645–16651 CrossRef CAS.
- M. Honda, Y. Saito, N. I. Smith, K. Fujita and S. Kawata, Opt. Express, 2011, 19, 12375–12383 CrossRef CAS PubMed.
- L. Chen, X. Han, J. Yang, J. Zhou, W. Song, B. Zhao, W. Xu and Y. Ozaki, J. Colloid Interface Sci., 2011, 360, 482–487 CrossRef CAS PubMed.
- K. Wang, X. Zhang, C. Niu and Y. Wang, ACS Appl. Mater. Interfaces, 2014, 6, 1272–1278 CAS.
- Y. Xie, Y. Jin, Y. Zhou and Y. Wang, Appl. Surf. Sci., 2014, 313, 549–557 CrossRef CAS.
- J. Huang, F. Chen, Q. Zhang, Y. Zhan, D. Ma, K. Xu and Y. Zhao, ACS Appl. Mater. Interfaces, 2015, 7, 5725–5735 CAS.
- Z. Wang, G. Meng, Z. Huang, Z. Li and Q. Zhou, Nanoscale, 2014, 6, 15280–15285 RSC.
- R. Ding, L. Qi, M. Jia and H. Wang, J. Appl. Electrochem., 2013, 43, 903–910 CrossRef CAS.
- L. Huang, D. Chen, Y. Ding, S. Feng, Z. L. Wang and M. Liu, Nano Lett., 2013, 13, 3135–3139 CrossRef CAS PubMed.
- S. J. Lee, A. R. Morrill and M. Moskovits, J. Am. Chem. Soc., 2006, 128, 2200–2201 CrossRef CAS PubMed.
- Y. H. Kim, D. K. Lee, H. G. Cha, C. W. Kim and Y. S. Kang, J. Phys. Chem. C, 2007, 111, 3629–3635 CAS.
- C. Song, Z. Wang, R. Zhang, J. Yang, X. Tan and Y. Cui, Biosens. Bioelectron., 2009, 25, 826–831 CrossRef CAS PubMed.
- J. C. Zhou, Z. L. Yang, W. Dong, R. J. Tang, L. D. Sun and C. H. Yan, Biomaterials, 2011, 32, 9059–9067 CrossRef CAS PubMed.
- Z. Rong, R. Xiao, C. Wang, D. Wang and S. Wang, Langmuir, 2015, 31, 8129–8137 CrossRef CAS PubMed.
- H. He, W. Cai, Y. Lin and B. Chen, Chem. Commun., 2010, 46, 7223–7225 RSC.
- X. Y. Yang, Y. S. Guo, S. Bi and S. S. Zhang, Biosens. Bioelectron., 2009, 24, 2707–2711 CrossRef CAS PubMed.
- Y. Liu, H. Wang, J. Huang, J. Yang, B. Liu and P. Yang, Anal. Chim. Acta, 2009, 650, 77–82 CrossRef CAS PubMed.
| This journal is © The Royal Society of Chemistry 2016 |

