Quantitative optimization and assessments of supplemented tea polyphenols in dry dog food considering palatability, levels of serum oxidative stress biomarkers and fecal pathogenic bacteria

Maoshen Chen, Xuemei Chen, Wenli Cheng, Yue Li, Jianguo Ma and Fang Zhong*
State Key Laboratory of Food Science and Technology, School of Food Science and Technology, Jiangnan University, 1800 Lihu Avenue, 214122 Wuxi, Jiangsu Province, China. E-mail: fzhong@jiangnan.edu.cn; Fax: +86-510-85329060; Tel: +86-510-85328307

Received 30th October 2015 , Accepted 21st January 2016

First published on 26th January 2016


Abstract

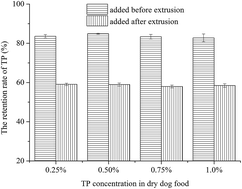
The objective of this study was to investigate the effects of supplementation of tea polyphenols (TP) in dry dog food on the palatability of dry dog food, serum oxidative stress biomarkers, and fecal pathogenic bacteria in adult dogs. Four different concentrations of TP (0.25%, 0.50%, 0.75% and 1.0%) were added to the basal dog food before or after extrusion. The TP retention rate before extrusion was more than 80% and significantly higher than that after extrusion (<60%). First-choice ratios of palatability were 72%, 68% and 70% for TP concentrations of 0.50%, 0.75% and 1.0%, respectively, resulting in significant increases compared to the palatability for the control of 28%, 32% and 30%. The intake ratio (one-pan test) and consumption ratio (two-pan test) of the 0.50% TP experimental dog food were 73% and 74%, respectively, significantly higher than the other three TP supplemented foods. The serum total antioxidant capacity, superoxide dismutase activities and glutathione peroxidase activities determined in the dogs' food of 0.50% TP group increased by 19.30%, 7.72% and 4.64%, as compared to the control group after 12 weeks, respectively. The serum malondialdehyde concentration was reduced by 15.05%. The fecal aerobic plate count and Coliform bacteria MPN (most probable number) of 0.50% TP group decreased by 2[thin space (1/6-em)]logs and 1[thin space (1/6-em)]log, respectively, compared with the control group after 12 weeks. The findings of this study have demonstrated that a concentration of 0.50% TP added to the dry dog food can significantly increase the palatability, antioxidant capacity and antibacterial activity of dry dog food in the canine model.
Introduction

Pet owners view their pets as family members or companions and are concerned about their pet's health. As a result of their interest in their pet's diet, the dog and cat food market has grown to $21.4 billion in the U.S. in 2014.1 According to the AAFCO (Association of American Feed Control Officials) standards, dog food should include at least 22.0% protein, 8.0% fat and 1.0% linoleic acid.2 The high content of total fat and polyunsaturated fatty acid in dry dog food may allow it to be easily oxidized, forming hydroperoxides and other compounds that cause cellular damage.3 Dry dog food also contains high levels of proteins, carbohydrates, vitamins and minerals that may support microorganisms, such as moulds, Escherichia coli and Salmonella bacteria, that are unhealthy for dogs.4 Antioxidants and antimicrobial agents added to dry dog food may reduce microbial growth.

In recent years, a number of studies have reported that tea polyphenols (TP) have many positive effects on human health.5,6 TP has been shown to trap reactive oxygen species, such as singlet oxygen, superoxide radical, peroxyl radical, hydroxyl radical, nitrogen dioxide, nitric oxide and peroxynitrite, reducing damage to proteins, lipid membranes and nucleic acids in cell-free systems. Animal and in vitro studies also suggest that TP possesses bioactivity against of several chronic diseases.7 TP may protect against diseases by contributing, along with dietary antioxidants such as vitamins C and E, and endogenous enzymes such as superoxide dismutase activities and glutathione peroxidase, to the total antioxidant defense system.3 TP has shown to have effective antimicrobial activity in animal and in vitro.8 Many studies have shown that TP prevents and inhibits food pathogens, including Listeria monocytogenes, Staphylococcus aureus, Shigella disenteriae, Campylobacter jejuni, Vibrio cholera, etc.9 Therefore, TP may prevent lipid peroxidation and increase antibacterial activity in dry dog food.

TP intake by dogs has been reported in several studies.10,11 For example, Serisier et al. showed that oral green tea extract administered before the dog's single meal improved insulin sensitivity and lipid profile and altered the expression of genes related to metabolic dysfunction in an obese dog models.12 However, only limited studies of the antioxidant capacity and antibacterial activity of TP in dogs were found. TP may alter palatability and palatability is important for the animal pharmaceutical and pet food industries.13 A review of the available literature did not produce any studies of the effect of TP on palatability to adult dogs. In this study the effects of TP on the palatability, antioxidant capacity and antibacterial activity in adult dogs were investigated.

Different concentrations of TP were added to a basal dog food formulation before or after extrusion. The retention rate of TP and palatability using the one-pan test, first-choice ratio and two-pan test were determined. A 12 week study examined the influence of TP on antioxidant biomarkers in serum and antibacterial activity in the digestive tract by microbial analysis of the feces.

Materials and methods

Materials

The tea polyphenols (98%) was bought from Shanghai Qiangsheng Medical Technologies Inc. Rice (dehulled), soybean meal, wheat, maize, dicalcium phosphate, soybean oil, brewers yeast, fish meal, sodium chloride, minerals, potassium sorbate were purchased from Jing Dianzi animal husbandry products supermarket (Guangxi, China). Analytical grade reagents and distilled water were used in all experiments.

The basal dry dog food was produced by extrusion using a screw extruder (Jinan Saixin Machinery Co., Ltd). The feed rate was 20 kg per hour and screw rotation speed was 140 pm. The barrel temperatures of three segments were at 80, 130, and 140 °C, respectively. The ingredients and nutrient composition of the basal dog food are provided in Table 1. As shown in Table 1, the basal dog food contained all nutrients in amounts sufficient to meet the requirement of an adult dog as described in the AAFCO.2 The basal dog food was used as the control. The experimental dog foods contained the basal dog food and 0.25%, 0.50%, 0.75% and 1.0% TP. The TP was mixed with the ingredients of the basal dog food and extruded. Another group of experimental dog food was prepared by adding the same levels of TP to the extruded basal diet by uniformly spraying dissolved TP on the basal dog food and drying at 40 °C.

Table 1 The ingredients and nutrient compositions of the basal dog food
Ingredient Content/% Nutrient composition Content (dry weight)/%
Rice (dehulled) 12.00 Crude protein 25.67
Maize 31.00 Crude oil 10.56
Fish meal 19.00 Crude fiber 6.27
Soybean meal 10.00 Ash 5.78
Wheat 10.00 Calcium 1.01
Brewers yeast 8.00 Phosphorus 0.89
Soybean oil 8.00    
Dicalcium phosphate 1.00    
Sodium chloride 0.50    
Multi-vitamins 0.20    
Minerals 0.20    
Potassium sorbate 0.10    


Measurements

Determination of TP retention rate. The TP content in the experimental dog food was determined using Folin–Ciocalteu reagent. This method has been described in detail by Nihal Turkmen et al.14 The content of TP in the basal dog food was used as the control. The retention rate of TP in the experimental dog food was calculated using the following equation.
Retention rate (%) = Cs/Ca × 100

Cs: the content of TP contained in the experimental dog food (%). Ca: the content of TP added to the experimental dog food (%).

Animals and their management. The animal study was approved by the Laboratory Animal Center of Nantong University, Nantong, Jiangsu, China. The procedures of this study were carried out in accordance with the European Community guidelines (Directive 2010/63/EU) for the care and use of experimental animals. Sixteen 2–3 year-old male beagles were used in the present experiment. The beagles were obtained from a licensed kennel, and at the end of the experiment, they were returned to the kennel.15 The dogs were housed in a room with controlled temperature (25 ± 2) °C, controlled relative humidity (55 ± 5)% and a light–dark cycle of 12[thin space (1/6-em)]:[thin space (1/6-em)]12 h.16 All dogs were fed twice a day and allowed free access to water.
Palatability experiment. Acceptance test (one-pan test): eight beagles were used for each test. Dogs were offered each sample for 1 h17,18 each day for five day. At the end of the hour, any refused food was weighed to determine the intake ratio (IR) of each sample. The IR was calculated by dividing the grams consumed of the sample by the grams given of the sample.

Preference tests (free-choice test and two-pan test): eight beagles were used for each test. All dogs were allowed free access to water. Dogs were offered a TP supplemented sample and the control in separate bowls for 1 h daily for five days. The placement of the bowls was alternated each day to eliminate any bowl placement bias. First-choice data were collected. At the end of the hour, any refused food was weighed to determine consume ratio (CR) of each sample. The CR was calculated by dividing the grams consumed of the sample by the total grams consumed of both the sample and control.

Antioxidant capacity and antibacterial activity experiment. Sixteen adult beagles were randomly divided into two equal groups (0.50% TP group and control group) and treated as follows: the dogs in TP group were fed the 0.5% TP in the basal diet and the control group was fed the basal diet. Dogs were on test for 12 weeks. All dogs were fed at 07:00 and 17:00[thin space (1/6-em)]17 and were allowed free access to water.

Venous blood samples were collected on weeks 0, 2, 4, 8 and 12 by foreleg venipuncture. After clotting, blood samples were centrifuged (1000 × g, 4 °C, 10 min), and sera were carefully harvested. Fecal samples were collected on weeks 0, 4, 8 and 12. Blood samples and fecal samples were stored at −4 °C prior to analysis.

Venous blood was sampled for determination of serum total antioxidant capacity (TAC), superoxide dismutase (SOD) activities, glutathione peroxidase (GSH-Px) activities and malondialdehyde (MDA) concentration. These serum blood test indices were detected with the test kits from Canspec China Biological Engineering (Shanghai, China). The aerobic plate count (APC), Staphylococcus aureus (S. aureus) and Coliform bacteria MPN (most probable number) were performed according to the methods of GB/T 47892-2010, 14926.14-2001 and 14926.11-2001 (National Standards of Peoples Republic of China).

Statistical analysis. Factorial analysis of variance was performed with IBM SPSS Statistics Version 19.0 software using t-Tukey test, and p < 0.05 was regarded as significantly different. Values were given as average ± standard deviation.

Results and discussion

The TP retention rate analysis

The TP retention rates for the four TP concentrations (0.25%, 0.50%, 0.75% and 1.0%) in the dry dog food before or after extrusion are presented in Fig. 1. The retention rates of the samples where TP was added after extrusion were about 60% for the four TP concentrations. However, the retention rates of TP added before the extrusion process were all more than 80% and significantly higher than the TP levels where TP was added after extrusion. The reason for this result was unclear since the TP added after the extrusion process was not treated with high temperature and high pressure. Because the addition of TP before or after extrusion had significant effects on the retention rates and TP added before extrusion was used in subsequent experiments.
image file: c5ra22790a-f1.tif
Fig. 1 The retention rate of TP in the experimental dog food added before or after the extrusion process. Bars represent mean values while error bars represents standard deviation.

Palatability analysis

Palatability is important for the animal pharmaceutical and pet food industries because the greater the palatability, the easier and more enjoyable the administration of bioactive substances. Because dogs are unable to declare preferences directly, palatability assessment must be based on an objective measure in which two or more foods can be ranked on the basis of preference. Palatability experiment is most often determined by the acceptance test (one-pan test) and the preference tests (free-choice test and two-pan test).13 This design results in the most reliable data.18 Using only a one-pan test could skew an animal's appetite and food acceptance. The results of one-pan tests are presented in Table 2. As shown in Table 2, the IR, 73%, of the experimental dog food with 0.50% TP was significantly higher compared to the other TP concentrations. As the concentration of TP in the dry dog food reached 1.0%, the IR was only 19% and caused a decrease in the acceptance of the dog food.
Table 2 The results of one-pan testsa
TP concentration 0.25% 0.50% 0.75% 1.0%
a Different letters indicate significant difference (p < 0.05).
Intake ratio (IR) 58.15 ± 4.90b 72.77 ± 3.79a 32.59 ± 8.54c 18.55 ± 3.96c


The preference test is the most common palatability test in the pet food industry. The first-choice ratios of samples and control are presented in Fig. 2. In this experiment, there was no significant difference between first-choice ratio of the 0.25% TP experimental dog food (47%) and the basal dog food (53%). The first-choice ratios of 0.50%, 0.75% and 1.0% TP experimental dog food were 72%, 68% and 70%, respectively, and all were significantly higher than the control of 28%, 32% and 30%. Thus, a high TP concentration (≥0.50%) may prevent oxidation and present an odor that the dogs prefer, thereby increasing the first-choice ratio.


image file: c5ra22790a-f2.tif
Fig. 2 The first-choice ratios of the experimental dog food added with different concentration of TP and basal dog food. S1: 0.25% TP; S2: 0.50% TP; S3: 0.75% TP; S4: 1.0% TP; C: control (basal dog food); bars refer to mean values; error bars refer to standard deviation; different letters indicate significant difference (p < 0.05).

It is well known that first-choice data are often difficult to measure and the repeatability of these measures is questionable.13 First-choice is often subjective and therefore is not the best indicators of palatability. Consume ratios are the better indicators of overall palatability preference.19 Intake ratio (IR) is often regarded as a supplement to the consume ratio (CR). The consume ratios of experimental dog food and basal dog food are shown in Fig. 3. The different concentration of TP presented to the animals significantly affected CR. Compared with its control, the addition of TP concentration of 0.25% and 0.50% TP significantly increased the CR. However, TP concentration of 0.75% and 1.0% significantly decreased CR. The CR of the experimental dog food with 0.50% TP was 74% and significantly higher compared to the other three concentrations. The results of CR were in good agreement with the IR (Table 2). Based on the IR, first-choice ratios and CR, the experimental dog food added with 0.50% TP appears to provide the odor and/or taste that dogs prefer.


image file: c5ra22790a-f3.tif
Fig. 3 The consume ratios of the experimental dog food added with different concentrations of TP and basal dog food. S1: 0.25% TP; S2: 0.50% TP; S3: 0.75% TP; S4: 1.0% TP; C: control (basal dog food); bars refer to mean values; error bars refer to standard deviation; different letters indicate significant difference (p < 0.05).

Antioxidant capacity and antibacterial activity analysis

Antioxidant capacity analysis. Tea and TP are effective scavengers of reactive oxygen and nitrogen species in vitro.20 In vivo, superoxide dismutase (SOD) and glutathione peroxidase (GSH-Px) are enzymes that remove free radicals and are biomarkers found in serum.21,22 Dog foods contain high amount of oxidizable lipids and the lipid peroxidation products can decompose to form aldehydes such as malondialdehyde (MDA) and 4-hydroxynonenal (4-HNE) that can form undesirable protein adducts. The serum total antioxidant capacity (TAC), SOD activity, GSH-Px activity and MDA concentration in the venous blood were analyzed as indices of oxidation status. The results are presented in Table 3. The TAC, SOD activities, GSH-Px activities and MDA concentrations of 0.50% TP and control were the same level (P > 0.05) at week 0. After 2 weeks, the TAC, SOD activities and GSH-Px activities of 0.50% TP group were all significantly higher (P < 0.05), but the MDA concentrations were significantly lower (P < 0.05) than those of the control. After 12 weeks, the serum TAC, SOD activities and GSH-Px activities of 0.50% TP group were increased by 19.30%, 7.72% and 4.64%, respectively, higher than the control group. The serum MDA concentration was reduced by 15.05% compared to the control group after 12 weeks. The addition of TP to the dog food at a concentration of 0.50% significantly increased the serum antioxidant enzyme activities and reduced the oxidation of lipids.
Table 3 The effects of TP on the serum TAC, SOD activity, GSH-Px activity and MDA concentrationa
  Weeks 0.50% TP Control Statistical p values
a In same column of each index, the different superscript letters represent significant difference (p < 0.05).
TAC (mM) 0 1.06 ± 0.03a 1.05 ± 0.02AB 0.918(>0.05)
2 1.18 ± 0.06b 1.06 ± 0.04AB 0.023(<0.05)
4 1.22 ± 0.04b 1.09 ± 0.05AB 0.008(<0.01)
8 1.36 ± 0.04c 0.98 ± 0.14A 0.002(<0.01)
12 1.36 ± 0.04c 1.14 ± 0.11B 0.008(<0.01)
Activity of SOD (U mL−1) 0 45.05 ± 0.34a 45.10 ± 0.48A 0.863(>0.05)
2 46.45 ± 0.67b 45.12 ± 0.41A 0.015(<0.05)
4 47.64 ± 0.79bc 45.79 ± 0.76A 0.015(<0.05)
8 48.85 ± 0.81c 46.11 ± 1.09A 0.007(<0.01)
12 51.49 ± 1.54d 47.80 ± 0.93B 0.006(<0.01)
Activity of GSH-Px (mU mL−1) 0 944 ± 48a 942 ± 60A 0.905(>0.05)
2 1007 ± 85b 945 ± 72A 0.009(<0.01)
4 1036 ± 58b 983 ± 44B 0.001(<0.01)
8 1145 ± 88c 1076 ± 54C 0.002(<0.01)
12 1180 ± 16c 1128 ± 74D 0.002(<0.01)
MDA (μM) 0 5.44 ± 0.22a 5.45 ± 0.25A 0.947(>0.05)
2 4.92 ± 0.19b 5.49 ± 0.25A 0.012(<0.05)
4 4.70 ± 0.26b 5.43 ± 0.32A 0.022(<0.05)
8 4.17 ± 0.23c 5.28 ± 0.81AB 0.040(<0.05)
12 3.95 ± 0.29c 4.65 ± 0.19B 0.007(<0.01)


The changes in oxidative stress biomarkers in the serum of beagles in our study support previous work of TP in rodents. The activities of SOD in the liver of Wistar rats were significantly higher by feeding 2.5% green tea leaves.21 Green tea polyphenolics in drinking water (0.2%, w/v) significantly increased the activities of GSH-Px in small bowel, liver, and lungs in mice.22 The antioxidant enzymes activities of catalase, quinone reductase, glutathione S-transferase and glutathione reductase act in liver of mice fed green tea polyphenolics significantly increased.22 Long-term feeding of green tea leaves was not toxic to liver or kidney.21,23 Skrzydlewska et al.24 found that the index of the total antioxidant status increased significantly when rats were permitted free access to solubilized extract of green tea for five weeks. In contrast, the lipid peroxidation products, particularly MDA was significantly diminished.

Antibacterial activity analysis. It is well known that the modulation activity of TP on the intestinal microflora has been demonstrated.5 Tea has an inhibitory effect on Vibrio cholerae, Salmonella typhi, Shigella, Campilobacter jejuni, Pseudomonas, Candida, Mycoplasma, Campilobacter coli, Salmonella, Clostridium and Cryptococcus.23,25–28 In an agar diffusion assay, tea extracts inhibited the growth of Helicobacter pylori. Tea extracts killed Helicobacter pylori (106 cfu mL−1) within 5 h. Heat treatment did not destroy the inhibitory or bactericidal activity of tea extracts.5

The aerobic plate count (APC), Coliform bacteria MPN and Staphylococcus aureus (S. aureus) in fecal samples are presented in Table 4. The APC and Coliform bacteria MPN in the fecal samples of 0.50% TP group were reduced. After 12 weeks, the 0.50% TP group decreased APC and Coliform bacteria MPN by 2[thin space (1/6-em)]logs and 1[thin space (1/6-em)]log, respectively, compared to controls. S. aureus was not detected in the two groups. TP added to the basal dog food ingredients and extruded is shown to have the inhibitory effects on pathogenic bacteria in the canine model.

Table 4 The effects of TP on the APC, Coliform bacteria MPN and S. aureusa
Measures Weeks 0.50% TP group Control group
a APC: aerobic plate count; S. aureus: Staphylococcus aureus. MPN: most probable number.
APC 0 (4.7 ± 0.5) × 108 (4.4 ± 0.4) × 109
4 (9.6 ± 0.3) × 107 (4.1 ± 0.4) × 109
8 (8.6 ± 0.9) × 107 (7.0 ± 0.2) × 109
12 (8.7 ± 0.6) × 107 (3.7 ± 0.3) × 109
Coliform bacteria MPN 0 2.1 × 10⁵ 2.1 × 10⁵
4 9.3 × 10⁴ 2.1 × 10⁵
8 1.6 × 10⁴ 2.1 × 10⁵
12 1.6 × 10⁴ 1.6 × 10⁵
S. aureus 0–12 Not detected Not detected


Conclusion

In this study, TP at 0.25%, 0.50%, 0.75% and 1.0% were added to a basal dog food formulation before extrusion or sprayed onto the extruded dog food after extrusion. Unexpectedly, the TP retention rates of TP added before the extrusion process were higher (80%) than TP added after the extrusion process (<60%). The palatability analysis by first-choice ratios of 0.50%, 0.75% and 1.0% TP dog foods were about 70% and all significantly higher than controls. The intake ratio and consume ratio of the 0.50% TP were 73% and 74%, respectively, significantly higher than the other three TP added concentrations. The serum TAC, SOD activities and GSH-Px activities of 0.50% TP group were increased by 19.30%, 7.72% and 4.64% than the control group after 12 weeks, respectively. In contrast, the serum MDA concentration was reduced by 15.05%. The antibacterial properties of TP in the feces show that in comparison with the control group, the 0.50% TP group decreased APC and Coliform bacteria MPN by 2[thin space (1/6-em)]logs and 1[thin space (1/6-em)]log, respectively, after 12 weeks of feeding. In conclusion, the addition of TP not only improves palatability of dry dog food to adult dogs but improves the health of dogs as shown by decreases in serum oxidative stress markers and fecal pathogenic bacteria numbers.

Acknowledgements

This project was financially supported by the Self-determined Research Program of Jiangnan University (JUSRP 115A22).

References

  1. K. Koppel, K. Adhikari and B. Di Donfrancesco, Molecules, 2013, 18, 2646–2662 CrossRef CAS PubMed.
  2. Official publication, Association of American Feed Control Officials, Atlanta, GA, 1997 Search PubMed.
  3. V. Crespy and G. Williamson, J. Nutr., 2004, 134, 3431S–3440S CAS.
  4. H. W. Liu, Inner Mongolia Science Technology and Economy, 2010, p. 68, in chinese Search PubMed.
  5. K. Diker and G. Hascelik, Lett. Appl. Microbiol., 1994, 19, 299–300 CrossRef.
  6. D. Erba, P. Riso, A. Bordoni, P. Foti, P. L. Biagi and G. Testolin, J. Nutr. Biochem., 2005, 16, 144–149 CrossRef CAS PubMed.
  7. N. Khan and H. Mukhtar, Life Sci., 2007, 81, 519–533 CrossRef CAS PubMed.
  8. M. P. Almajano, R. Carbo, J. A. L. Jiménez and M. H. Gordon, Food Chem., 2008, 108, 55–63 CrossRef CAS.
  9. P. Negi, G. Jayaprakasha and B. Jena, Food Chem., 2003, 80, 393–397 CrossRef CAS.
  10. I. Kapetanovic, J. Crowell, R. Krishnaraj, A. Zakharov, M. Lindeblad and A. Lyubimov, Toxicology, 2009, 260, 28–36 CrossRef CAS PubMed.
  11. J. Li, Z. Q. Yan and Q. Li, Anim. Husb. Vet. Med., 2011, 43, 32–35 CAS , in chinese.
  12. S. Serisier, V. Leray, W. Poudroux, T. Magot, K. Ouguerram and P. Nguyen, Br. J. Nutr., 2008, 99, 1208–1216 CrossRef CAS PubMed.
  13. R. Griffin, Petfood Technology, ed. J. L. Kvamme and T. D. Phillips, Watt Publishing Co., Mt. Morris, IL, 1st edn, 2003, pp. 187–193 Search PubMed.
  14. N. Turkmen, F. Sari and Y. S. Velioglu, Food Chem., 2006, 99, 835–841 CrossRef CAS.
  15. M. D. Paskalev, N. V. Goranov, S. J. Krastev and R. T. Roydev, Comp. Clin. Pathol., 2011, 20, 403–408 CrossRef CAS.
  16. S. Yu, K. Wedekind, C. A. Kirk and R. Nachreiner, J. Anim. Physiol. Anim. Nutr., 2006, 90, 146–151 CrossRef CAS PubMed.
  17. J. A. Strickling, D. Harmon, K. Dawson and K. Gross, Anim. Feed Sci. Technol., 2000, 86, 205–219 CrossRef CAS.
  18. J. M. Dust, C. Grieshop, C. Parsons, L. Karr-Lilienthal, C. Schasteen, J. Quigley, N. Merchen and G. Fahey, J. Anim. Sci., 2005, 83, 2414–2422 CAS.
  19. N. Trivedi, J. Hutton and L. Boone, PetfoodIndustry, 2000, 42, 42–44 Search PubMed.
  20. B. Frei and J. V. Higdon, J. Nutr., 2003, 133, 3275S–3284S CAS.
  21. Y.-L. Lin, C.-Y. Cheng, Y.-P. Lin, Y.-W. Lau, I.-M. Juan and J.-K. Lin, J. Agric. Food Chem., 1998, 46, 1893–1899 CrossRef CAS.
  22. S. G. Khan, S. K. Katiyar, R. Agarwal and H. Mukhtar, Cancer Res., 1992, 52, 4050–4052 CAS.
  23. C. J. Dufresne and E. R. Farnworth, J. Nutr. Biochem., 2001, 12, 404–421 CrossRef CAS PubMed.
  24. E. Skrzydlewska, J. Ostrowska, R. Farbiszewski and K. Michalak, Phytomedicine, 2002, 9, 232–238 CrossRef CAS PubMed.
  25. C. Stoicov, R. Saffari and J. Houghton, Int. J. Antimicrob. Agents, 2009, 33, 473–478 CrossRef CAS PubMed.
  26. S. Maity, J. R. Vedasiromoni and D. K. Ganguly, Jpn. J. Pharmacol., 1998, 78, 285–292 CrossRef CAS PubMed.
  27. M. Toda, S. Okubo, H. Ikigai, T. Suzuki, Y. Suzuki, Y. Hara and T. Shimamura, Microbiol. Immunol., 1992, 36, 999–1001 CrossRef CAS PubMed.
  28. K. Diker, M. Akan, G. Hascelik and M. Yurdakök, Lett. Appl. Microbiol., 1991, 12, 34–35 CrossRef.

This journal is © The Royal Society of Chemistry 2016