Albumin-functionalized magnetic nanoparticles as an efficient sorbent for removal of Pb(II), Cd(II), Cu(II) and Cr(VI) ions from aqueous solutions
Akbar Malekpour* and
Mohammad Khodadadi
Department of Chemistry, University of Isfahan, Isfahan, 81746/73441, Iran. E-mail: a.malekpour@chem.ui.ac.ir; Fax: +98 31 36689732; Tel: +98 31 37932714
First published on 13th January 2016
Abstract
Functionalized magnetic nanoparticles are increasingly attracting interest as a new and efficient sorbent for metallic contaminant elimination in environmental samples. Albumin modified magnetic nanoparticles (AMMNPs) were synthesized and characterized. This sorbent was used for removal of cationic and anionic species from the aqueous solutions. The sorbent showed a high adsorption capacity and short equilibrium time for Pb2+, Cu2+, Cd2+ and CrO42− ions removal from aqueous solutions. The effects of different parameters on the adsorption processes were investigated and isotherm curves were constructed. This study showed that AMMNPs are a proper adsorbent for the removal of the studied hazardous ions and can also be used as an efficient sorption material for preconcentration of the studied ions in trace analyses. The adsorption process was very fast and adsorbent performance was not affected clearly by the presence of other ionic species.
1. Introduction
Metallic pollutants are a serious threat to the environment, food chain and human health. Their biological behavior and toxic effects can cause many problems in the areas of agriculture and health and to the environment all over the world.1 It is therefore obvious that the study of metallic pollutant removal is necessary. There have been reported relatively large numbers of scientific studies for eliminating metal ions from water and wastewaters, including chemical precipitation,2 reverse osmosis,3 electrochemical reduction,4 ion exchange5 and adsorption.6Among these methods, the use of adsorbents is very attractive because of their low cost and high efficiency. The common adsorbents are activated carbon,7 carbon nanotubes,8 charcoal,9 clays,10 zeolites,11 composite materials,12,13 biomass,13 nanomaterials14 and polymeric materials.15 The efficiency of an adsorbent depends on the specific surface area, number of adsorption sites and chemical stability.16
Nanomaterials have unique features, and because of their small size, they possess a high surface area to volume ratio.17 Magnetic nanoparticles (MNPs) are a prevalent type of sorbent, which are widely used all over the world. These particles have a low cost, show sufficient magnetic properties and can be easily modified without altering their properties significantly. These features make them adsorbents with a great number of active sites and high efficiency. The most important advantage of using magnetic nanoparticles is manipulation simplicity.18
Albumin is the most abundant protein in mammalian blood serum, which is involved in the transport of hormones, fatty acids, small molecules and metal ions.19 This protein can adsorb metals because of their structural functional groups. It is expected that HSA shows a strong affinity towards transition metal ions because of the existence of amino acid residues such as histidine and cysteine.20 These amino acids have S and N atoms, which bind effectively with transition metal ions. In fact, a physical adsorption can also exist because of abovementioned functional groups in the albumin structure. In this study, our aim is the synthesis and characterization of the albumin modified magnetic nanoparticles (AMMNPs) and investigation of their ability to removal of the selected metal ions from aqueous solutions. We also intend to introduce AMMNPs as an effective and reliable adsorbent for preconcentration of the selected ions in trace analyses.
2. Materials and method
2.1. Materials
Hydrochloric acid, ethanol, sodium hydroxide, ferric chloride hexahydrate, ferrous chloride tetrahydrate, 25% ammonia solution, potassium dichromate, lead(II) nitrate, cadmium nitrate, and copper(II) nitrate were obtained from Merck (Germany). Amino propyl triethoxysilane (APTES) and tetra ethyl orthosilicate (TEOS) were purchased from Fluka (USA). A 25% human serum albumin (HSA) solution was prepared from Kedrion (Lukka, Italy).2.2. Apparatus
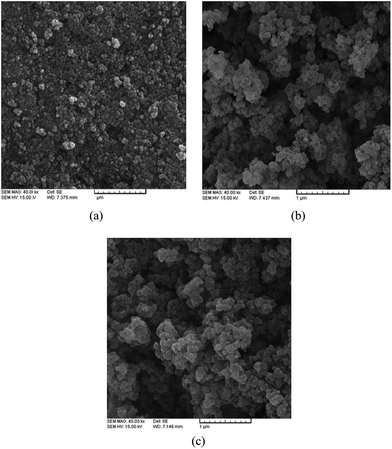
Characterization of the sorbents was performed using a Jasco, 6300 Fourier transform infrared spectrometer (FT-IR) in the range of 400–4000 cm−1. The superparamagnetic properties of the magnetic particles were verified by the magnetization curve measured by the Alternating Gradient Force Magnetometer (AGFM). A Vega Tescan-LMU (Brno, Kohoutovice, Czech Republic) scanning electron microscope (SEM) was used to study the nanoparticles surface. The atomic absorption spectrometer was a Shimadzu, AA-670 and it was used with an air/acetylene flame for measuring all the investigated cations.2.3. Synthesis of silica coated magnetic nanoparticles
The silica coated magnetite nanoparticles were obtained by a co-precipitation method.21 In a conventional synthesis, 12.3 g of FeCl3·6H2O and 4.60 g of FeCl2·4H2O were dissolved in 800 mL deionized water in a round bottomed flask under nitrogen with mechanical stirring at 80 °C. Then, 20% of 30 mL NH3 solution was added dropwise into the solution and a color change was observed immediately. The product was rinsed with deionized water twice. The resulting nanoparticles were dispersed in deionized water and then appropriate amounts of TEOS were added, and the pH value was increased to 12–13 by adding 25% ammonia solution while it was stirred with a mechanical stirrer. The suspension was sonicated at 85 °C for 30 min, and the pH was reduced to 6 by HCl. The synthesized product was washed three times with deionized water, and a brown precipitate was achieved.2.4. APTES functionalized silica coated MNPs
The surface of the silica coated magnetic nanoparticles was activated by using APTES and glutaraldehyde for HSA immobilization.21 4 g of the magnetic nanoparticles prepared above was dispersed into 250 mL methanol in a flask; then 7 mL APTES and 3 mL deionized water was added dropwise to this solution and kept in an ultrasonic for 30 min. Subsequently, 150 mL glycerol was mixed into the solution by mechanical stirring at 90 °C for 3 h. The products were collected by a permanent magnet and washed with methanol–water (50–50) solution three times. Then, 20 mL glutaraldehyde and 0.1 M phosphate buffer were added to the flask followed by sonication for 6 h for surface activation. The collected nanoparticles were washed several times with deionized water to remove excess glutaraldehyde and other remaining reagents.2.5. Preparation of MNP functionalized with albumin
HSA immobilized magnetic nanoparticles were synthesized with the process as follows: 10 mL HSA solution was added to the phosphate buffer solution in a round-bottomed flask. Then, 5 g of treated magnetic nanoparticles was immersed in this solution; after mixing for 4 h under vigorous stirring, the resultant materials were separated by a magnet and washed several times with deionized water.2.6. Adsorption experiments
All the adsorption experiments were carried out using a batch adsorption technique. To study adsorption phenomena, a microcentrifuge tube was used and the volume of solution fixed at 1 mL. To perform the experiment the metal solutions were prepared and transferred to microcentrifuge and AMMNPs were added to the solution. To investigate the pH effect, the pH was varied by 0.1 M HCl and NaOH with the temperature maintained at 25 °C. pH measurements were carried out in 10 mL solutions. In all the adsorption experiments, the sorbent dose and ion concentration were fixed at 0.0014 g mL−1 and 10 ppm, respectively.AMMNPs were dispersed in solution by an ultrasonic bath for 10 min and adsorbent separation was carried out using a magnet. All the experiments were repeated twice.
An atomic absorption spectrophotometer was used to find the residual ion concentrations. To evaluation the effect of each parameter the studied parameters were fixed at the previously mentioned level and others were varied. To compare the adsorption efficiency of adsorbent in different conditions the removal percentage and adsorbed concentration per mass of adsorbent, q (mg g−1) were calculated as follows:22
where V is the solution volume, W is the mass of the adsorbent, and Cini and Ce are initial and equilibrium concentration of the cations, respectively.
The isotherms were constructed using Langmuir and Freundlich models. The Langmuir adsorption model assumes that the all adsorption sites of the adsorbent have equal energy, and the adsorbent surface is homogeneous. The linear form of the Langmuir adsorption model is given as follows:
 | (1) |
The dimensionless quantity (f) was calculated to express the adsorption efficiency of the process. The equation is as follows:
 | (2) |
The Freundlich model illustrates the adsorption phenomena based on the heterogeneity of the sorbent surface. In addition, this model considers multilayer adsorption as follows:
| qe = KfCe1/n | (3) |
 | (4) |
3. Results and discussion
3.1. Characterization of MNP
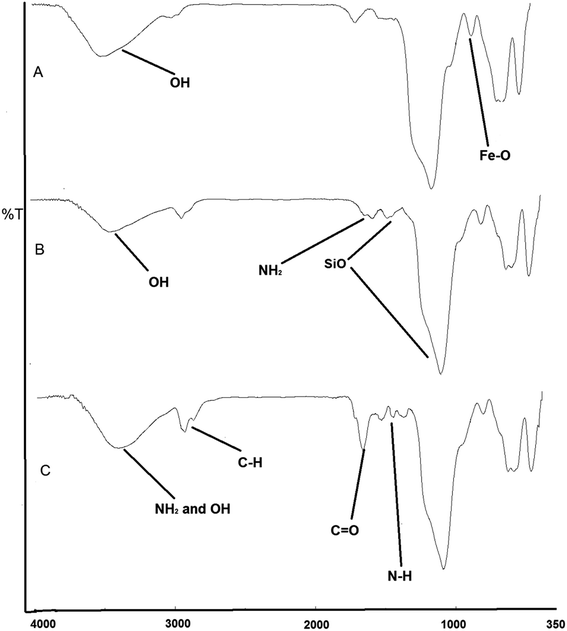
The broad peak at 3300 cm−1 was due to the N–H and O–H stretching mode (amide) of albumin and silica. It was observed that asymmetric and symmetric stretching C–H vibrations of methyl and methylene groups were found around 2932–2867 cm−1. The band at 1661 cm−1 was assigned to C![[double bond, length as m-dash]](https://www.rsc.org/images/entities/char_e001.gif) O stretching vibrations (amide), and the vibration band at 1528 cm−1 was assigned to N–H bending vibrations strongly coupled with C–N stretching of albumin (Fig. 2c).26,27
O stretching vibrations (amide), and the vibration band at 1528 cm−1 was assigned to N–H bending vibrations strongly coupled with C–N stretching of albumin (Fig. 2c).26,27
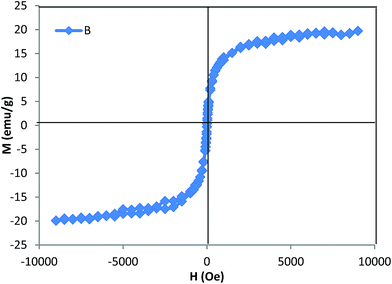
The S shaped behavior indicates the super paramagnetic feature of the adsorbents. In the absence of a magnetic field the magnetization value was zero, and the saturation magnetization was at 18.51 emu g−1, this observation implies that these surface modified MNPs have strong magnetic properties and can be isolated conveniently from a matrix solution using an external magnet.28
3.2. Influence of experimental conditions on the adsorption process
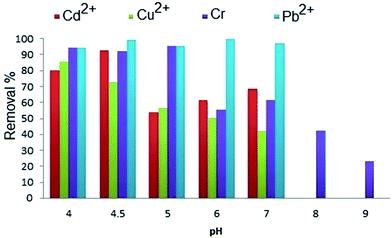
Cd2+ ions were strongly adsorbed in the pH range of 5–7, the surface of the sorbent was positively charged at pH < 5 and the repulsive electrostatic forces became possible between charged species of Cd2+ and the charged MNPs surface, especially protonated carboxylic groups; therefore, the ability as a sorbent for Cd2+ adsorption was decreased, whereas the decrease in adsorption at higher pH may be attributed to the hydrolysis of cadmium ions and also because of competition with hydroxyl groups with the ions. The active sites for copper binding to albumin are N-terminal amines. As shown in Fig. 4, the maximum Cu2+ adsorption occurred at low pH (pH = 4) and the removal percentage was decreased concurrently with pH enhancement. When pH was more than 5, the adsorption efficiency was decreased dramatically. It was expected that increasing the pH would cause an increased adsorption because of the negative charge on N atoms and electrostatic interactions. These results do not imply these facts and this behavior may have been due to the fact that copper precipitation has occurred.30 Varying the pH did not show a distinct change for removal efficiency of Pb2+.
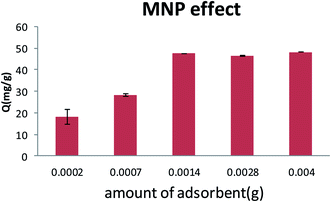
Adsorbent dosage provides more active site and more contact surface area for metal ion adsorption. In contrast, when adsorbent dosage was above 0.0014 g mL−1, the removal percentage variation was slow and therefore adsorption capacity decreased. These behaviors may have been due to adsorption site aggregation that can cause in a decrease in total adsorbent surface area.
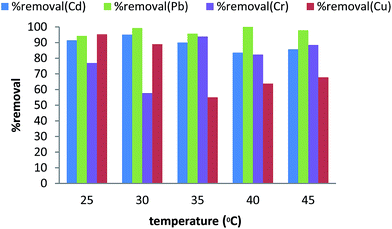
The AMMNPs have a higher chromium adsorption capacity above of 30 °C, which reveals the endothermic nature of the adsorption phenomenon. In the case of Pb2+, the temperature did not show a sensible adsorption effect.
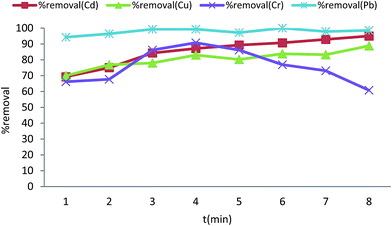 | ||
| Fig. 7 The relationship between ultrasonic time and percent removal at 25 °C for Cd2+, Cu2+, Cr(VI) and Pb2+. | ||
The results for Cr(VI) adsorption show different behavior; the optimal time for Cr(VI) adsorption was 4–5 min. At longer contact times the removal efficiency was decreased. The reason of this phenomenon maybe was the rate of desorption of chromium ions. At times longer than 8 min, the chromium ions have enough time for desorption and ion exchange with other ions can be an important factor for decreasing the adsorption efficiency.
3.3. Adsorption isotherms
Langmuir and Freundlich isotherm models were examined to choose the best fitting one to the obtained experimental data and to represent the mechanism of adsorption.The results in the Tables 1 and 2 show that the data could be fitted better to the Langmuir model than the other isotherm (Fig. 8). The latter fact suggests the adsorption of ions on the surface formed a monolayer. The abovementioned results suggest strongly that the adsorption of metal ions on AMMNs is a chemical type.
| Adsorbed ion | Regression equation | R2 | qmax (mg g−1) | b (L mg−1) |
|---|---|---|---|---|
| Cd2+ | y = 0.102x + 0.016 | 0.993 | 9.803 | 6.375 |
| Cu2+ | y = 0.084x + 0.041 | 0.998 | 11.904 | 2.048 |
| Cr(VI) | y = 0.062x + 0.104 | 0.986 | 16.129 | 0.596 |
| Pb2+ | y = 0.066x + 0.013 | 0.995 | 15.151 | 5.077 |
| Ion | Kf (mg g−1) | n (L g−1) | R2 |
|---|---|---|---|
| Cd2+ | 6.053 | 6.289 | 0.986 |
| Cu2+ | 2.392 | 4.931 | 0.972 |
| Cr(VI) | 5.308 | 2.840 | 0.767 |
| Pb2+ | 13.77 | 2.762 | 0.902 |
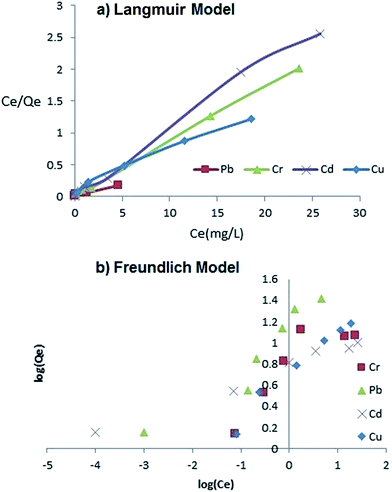 | ||
| Fig. 8 Equilibrium Langmuir (a) and Freundlich (b) isotherms for Cd2+, Cu2+, Cr(VI) and Pb2+ ions adsorption on the AMMNPs at 25 °C. | ||
3.4. Competitive adsorption experiment
To study the effect of other ions on the analyte adsorption, binary solutions were examined. In each experiment, the analyte concentration was constant, whereas the concentration of the other ion was changed from 10 ppm to 30 ppm. The relationship between the removal percentage and the initial concentration of the competitor ion was investigated. The results demonstrated that Cd2+, Cr(VI) and Cu2+ can share active sites and therefore these ions compete with each other to reach the active sites. Oxygen ligands and histidine ligands prepare active sites in HSA. Sadler and Viles demonstrated that Cu2+ had a higher affinity than Cd2+ for their active sites.31 These results are consistent with our observations. The removal percentage for Cu2+ in the presence of Cd2+ was decreased but this effect was not effective compared with resulting decrease of Cd2+ removal in the presence of Cu2+. In addition, the change of concentration of competitor ions caused a variation of removal percentage that can be attributed to changes of ionic strength because of the presence of interfering ions.3.5. Comparison with other adsorbents
To evaluate the efficiency of AMMNPs a comparison with various adsorbents was made for Cr(VI) removal (Table 3). For better assessment, four parameters were compared. Table 3 shows that AMMNPs needed the lowest time for chromium ion removal. In addition, the adsorbent dose of AMMNPs was 1.4 mg mL−1, which was lower than other sorbents. This feature caused the water treatment process to become economical. The most important parameter for comparing adsorbents is the maximum adsorption capacity (qmax), and the table shows that AMMNs and surface modified sand has the greatest qmax value.| Adsorbent | Analyte | Contact time (min) | Initial concentration (mg L−1) | Maximum adsorption capacity (mg g−1) | Adsorbent dose (mg mL−1) | Ref. |
|---|---|---|---|---|---|---|
| Bare magnetic nanoparticles | Cr(VI) | 10 | 5–15 | 3.55 | 4 | 32 |
| Surface modified sand | Cr(VI) | 1440 | 20 | 16.95 | 10 | 33 |
| Fe@Fe2O3 core–shell nanowires | Cr(VI) | — | 8 | 7.78 | 1 | 34 |
| Elaeagnus tree leaves | Cr(VI) | 100 | 10–50 | 10.94 | 10 | 35 |
| Amino starch | Cr(VI) | 120 | — | 12.50 | — | 36 |
| Chitosan coated resin | Cr(VI) | 1440 | 0.4 | 0.03 | — | 37 |
| Amorphous and mesoporous silica | Cr(VI) | 60 | 100 | 3.50 | 6.6 | 38 |
| Silica gelatin composite | Cr(VI) | 160 (h) | 260 | 9.41 | 2 | 39 |
| Porous silica | Cr(VI) | 1440 | 5.2 | 35.51 | 10.4 | 40 |
| HSA | Cr(VI) | 8 | 10 | 16.10 | 1.4 | This work |
3.6. Conclusions
In this study, preparation and modification of magnetic nanoparticles using albumin were performed and their characterizations were obtained. The ability of AMMNPs toward Cr(VI), Cd2+, Pb2+ and Cu2+ ion adsorption was investigated. The obtained results showed a rapid, effective and economically favored adsorption method for the removal of selected ions. The variation of parameters did not show a detrimental effect on Pb2+ adsorption behavior. Because the results presented equally for both cationic and anionic species, it is concluded that the important feature for AMMNPs is simultaneous adsorption of both anions and cations. This property is because of effective functional groups in the albumin structure that were modified on the surface of MNPs. Displaying immobilization of albumin to the surface of MNPs is of significance for magnetic applications in the removal of toxic metal ions from water and wastewaters. Moreover, this adsorbent, because of its high efficiency can be a good candidate for preconcentration of trace levels of the investigated ions prior their determination by conventional analytical methods.References
- G. Crini, Prog. Polym. Sci., 2005, 30, 38–70 CrossRef CAS
.
- A. Luptakova, S. Ubaldini, E. Macingova, P. Fornari and V. Giuliano, Process Biochem., 2012, 47, 1633–1639 CrossRef CAS
.
- N. Misdan, W. Lau and A. Ismail, Desalination, 2012, 287, 228–237 CrossRef CAS
.
- G. Z. Chen, D. J. Fray and T. W. Farthing, Nature, 2000, 407, 361–364 CrossRef CAS PubMed
.
- F. Fu and Q. Wang, J. Environ. Manage., 2011, 92, 407–418 CrossRef CAS PubMed
.
- L. Monser and N. Adhoum, Sep. Purif. Technol., 2002, 26, 137–146 CrossRef CAS
.
- K. Kadirvelu and C. Namasivayam, Adv. Environ. Res., 2003, 7, 471–478 CrossRef CAS
.
- P. Ganesan, R. Kamaraj, G. Sozhan and S. Vasudevan, Environ. Sci. Pollut. Res., 2013, 20, 987–996 CrossRef CAS PubMed
.
- F. Y. Wang, H. Wang and J. W. Ma, J. Hazard. Mater., 2010, 177, 300–306 CrossRef CAS PubMed
.
- S. Veli and B. Alyuz, J. Hazard. Mater., 2007, 149, 226–233 CrossRef CAS PubMed
.
- L. S. Jin, X. F. Chu, G. L. Lin and B. Ying, Adv. Mater. Res., 2008, 383, 6091–6096 Search PubMed
.
- Y. Kong, J. Wei, Z. Wang, T. Sun, C. Yao and Z. Chen, J. Appl. Polym. Sci., 2011, 122, 2054–2059 CrossRef CAS
.
- L. Carro, J. L. Barriada, R. Herrero and M. E. Sastre de Vicente, J. Hazard. Mater., 2011, 192, 284–291 CAS
.
- N. Savage and M. S. Diallo, J. Nanopart. Res., 2005, 7, 331–342 CrossRef CAS
.
- K. Krishnapriya and M. Kandaswamy, Carbohydr. Res., 2010, 345, 2013–2022 CrossRef CAS PubMed
.
- S. Singh, K. C. Barick and D. Bahadur, J. Hazard. Mater., 2011, 192, 1539–1547 CrossRef CAS PubMed
.
- G. E. Fryxell and G.-Z. Cao, Environmental applications of nanomaterials: synthesis, sorbents and sensors, World Scientific, 2012 Search PubMed
.
- A. H. Lu, E. L. Salabas and F. Schuth, Angew. Chem., Int. Ed., 2007, 46, 1222–1244 CrossRef CAS PubMed
.
- M. S. F. C. Adrnlnlstratlon, Lipoproteins, Apolipoproteins, and Lipases, 1994, vol. 45, p. 153 Search PubMed
.
- X. Jiang, L. Huang and X. Liu, Microchim. Acta, 2013, 180, 219–226 CrossRef CAS
.
- X. Liu, J. Xing, Y. Guan, G. Shan and H. Liu, Colloids Surf., A, 2004, 238, 127–131 CrossRef CAS
.
- B. Zhu, N. Ma, D. Wu, Y. Sun and A. W. Li, Ind. Eng. Chem. Res., 2011, 50, 11698–11705 CrossRef CAS
.
- W. Jiang, M. Pelaez, D. D. Dionysiou, M. H. Entezari, D. Tsoutsou and K. O'Shea, Chem. Eng. J., 2013, 222, 527–533 CrossRef CAS
.
- F. Sulek, M. Drofenik, M. Habulin and Z. Knez, J. Magn. Magn. Mater., 2010, 322, 179–185 CrossRef CAS
.
- I. J. Bruce and T. Sen, Langmuir, 2005, 21, 7029–7035 CrossRef CAS PubMed
.
- R. M. Dhoble, S. Lunge, A. G. Bhole and S. Rayalu, Water Res., 2011, 45, 4769–4781 CrossRef CAS PubMed
.
- N. Morishita, H. Nakagami, R. Morishita, S.-i. Takeda, F. Mishima, S. Nishijima, Y. Kaneda and N. Tanaka, Biochem. Biophys. Res. Commun., 2005, 334, 1121–1126 CrossRef CAS PubMed
.
- Z. Ma, Y. Guan and H. Liu, J. Polym. Sci., Part A: Polym. Chem., 2005, 43, 3433–3439 CrossRef CAS
.
- S.-H. Huang and D.-H. Chen, J. Hazard. Mater., 2009, 163, 174–179 CrossRef CAS PubMed
.
- N. D. Tumin, A. L. Chuah, Z. Zawani and S. A. Rashid, J. Eng. Sci. Technol., 2008, 3, 180–189 Search PubMed
.
- P. J. Sadler and J. H. Viles, Inorg. Chem., 1996, 35, 4490–4496 CrossRef CAS PubMed
.
- Y. C. Sharma and V. Srivastava, J. Chem. Eng. Data, 2011, 56, 819–825 CrossRef CAS
.
- S.-M. Lee, W.-G. Kim, C. Laldawngliana and D. Tiwari, J. Chem. Eng. Data, 2010, 55, 3089–3094 CrossRef CAS
.
- Z. Ai, Y. Cheng, L. Zhang and J. Qiu, Environ. Sci. Technol., 2008, 42, 6955–6960 CrossRef CAS PubMed
.
- J. Zolgharnein and A. Shahmoradi, J. Chem. Eng. Data, 2010, 55, 3428–3437 CrossRef CAS
.
- A. Dong, J. Xie, W. Wang, L. Yu, Q. Liu and Y. Yin, J. Hazard. Mater., 2010, 181, 448–454 CrossRef CAS PubMed
.
- P. Pal and F. Banat, J. Nat. Gas Sci. Eng., 2014, 18, 227–236 CrossRef CAS
.
- D. Pérez-Quintanilla, I. del Hierro, M. Fajardo and I. Sierra, Mater. Res. Bull., 2007, 42, 1518–1530 CrossRef
.
- F. Venditti, F. Cuomo, A. Ceglie, L. Ambrosone and F. Lopez, J. Hazard. Mater., 2010, 173, 552–557 CrossRef CAS PubMed
.
- L. Bois, A. Bonhommé, A. Ribes, B. Pais, G. Raffin and F. Tessier, Colloids Surf., A, 2003, 221, 221–230 CrossRef CAS
.
| This journal is © The Royal Society of Chemistry 2016 |


