Improving CO2 permeability of ceramic hollow fibre-supported composite membranes by blending an ionic liquid in the Pebax/PEGDME selective layer
Jun Cheng*,
Leiqing Hu,
Yannan Li,
Chaofan Ji,
Junhu Zhou and
Kefa Cen
State Key Laboratory of Clean Energy Utilization, Zhejiang University, Hangzhou 310027, China. E-mail: juncheng@zju.edu.cn; Fax: +86 571 87951616; Tel: +86 571 87952889
First published on 22nd December 2015
Abstract
To improve the permeation performance of a ceramic hollow fiber-supported poly (amide-b-ethylene oxide) (Pebax)/polyethylene glycol dimethylether (PEGDME) composite membrane during CO2 separation from biohydrogen, a room temperature ionic liquid (RTIL), namely, [P66614][2-Op], with a high CO2 capacity, was adopted to blend in the selective layer. An RTIL-blended selective layer without defects was prepared on the surface of the ceramic hollow fibre. The physicochemical properties and CO2/H2 separation performance of the Pebax/PEGDME/RTIL composite membrane were then compared with those of the Pebax/PEGDME composite membrane. Intermolecular hydrogen bonds were produced after blending RTIL with the Pebax/PEGDME selective layer, and the surface roughness of the composite membrane increased. The CO2 permeation rate increased by ∼35% and reached up to ∼75 GPU at 50 °C, and the CO2/H2 selectivity was maintained at a high value of ∼15 at 30 °C. Blending RTIL with the selective layer inhibited the positive effect of CO2-induced plasticisation on H2 permeability. However, this process improved CO2/H2 selectivity in mixed gases relative to the ideal selectivity by enhancing competitive sorption among gas molecules.
1. Introduction
Hydrogen is a clean energy source suitable for handling the growing demand for fossil fuels and the increasing emissions of CO2 and pollutants from fossil fuel utilisation. Hydrogen can be produced in several modes, of which microbial fermentation shows great potential. The gas mixture produced during anaerobic fermentation is called biohydrogen, which is mainly composed of H2 and CO2 in different proportions depending on the operating conditions.1 The calorific value of biohydrogen is reduced by the CO2 generated, which leads to inefficient direct combustion.2 As such, carbon dioxide must be separated from biohydrogen. Compared with conventional methods for carbon dioxide separation, which are highly energy intensive, membrane-based gas separations feature lower energy consumption, smaller carbon footprint and easier operation procedures.3 To separate CO2 from small gas molecules, such as H2, scholars have developed CO2-philic membranes based on the transport mechanism of solution diffusion. This membrane can be used to reduce recompression and loss of H2 during CO2 separation from biohydrogen.4 Among available CO2-philic membranes, Pebax/PEGs membranes exhibit satisfactory CO2/H2 selectivity and CO2 permeability because they contain numerous ethylene oxide (EO) units, which are the optimal chemical groups for CO2 separation.5A previous study prepared Pebax/PEGDME composite membrane supported on ceramic hollow fibre, which features optimal mechanical, chemical and thermal stability, through dip coating.2 The resultant composite membranes exhibit excellent separation performance. However, the further improvement of CO2 permeation rate by reducing the thickness of the Pebax/PEGDME selective layer is restricted because of the hard formation of a thinner defect-free selective layer on the rough surface of the porous ceramic hollow fibre. Another effective approach used to increase the CO2 permeation rate of gas separation membranes is through the use of room-temperature ionic liquids (RTILs). These salts are molten at temperatures lower than 100 °C, feature chemical and thermal stability and possess high ionic conductivity.6 RTILs can be incorporated into gas separation membranes through two methods. First, RTILs are immobilised into the pores of porous support membranes by capillary force to obtain supported ionic liquid membranes (SILMs).7 However, evaporation of the membrane solution and “washout” of the carrier during the operation render SILMs as unsuitable for practical gas separation.8 Second, polymer/RTIL blend films or selective layers can be prepared by adding a specific amount of RTIL in a polymer solution. Several studies reported that the stability of RTILs in blend films or selective layers is enhanced relative to SILMs, and the permeability of CO2 is improved compared with that of the films or selective layers before adoption of RTILs. Jansen and Friess9,10 prepared polymer/RTIL gel membranes by using p(VDF-HFP)/[EMIM][TFSI] blends. The CO2 permeability of the membranes increased to about 600 Barrer (1 Barrer = 1 × 10⁻¹⁰ cm3 (STP) μm cm−2 s−1 cm Hg−1, where STP is the standard temperature and pressure); moreover, the CO2/H2 selectivity increased to about 12 with an 80% increase in RTIL content. The effect of adding RTIL ([BMIM][CF3SO3]) on the performance of Pebax® 1657 and Pebax® 2533 membranes was also investigated.11 In this study, CO2 permeability increased, whereas CO2/H2 selectivity moderately decreased in Pebax® 1657/RTIL gel membranes relative to those of the Pebax® 1657 membrane. By contrast, CO2 permeability and CO2/H2 selectivity did not significantly change in the Pebax® 2533 membrane after RTIL addition. Chen12 also prepared heterogeneous PVDF/[EMIM][B(CN)4] blend membranes, with a CO2 permeability of 1778 Barrers and a CO2/H2 selectivity of 12.9 in pure gas tests. However, the membranes prepared in these studies are characterised by thick free-standing films, which exhibit not only low CO2 permeation rates but also low mechanical and chemical stability. In addition, the CO2 capacities of the RTILs adopted were not adequately high. Therefore, CO2/H2 separation and permeation performance, as well as mechanical and chemical stability, of the film membranes blended with RTILs must be further enhanced.
In this work, the RTIL [P66614][2-Op] was blended in the thin Pebax/PEGDME selective layer, which exhibits high CO2 permeation rates and CO2/H2 selectivity and is supported by porous ceramic hollow fibre with low permeation resistance and excellent mechanical and chemical stability.2 [P66614][2-Op] is a pyridine-containing anion-functionalised RTIL that possesses higher CO2 capacity (up to 1.60 mol CO2 per mol IL) than other ILs.13 Blending the RTIL in the Pebax/PEGDME selective layer supported by ceramic hollow fibre increased the CO2 permeation rate by ∼35% and reached to ∼75% GPU and maintained a high CO2/H2 selectivity of ∼15 at 30 °C.
2. Experimental
2.1. Materials
Pebax® MH 1657 was provided by Arkema Company. Poly(ethylene glycol) dimethyl ether (PEGDME) (average M.W. 500) was obtained from Sigma-Aldrich Company. The RTIL [P66614][2-Op] was provided by the Department of Chemistry, ZJU-NHU United R&D Centre at Zhejiang University, China. Asymmetric α-Al2O3 ceramic hollow fibres (internal diameter was about 1 mm, external diameter was about 1.4 mm, average pore size of outside layer was 200 nm, and porosity was about 60%) were provided by the State Key Laboratory of Chemical Engineering at Zhejiang University, China. Torr Seal was purchased from Shanghai Passion Auto & Tec Company.2.2. Preparation of Pebax/PEGDME and Pebax/PEGDME/RTIL coating solutions
A Pebax/PEGDME solution was prepared using a method described in a previous study.2 Approximately 1.5 g of Pebax MH 1657 pellets were dissolved in 28.5 g of ethanol/water solvent (70/30, weight ratio). The polymer solution was stirred under reflux at 80 °C for more than 3 h until complete dissolution. After cooling to room temperature, the solution was added with 1.5 g of PEGDME and then stirred for about 1 h at room temperature. The obtained homogeneous solution was filtered through a stainless steel filter with a pore size of 32 μm and was designated as the Pebax/PEGDME coating solution. The solution was then added with RTIL to prepare the Pebax/PEGDME/RTIL coating solution. The mass ratio of RTIL/Pebax in the Pebax/PEGDME/RTIL coating solution was 1/10. The solution was stirred for 0.5 h at room temperature, placed in a microwave bath and vibrated for 15 min to ensure that the RTIL was evenly distributed in the solution.2.3. Fabrication of composite membranes
Composite membranes were fabricated through a three-time dip coating process. One end of the ceramic hollow fibres was inserted and attached to a stainless steel capillary, and the other end was sealed with Torr Seal. The effective lengths of the ceramic hollow fibres were adjusted from 2 cm to 3 cm. After prewetting with deionised water for about 10 s, the ceramic hollow fibres were immersed into a coating solution for 5 s. The hollow fibres were initially rotated and dried at room temperature for 3 h. The dried fibres were then immersed into the coating solution for 5 s, rotated and dried again at room temperature for another 3 h. Finally, the hollow fibres were immersed into the coating solution for 5 s, rotated and dried again at room temperature for more than 12 h. The Pebax/PEGDME or Pebax/PEGDME/RTIL selective layer was then formed on the surface of the porous ceramic hollow fibres.2.4. Membrane characterisation
A Nicolet 5700 Fourier transform infrared (FTIR) spectrometer with a scan range of 4000 cm−1 to 400 cm−1 and a resolution of 0.09 cm−1 was used to obtain the FTIR spectra of the Pebax/PEGDME and Pebax/PEGDME/RTIL selective layers.The thermal stability of the Pebax/PEGDME and Pebax/PEGDME/RTIL selective layers was detected by thermogravimetric analysis (TGA, TA-Q500, USA). The temperature inside the furnace was increased to 800 °C at a rate of 10 °C min−1 under air atmosphere.
The surface morphology of the composite membranes was observed by atomic force microscopy (AFM) in VEECO MultiMode at room temperature.
The junction effectiveness between the different selective layers and ceramic hollow fibre supports, as well as the thickness of the selective layers, were analysed using a Hitachi SU-70 field-emission scanning electron microscope (FESEM, FEG650, FEI, Holland) operated at 3 kV. Prior to the analysis, the two composite membranes were cryogenically fractured in liquid nitrogen and then sputtered with a thin layer of gold.
2.5. Gas permeation experiments
Two types of composite membranes were successively fabricated. Each membrane consisted of two samples with a defect-free selective layer fabricated under similar conditions. The permeation and separation performances of both the Pebax/PEGDME membrane and the Pebax/PEGDME/RTIL membrane were stable with no obvious degeneration during the gas permeation experiments for 15 days. Data were reported as the average value of the two samples measured under similar conditions. Gas permeation measurements were also conducted at different operating temperatures (10–50 °C) and under varied levels of feed pressure (0.01–0.2 MPa) to evaluate the CO2/H2 separation performance of the composite membranes. The operating temperature was measured with a thermometer and controlled in a constant low-temperature bath (Hangzhou David Science Instrument Co., GDC1015, China). The feed pressure was measured with digital pressure gauges (Spectris, DPG409-150A, China) and controlled using throttle valves. Pure CO2, pure H2 and mixed gases containing CO2 and H2 in different proportions were adopted as feed gases. Ar was used as the sweep gas at atmospheric pressure and room temperature. The flow rates of the individual gases were controlled using mass flow controllers (Seven Star, CS200C, China). The composition of the permeate gas was analysed by gas chromatography (Agilent, 7820A, USA). Gas permeability and selectivity were calculated using eqn (1)–(3):14,15| P = D × S | (1) |
| J = P/L = Q/SmΔp | (2) |
 | (3) |
3. Results and discussion
3.1. Membrane characterisation
The FTIR spectra of the Pebax/PEGDME and Pebax/PEGDME/RTIL selective layers are shown in Fig. 1. For the Pebax/PEGDME selective layer, the characteristic peaks at 1733 and 3300 cm−1 represent the stretching vibration of C![[double bond, length as m-dash]](https://www.rsc.org/images/entities/char_e001.gif) O and N–H, respectively, which belong to Pebax.16 Moreover, the intensity of the peaks at 2852 and 1102 cm−1, which correspond to C–H and C–O stretching, respectively, are considerably high because of PEGDME.17 These chemical bonds indicate the physical blending feature and chemical stability of Pebax and PEGDME. Two changes were observed after blending the RTIL [P66614][2-Op] into the Pebax/PEGDME selective layer. First, a peak appears at 2922 cm−1, which represents C–CH3 in the RTIL, in the spectrum of the Pebax/PEGDME/RTIL selective layer. This slight change is attributed to the relatively small amount of RTIL. Second, a broad peak occurs at 3440 cm−1, which indicates the presence of intermolecular hydrogen bonds in the selective layer after RTIL addition. In a hydrogen bond that is typically denoted by X–H⋯Y, X and Y were initially observed to be only the most electronegative elements (viz. N, O or F elements).18 As the RTIL [P66614][2-Op] was blended in polymer matrix, H atom (with no electron) of N–H bonds in Pebax was attracted by O atom (under occupied electron state) of anion [2-Op], thereby producing intermolecular H bonds. Except for these two slight differences, the shape of the FT-IR spectrum of the selective layer after blending with the RTIL is similar to that of the selective layer without the RTIL. Hence, no specific interaction occurred between the polymer matrix and the RTIL.
O and N–H, respectively, which belong to Pebax.16 Moreover, the intensity of the peaks at 2852 and 1102 cm−1, which correspond to C–H and C–O stretching, respectively, are considerably high because of PEGDME.17 These chemical bonds indicate the physical blending feature and chemical stability of Pebax and PEGDME. Two changes were observed after blending the RTIL [P66614][2-Op] into the Pebax/PEGDME selective layer. First, a peak appears at 2922 cm−1, which represents C–CH3 in the RTIL, in the spectrum of the Pebax/PEGDME/RTIL selective layer. This slight change is attributed to the relatively small amount of RTIL. Second, a broad peak occurs at 3440 cm−1, which indicates the presence of intermolecular hydrogen bonds in the selective layer after RTIL addition. In a hydrogen bond that is typically denoted by X–H⋯Y, X and Y were initially observed to be only the most electronegative elements (viz. N, O or F elements).18 As the RTIL [P66614][2-Op] was blended in polymer matrix, H atom (with no electron) of N–H bonds in Pebax was attracted by O atom (under occupied electron state) of anion [2-Op], thereby producing intermolecular H bonds. Except for these two slight differences, the shape of the FT-IR spectrum of the selective layer after blending with the RTIL is similar to that of the selective layer without the RTIL. Hence, no specific interaction occurred between the polymer matrix and the RTIL.
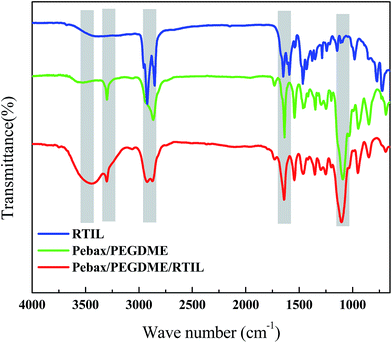 | ||
| Fig. 1 FTIR spectra of room-temperature ionic liquid (RTIL) and the selective layers of Pebax/PEGDME and Pebax/PEGDME/RTIL. | ||
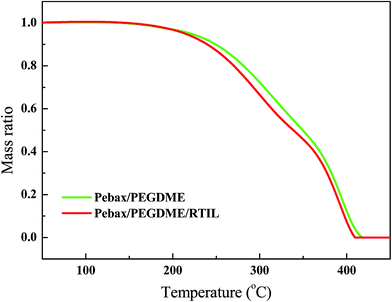
The TGA profiles of the mass of the Pebax/PEGDME and Pebax/PEGDME/RTIL selective layers were compared to provide insights into the pyrolysis behaviour and variations in the thermal performance of the layers (Fig. 2). The weight of both selective layers did not significantly change before the temperature was increased to 170 °C. Hence, the thermal stability of the polymer selective layer was not reduced by blending the RTIL [P66614][2-Op]. As the temperature increased from 200 °C to 400 °C, the mass loss of the Pebax/PEGDME/RTIL selective layer was faster than that of the Pebax/PEGDME selective layer. This difference may be attributed to the evaporation of RTIL in the Pebax/PEGDME/RTIL selective layer, considering that intermolecular H bonds are broken at high temperatures.
The surface characteristics of the ceramic hollow fibre-supported Pebax/PEGDME/RTIL composite membranes were detected through AFM. The findings were then compared with those of the ceramic hollow fibre-supported Pebax/PEGDME composite membranes to determine the effect of incorporating RTIL into the selective layer.
Fifteen 10 μm × 10 μm samples for each composite membrane were tested by AFM. The typical height images of the Pebax/PEGDME and Pebax/PEGDME/RTIL composite membranes are shown in Fig. 3(a) and (b), respectively. The height image of the Pebax/PEGDME/RTIL composite membrane [Fig. 3(b)] exhibited more bright spots with about 330 nm diameter and 300 nm height, which correspond to the highest points of the surface, than those in the Pebax/PEGDME composite membrane [Fig. 3(a)]. The phenomenon was also observed in the corresponding 3D images in Fig. 4(a) and (b). The appearance of numerous protruding points in the 3D image indicates the rough surface of the composite membrane, as evidenced by roughness parameters listed in Table 1, where Rms, Ra and Rmax represent the root-mean-square deviation of height, average deviation of height and maximum height. The Rms, Ra and Rmax values of the Pebax/PEGDME/RTIL composite membrane are 39.15 ± 6.24, 31.47 ± 5.13 and 277.03 ± 34.69 nm, respectively, which are all higher than those of the Pebax/PEGDME composite membrane. The surface roughness of the ceramic hollow fibre-supported composite membrane also increased after incorporating the RTIL into the selective layer. This finding was probably attributed to the formation of intermolecular H bonds between the RTIL and polymer matrix, supported by the experimental evidence of broad peak at 3440 cm−1 of Pebax/PEGDME/RTIL membrane FTIR spectrum. The generation of intermolecular H bonds gradually worsened the fluidity of coating solution on the surface of ceramic hollow fibre with the evaporation of solvent, thereby enhancing the uneven distribution of polymer chains and increasing surface roughness of the selective layer of membrane.
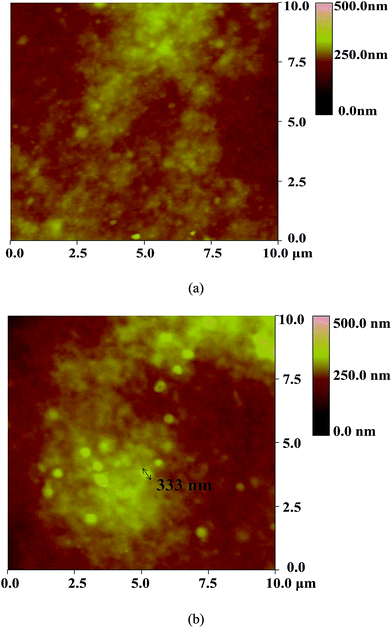 | ||
| Fig. 3 AFM height images of the surfaces of the selective layers of Pebax/PEGDME (a) and Pebax/PEGDME/RTIL (b) supported on ceramic hollow fibres. | ||
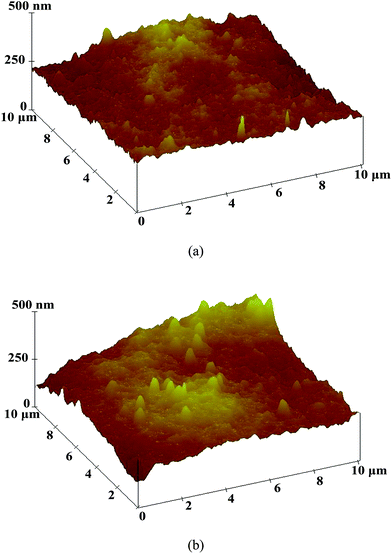 | ||
| Fig. 4 AFM 3D images of the surfaces of the selective layers of Pebax/PEGDME (a) and Pebax/PEGDME/RTIL (b) supported on ceramic hollow fibres. | ||
| Roughness parameters | Rms (nm) | Ra (nm) | Rmax (nm) |
|---|---|---|---|
| a Note: Rms, Ra and Rmax represent the root-mean-square deviation of height, average deviation of height and maximum height, respectively. | |||
| Pebax/PEGDME | 28.97 ± 5.78 | 23.05 ± 4.80 | 209.91 ± 25.11 |
| Pebax/PEGDME/RTIL | 39.15 ± 6.24 | 31.47 ± 5.13 | 277.03 ± 34.69 |
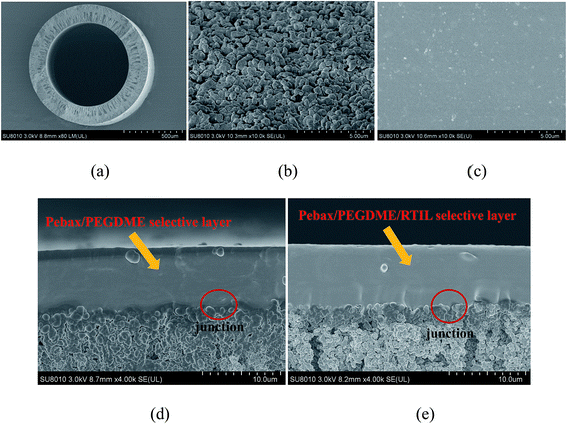
SEM analysis was conducted, and the images of ceramic hollow fibre support, as well as the typical cross-sectional images of the Pebax/PEGDME and Pebax/PEGDME/RTIL composite membranes are shown in Fig. 5. Fig. 5(a) shows the cross-section of ceramic hollow fibre support. Meanwhile, the difference of membrane surface before and after coating with a selective layer was shown in Fig. 5(b) and (c). From Fig. 5(d) and (e), it can be seen that the Pebax/PEGDME and Pebax/PEGDME/RTIL selective layers adhered closely to the ceramic hollow fibre support, and no gaps were observed in the cross section. No obvious interface layer was also formed after the penetration of the polymer solution into the ceramic support because the support was prewetted by deionised water before coating the selective layers. Table 2 lists the thicknesses of the selective layers, which were calculated based on 48 sample points obtained from 24 cross-sectional images for each composite membrane. The thicknesses of the two selective layers slightly varied; however, the thickness fluctuation of the Pebax/PEGDME/RTIL selective layer is larger than that of the Pebax/PEGDME selective layer. These results indicate that RTIL addition hindered the uniform distribution of the selective layer on the ceramic support. After intermolecular hydrogen bonds were generated after blending with RTIL, the viscosity of the coating solution increased, thereby weakening the positive effect of rotation on the uniform distribution of the layer during the three-time coating process.
| Type of selective layer | Pebax/PEGDME | Pebax/PEGDME/RTIL |
|---|---|---|
| Mean thickness (μm) | 7.73 ± 0.27 | 7.49 ± 0.99 |
| Maximum thickness (μm) | 9.78 | 17.00 |
| Minimum thickness (μm) | 6.01 | 3.67 |
3.2. Effect of feed pressure
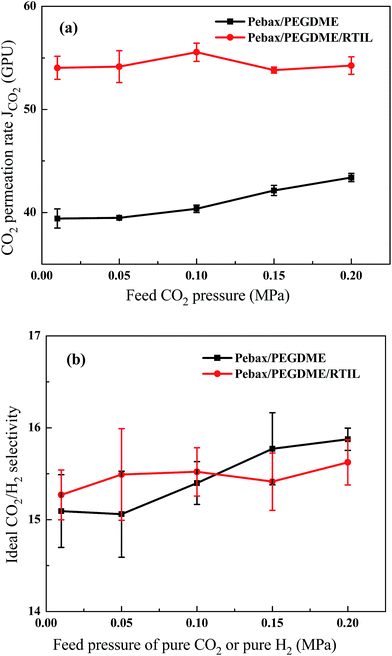
Fig. 6 shows the differences in CO2/H2 permeation and separation performances between the ceramic hollow fibre-supported Pebax/PEGDME and Pebax/PEGDME/RTIL composite membranes. Fig. 6(a) shows that the CO2 permeation rate of the Pebax/PEGDME/RTIL composite membrane is higher by about 35% than that of the Pebax/PEGDME composite membrane. Previous studies reported that CO2 permeability rate increases after blending RTIL into selective polymeric materials.11,15,19 In the present study, the tightness of the Pebax/PEGDME polymer chains weakened in the presence of free RTIL in the selective layer, thereby leading to numerous flexible polymer chains. Fractional free volume (FFV) in the selective layer also increases with increasing chain mobility in the polymer matrix,12 which results in enhanced gas diffusivity in the composite membranes. In addition, [P66614][2-Op] features high CO2 capacity and solubility; as such, incorporation of this RTIL improved the CO2 solubility of the selective layer. Moreover, the rough surface of the Pebax/PEGDME/RTIL composite membrane provided a large area for the sorption of gas molecules. In this regard, the CO2 permeability of the composite membranes increased upon RTIL incorporation because of enhanced CO2 diffusivity and solubility of the selective layer. Meanwhile, CO2/H2 selectivity slightly fluctuated after blending with RTIL [Fig. 6(b)], which could be due to increase in H2 diffusivity with increasing FFV of the selective layer. Consequently, H2 permeability was improved to a similar extent to that of CO2, and the CO2/H2 selectivity of [P66614][2-Op] approximated that of the Pebax/PEGDME selective layer.The effect of feed pressure on the Pebax/PEGDME and Pebax/PEGDME/RTIL composite membranes is presented in Fig. 6(a) and (b), respectively. For the membrane without RTIL, both CO2 permeation and CO2/H2 selectivity increased with increasing feed pressure. This phenomenon is consistent with the gas permeation performance in rubbery polymeric membranes or selective layers.20,21 In particular, the CO2 permeation rate increased from 39.4 GPU to 43.4 GPU as the feed pressure increased from 0.01 MPa to 0.2 MPa. For strongly condensable gas molecules, such as CO2, high penetrant concentrations can plasticise the polymer matrix by increasing the polymer local segmental mobility, thereby enhancing diffusivity and permeability.21 Hardly the mechanism of permeability improvement is worked on lowly condensable gas molecules, such as H2. Therefore, in the present study, CO2 permeability and CO2/H2 selectivity were improved by increasing feed pressure. However, CO2 permeation and CO2/H2 selectivity in the Pebax/PEGDME/RTIL composite membranes were not affected by feed pressure. This finding could be due to reduced effect of feed pressure as a result of the high mobility of the polymeric chains after blending RTIL into the polymer selective layer.
3.3. Effect of operating temperature
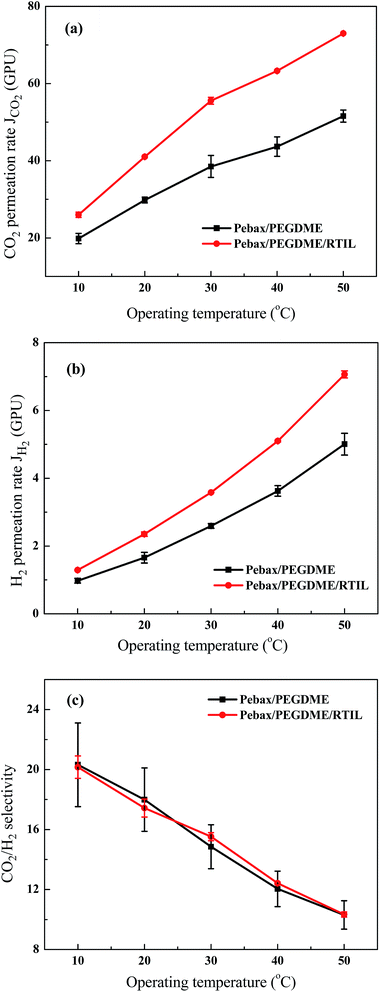
The operating temperature positively affects the permeation of the Pebax/PEGDME and Pebax/PEGDME/RTIL composite membranes, as shown in Fig. 7(a) and (b), respectively. For example, the CO2 permeation rates of the Pebax/PEGDME and Pebax/PEGDME/RTIL membranes increased from about 20 GPU to 52 GPU and from 26 GPU to 73 GPU, respectively. Moreover, the H2 permeation rates of both membranes almost linearly increased with increasing temperature. These results are similar to those obtained in a previous study,2 and the enhanced permeation could be due to two major reasons. First, the thermodynamic energy of gas molecules increases with increasing temperature, thereby increasing the mobility of gas molecules increases and consequently enhancing the driving force for diffusion. Second, increase in the operating temperature leads to the formation of flexible polymer chains, which create numerous free volume cavities for molecular transport.17 Furthermore, the difference in permeation rates between the Pebax/PEGDME and Pebax/PEGDME/RTIL membranes increased by increasing the operating temperature, as shown in Fig. 7(a) and (b), respectively. For instance, the JH2 ratio of the Pebax/PEGDME/RTIL and Pebax/PEGDME membrane increased from ∼132% (∼1.29/0.98) at 10 °C to 138% (∼3.58/2.59) at 30 °C and then to 141% (∼7.06/5.00) at 50 °C. These changes could be attributed to the destruction of the intermolecular hydrogen bonds of [P66614][2-Op] in the Pebax/PEGDME/RTIL selective layer with increasing temperature, thereby increasing FFV in the selective layer. Consequently, the increase in the permeability of the Pebax/PEGDME/RTIL membrane became more evident than that of the Pebax/PEGDME membrane.Fig. 7(c) indicates that the CO2/H2 separation performances of the two membranes were enhanced by decreasing the operating temperature. Specifically, both values of CO2/H2 selectivity increased from approximately 10 to 20 as the operating temperature decreased from 50 °C to 10 °C. CO2 solubility was also enhanced by increasing the CO2 absorption of RTIL, as well as the affinity and interaction between the CO2 molecules and the PEO segments in Pebax and PEGDME; this phenomenon increased the solubility of CO2/H2 at low temperatures and improved CO2/H2 selectivity.13,15,22
3.4. Effect of gas component
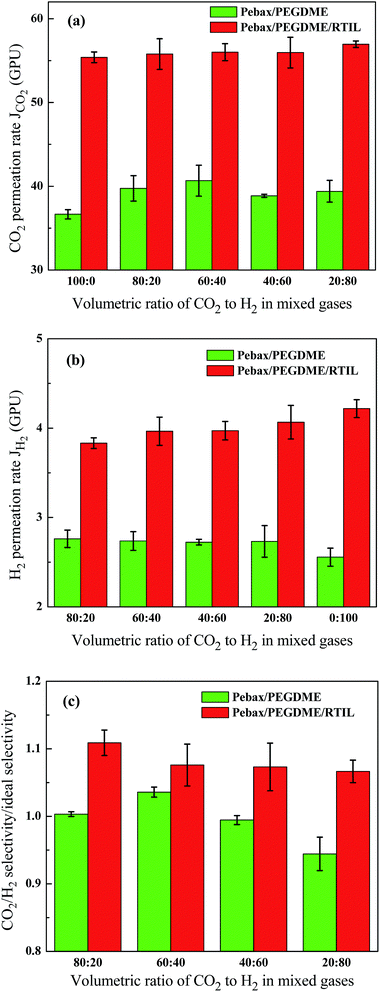
Numerous studies demonstrated that the permeability and selectivity of CO2-philic membranes be changed in a mixed gas environment containing CO2, relative to in a pure gas environment.2,20 This observation is mainly attributed to CO2-induced plasticisation on polymer materials and the competitive sorption between different gases in the gas mixture. CO2-induced plasticisation enhances the local segmental mobility of polymer chains, thereby increasing FFV in selective materials. The diffusivity and permeability of other gases or gases in the mixed gas are consequently improved. The occurrence of competitive sorption in the gas mixture indicates that the presence of the “slow” gas can reduce the permeability of the “fast” gas; conversely, the presence of the fast gas increases the permeability of the slow gas.23,24 The concepts of “fast” and “slow” depend on diffusivity.2The effect of gas components (CO2 and H2) on the permeation and separation performances of the Pebax/PEGDME and Pebax/PEGDME/RTIL membranes was further investigated (Fig. 8). Changes in the gas composition exhibited varied influences on the two membranes. For the Pebax/PEGDME membrane, CO2 permeation first increased and then deceased with increasing ratio of H2 composition [Fig. 8(a)]. This variation trend is attributed to the competitive sorption between CO2 and H2 gas molecules and the partial pressure of CO2. On one hand, the diffusivity of small H2 molecules is higher than that of large CO2 molecules; hence, the presence of H2 improved CO2 diffusivity and accelerated CO2 permeation for the competitive sorption in CO2/H2 mixed gases. On the other hand, the partial pressure of CO2 in mixed gases decreased with increasing amount of the H2 gas component, thereby decreasing CO2 permeation rate [Fig. 6(a)]. These results suggest that the negative effect of decreasing CO2 partial pressure is compensated by the positive effect of competitive sorption under conditions with increasing CO2 gas composition; however, the opposite occurs under conditions with decreasing CO2 gas composition. As such, an increase in CO2 permeation is followed by a decrease in CO2 permeation. In addition, the H2 permeation rates in mixed gases are ∼2.73 GPU, which is higher than the permeation rate of pure hydrogen (∼2.56 GPU), as shown in Fig. 8(b). The increased permeability of H2 in mixed gases could be due to CO2-induced plasticisation on the polymer selective layer.25 Meanwhile, this effect of CO2-induced plasticisation was weakened by the negative influence of competitive sorption on the CO2/H2 mixture. Therefore, H2 permeation rate does not differ between CO2/H2 mixed gases with different gas compositions. These results further indicate that variation in CO2/H2 selectivity [Fig. 8(c)] is similar to that in the CO2 permeation rate [Fig. 8(a)] with increasing H2 volume ratio in the CO2/H2 mixture. In mixed gases with high CO2 ratio, CO2 permeability was more highly enhanced than H2 permeability with respect to the permeability of pure CO2 or pure H2, which results in higher CO2/H2 selectivity than the optimal CO2/H2 selectivity.
For the Pebax/PEGDME/RTIL composite membrane, the local segmental mobility of polymer chains and FFV of the selective layer were considerably enhanced by blending with RTIL, thereby weakening the effect of CO2-induced plasticisation. The effect of competitive sorption became evident, as shown in Fig. 8(a) and (b). Both CO2 and H2 permeation rates increased moderately with more H2 and less CO2 contents in the mixed gases. As such, CO2/H2 selectivity gradually decreased with increasing H2 volume ratio in the mixed gases, whereas CO2/H2 selectivity in the CO2/H2 mixture was consistently higher than ideal CO2/H2 selectivity. These findings contradict the results reported in most studies, which demonstrate reduced CO2/H2 selectivity in CO2/H2 mixed gases.20
3.5. Performance of the membranes on CO2/CH4 separation
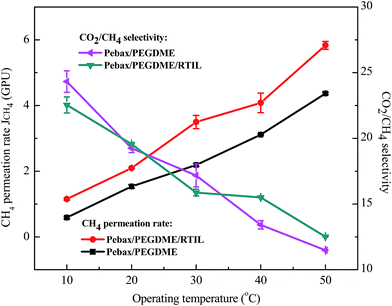
The permeation and separation performances of both the Pebax/PEGDME and the Pebax/PEGDME/RTIL composite membranes on CO2/CH4 separation were also studied, as shown in Fig. 9. At 30 °C, the CH4 permeation rates of the Pebax/PEGDME membrane and the Pebax/PEGDME/RTIL membrane were about 2.2 GPU and 3.5 GPU, respectively. Meanwhile, CO2/CH4 separation performance of the two membranes was similar. The CH4 permeation of both the two membranes increased with the increasing temperature, while the CO2/CH4 selectivity worsened. The reason for the phenomenon is same as the reason for temperature's effect on H2 permeation and CO2/H2 selectivity.3.6. Stabilities of the membranes
The stabilities of the Pebax/PEGDME membranes with and without RTIL blending were shown in Fig. 10. The feed gas was mixture containing 40% CO2 and 60% H2. The feed pressure and operating temperature were controlled at 0.1 MPa and 30 °C, respectively. The stability tests were conducted for 15 days. It was indicated in Fig. 10 that the permeation and separation performances of both the Pebax/PEGDME and Pebax/PEGDME/RTIL membranes were stable with no obvious change. Therefore, the blend of RTIL did not have a negative effect on the stability of polymer selective layer on ceramic hollow fibre.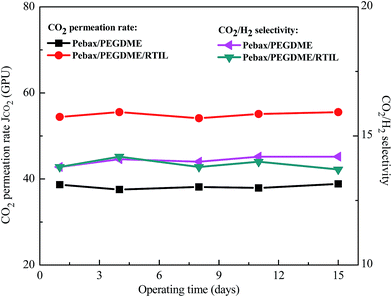 | ||
| Fig. 10 Performance stabilities of Pebax/PEGDME and Pebax/PEGDME/RTIL composite membranes (feed gas: 40% CO2, 60% H2; feed pressure: 0.1 MPa; operating temperature: 30 °C). | ||
3.7. Comparison of separation performance
A number of techniques, including blending RTIL into CO2-philic materials and blending materials with high EO group content, have been developed to fabricate membranes for CO2/H2 separation.5,9,11,12 As shown in Fig. 11, all CO2/H2 separation performances either approach or surpass the upper bound line proposed by Freeman et al.4 Both Pebax/PEGDME and Pebax/PEGDME/RTIL selective layers in the present study exhibited high CO2/H2 selectivity because of high amounts of the EO group in Pebax/PEGDME.5 However, the CO2 permeability of the selective layers is not as satisfactory as CO2/H2 selectivity. The permeation resistance of the ceramic hollow fibre support as well as the junction points between the support and the selective layers were not removed because the CO2 permeability values of the two selective layers were calculated by adopting the thickness values of selective layers measured by SEM. Therefore, the CO2 permeability of the two selective layers was underestimated to a certain extent. In summary, both Pebax/PEGDME and Pebax/PEGDME/RTIL selective layers supported by ceramic hollow fibres exhibited permeation and separation performances exceeding those of the upper bound lines.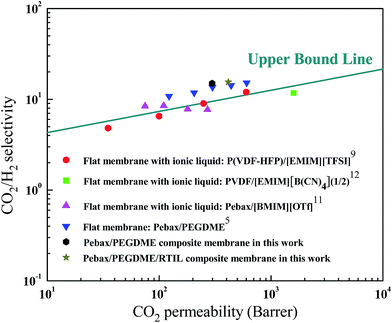 | ||
| Fig. 11 Pure gas permeation results compared with the upper bound (note: the feed pressure and operating temperature of the two points in this work were 0.1 MPa and 30 °C, respectively). | ||
4. Conclusion
Blending the RTIL [P66614][2-Op] in the Pebax/PEGDME selective layer supported by porous ceramic hollow fibre increased the CO2 permeation rate by ∼35% and reached up to ∼75 GPU at 50 °C, and maintained a high CO2/H2 selectivity of ∼15 at 30 °C. The effects of CO2-induced plasticisation on the polymer matrix were reduced, whereas those of the competitive sorption between gas molecules in the mixed gases were enhanced. This phenomenon could be due to increased FFV in the selective layer, which was induced by adding RTIL. Therefore, the CO2 permeability of the Pebax/PEGDME/RTIL composite membrane was not influenced by feed pressure, and CO2/H2 selectivity in the mixed gases exceeded the ideal CO2/H2 selectivity. This study reveals that increasing the operating temperature improved the permeation but reduced the separation performance of CO2/H2.Acknowledgements
This study was supported by the National Science Foundation-China (51176163, 51476141), Zhejiang Provincial Natural Science Foundation-China (LR14E060002), National Key Technology R&D Program of China (2015BAD21B01).References
- J. E. Ramirez-Morales, E. Tapia-Venegas, N. Nemestothy, P. Bakonyi, K. Belafi-Bako and G. Ruiz-Filippi, Int. J. Hydrogen Energy, 2013, 38, 14042–14052 CrossRef CAS.
- J. Cheng, L. Q. Hu, C. F. Ji, J. H. Zhou and K. F. Cen, RSC Adv., 2015, 5, 60453–60459 RSC.
- Z. X. Kang, M. Xue, L. L. Fan, L. Huang, L. J. Guo, G. Y. Wei, B. L. Chen and S. L. Qiu, Energy Environ. Sci., 2014, 7, 4053–4060 CAS.
- H. Q. Lin, E. van Wagner, B. D. Freeman, L. G. Toy and R. P. Gupta, Science, 2006, 311, 639–642 CrossRef CAS PubMed.
- W. Yave, A. Car and K. V. Peinemann, J. Membr. Sci., 2010, 350, 124–129 CrossRef CAS.
- S. U. Hong, D. Park, Y. Ko and I. Baek, Chem. Commun., 2009, 7227–7229, 10.1039/b913746g.
- P. Cserjesi, N. Nemestothy and K. Belafi-Bako, J. Membr. Sci., 2010, 349, 6–11 CrossRef CAS.
- S. Yoo, J. Won, S. W. Kang, Y. S. Kang and S. Nagase, J. Membr. Sci., 2010, 363, 72–79 CrossRef CAS.
- J. C. Jansen, K. Friess, G. Clarizia, J. Schauer and P. Izak, Macromolecules, 2011, 44, 39–45 CrossRef CAS.
- K. Friess, J. C. Jansen, F. Bazzarelli, P. Izak, V. Jarmarova, M. Kacirkova, J. Schauer, G. Clarizia and P. Bernardo, J. Membr. Sci., 2012, 415, 801–809 CrossRef.
- P. Bernardo, J. C. Jansen, F. Bazzarelli, F. Tasselli, A. Fuoco, K. Friess, P. Izak, V. Jarmarova, M. Kacirkova and G. Clarizia, Sep. Purif. Technol., 2012, 97, 73–82 CrossRef CAS.
- H. Z. Chen, P. Li and T. S. Chung, Int. J. Hydrogen Energy, 2012, 37, 11796–11804 CrossRef CAS.
- X. Y. Luo, Y. Guo, F. Ding, H. Q. Zhao, G. K. Cui, H. R. Li and C. M. Wang, Angew. Chem., Int. Ed., 2014, 53, 7053–7057 CrossRef CAS.
- N. Y. Du, H. B. Park, M. M. Dal-Cin and M. D. Guiver, Energy Environ. Sci., 2012, 5, 7306–7322 CAS.
- H. Z. Chen, Z. W. Thong, P. Li and T. S. Chung, Int. J. Hydrogen Energy, 2014, 39, 5043–5053 CrossRef CAS.
- H. Rabiee, M. Soltanieh, S. A. Mousavi and A. Ghadimi, J. Membr. Sci., 2014, 469, 43–58 CrossRef CAS.
- S. F. Wang, Y. Liu, S. X. Huang, H. Wu, Y. F. Li, Z. Z. Tian and Z. Y. Jiang, J. Membr. Sci., 2014, 460, 62–70 CrossRef CAS.
- M. Goswami and E. Arunan, Phys. Chem. Chem. Phys., 2009, 11, 8974–8983 RSC.
- P. Li, D. R. Paul and T. S. Chung, Green Chem., 2012, 14, 1052–1063 RSC.
- A. Car, C. Stropnik, W. Yave and K. V. Peinemann, Sep. Purif. Technol., 2008, 62, 110–117 CrossRef CAS.
- H. Lin and B. D. Freeman, J. Membr. Sci., 2004, 239, 105–117 CrossRef CAS.
- H. Q. Lin and B. D. Freeman, Macromolecules, 2005, 38, 8394–8407 CrossRef CAS.
- C. R. Antonson, R. J. Gardner, C. F. King and D. Y. Ko, Ind. Eng. Chem. Proc. Des. Dev., 1977, 16, 463–469 CAS.
- T. Visser, G. H. Koops and M. Wessling, J. Membr. Sci., 2005, 252, 265–277 CrossRef CAS.
- S. R. Reijerkerk, K. Nijmeijer, C. P. Ribeiro, B. D. Freeman and M. Wessling, J. Membr. Sci., 2011, 367, 33–44 CrossRef CAS.
| This journal is © The Royal Society of Chemistry 2016 |

