Porous carbon nanoflakes with a high specific surface area derived from a kapok fiber for high-performance electrode materials of supercapacitors

Weibing Xuab, Bin Mua and Aiqin Wang*a
aState Key Laboratory of Solid Lubrication, Center of Eco-Materials and Green Chemistry, Lanzhou Institute of Chemical Physics, Chinese Academy of Sciences, Lanzhou 730000, China. E-mail: aqwang@licp.cas.cn; Fax: +86 931 8277088; Tel: +86 931 4968118
bUniversity of the Chinese Academy of Sciences, Beijing 100049, P. R. China

Received 27th October 2015 , Accepted 7th January 2016

First published on 12th January 2016


Abstract

Well-defined porous carbon nanoflakes with a high specific surface area have been successfully prepared via pyrolytic carbonization and alkali activation treatment of an easily available kapok fiber. The details of alkali–carbon ratio, activation temperature, and activation time are optimized according to the specific surface area and the specific capacitance of the as-prepared samples. The porous carbon nanoflakes prepared at 700 °C for 2 h with an alkali carbon ratio of 5[thin space (1/6-em)]:[thin space (1/6-em)]1 possess a high specific surface area of 1634.5 m2 g−1. The specific capacitance can reach 430 F g−1 at a current density of 0.5 A g−1 in a 1.0 M H2SO4 electrolyte, and an excellent cycle stability with no obvious decrease is observed after 5000 cycles. In addition, the assembled symmetrical supercapacitor base on the sample exhibits an energy density of 7.85 W h kg−1 at a power density of 125 W kg−1. The favourable capacitive performances indicate that the low-cost kapok fiber can serve as a new resource of carbonaceous materials for high-performance supercapacitors.

Introduction

With the ever-growing consumption of fossil energy and the concomitant environmental pressure, it is necessary to develop reliable and sustainable energy sources without polluting emissions. Supercapacitors, known as electrochemical capacitors, with high power density, high specific capacitance and excellent cycling stability have received considerable attention due to the increasing demand of energy storage devices.1,2 Based on their charge-storage mechanism, supercapacitors can be classified as pseudo-capacitors and electrical double-layer capacitors (EDLCs).3,4 The stored electrical energy of transition metal oxides and conducting polymers is based on redox reactions.5–7 However, the pseudo-capacitors using transition metal oxides and conducting polymers possess poor cycle stability and rate capability despite the high energy density and specific capacitance.8 Thus, research has been focused on increasing the energy density without sacrificing the cycle life or high power density. The capacitance for EDLC comes from the pure electrostatic charge accumulation at the electrode/electrolyte interface, which is greatly dependent on the surface area of the electrode materials that is accessible to electrolyte ions.9 Porous carbonaceous materials with tunable porosities and large specific surface area have been extensively used as electrode materials for EDLCs because of the excellent cycle stability and good conductivity.10 Recently, nanostructured carbon materials, including activated carbons,11 ordered mesoporous carbons,12 carbon aerogels,13 graphene-based materials14 have shown high EDLCs performances. Among all the carbon materials, activated carbon is considered as one of the most attractive candidates for supercapacitors due to its high specific surface area, well-developed porous structure, high electrical conductivity and electrochemical stability.15 However, activated carbons are prepared mainly from the fossil fuel and their derivatives that are expensive and non-renewable. Therefore, the development of low-cost carbon materials from the renewable raw materials is very worthwhile.

Biomass represents a large class of cheap, easily available and renewable carbonaceous substances widely distributed on our planet that sustains the global water and carbon cycles.16 Up to now, a wide variety of waste biomass materials, including tea leaves, coconut shell, rice husk, bamboo, waste newspaper etc., have been utilized as carbon precursors to prepare porous carbonaceous materials, which show the great potential as electrode materials for supercapacitors.17–21 Kapok fiber (KF), an agricultural product, is obtained from the fruits of the kapok tree,22 and is a kind of single-cell natural cellulose fiber with about cellulose, lignin, xylan, and wax.23 Conventionally, KF is used as stuffing for bedding, upholstery, life preservers and other water-safety equipment because of its excellent buoyancy and for insulation against sound.23 It is worth noting that KF shows a significantly homogeneous hollow tubular and large lumen shape with ca. 8–10 μm in diameter and ca. 0.8–1.0 μm in wall thickness. Taken into account of the possible high surface area associated with the hollow tubular structure, the carbonization of the low-cost KF can achieve the resource utilization of KF for supercapacitor electrode materials. Therefore, KF is employed as a raw feedstock for the synthesis of porous carbon nanoflakes (CNF) by pyrolysis and subsequent alkali activation. The detailed alkali–carbon ratio, activation temperature, and activation time are investigated. The optimum activation condition is determined according to the results of the specific surface area and specific capacitance. The as-prepared high porous CNF exhibits a high BET surface area with an overwhelming fraction of micropores, so the application performances in capacitive energy storage are further tested and analyzed.

Experiments

Materials

KF is purchased from Shanghai Pan-Da Co., Ltd., China. NaClO2 (chemically pure) was provided by Beijing Hue-Wei Chemical Reagent Co., China. Acetic acid (HAc, Analytical grade) was received from Shanghai Chemical Reagent Factory, Shanghai, China. KOH and other reagents are all of analytical reagent grade from Tianjin Chemical Co., China, and used without further purification. Ultrapure water (18.25 MΩ cm) was used throughout.

Synthesis of CNF

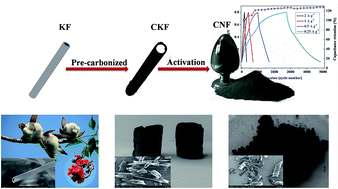
The typical synthesis process is illustrated in Scheme 1. As a facile and scalable synthesis method, the porous CNF derived from KF is prepared as follows. Firstly, KF is pretreated with NaClO2 solution to remove the waxy coating and create a hydrophilic surface, and the NaClO2 pretreated KF is donated as TKF. The cleaned TKF are cut to fine debris (∼5 mm long) and pre-carbonized at 700 °C for 2 h under a nitrogen atmosphere, and the pre-carbonized sample is marked as CKF. The obtained CKF are then mixed with a certain amount of KOH, and pyrolyzed in a ceramic crucible at different temperatures for different time with a heating rate of 5 °C min−1 under a nitrogen atmosphere, respectively. The weight ratio of KOH to CKF is described as alkali carbon ratio. The resulting dark solid is washed with 1.0 M HCl solution and then thoroughly washed with distilled water. The ultimate residue is collected and dried at 80 °C in a vacuum. The preparation conditions of samples are summarized in Table 1.
image file: c5ra22469a-s1.tif
Scheme 1 Schematic illustration for the preparation of CNF.
Table 1 The conditions of the sample preparation
Samples Alkali–carbon ratio Temperature (°C) Time (h)
CNF-1 1[thin space (1/6-em)]:[thin space (1/6-em)]1 700 1
CNF-2 2[thin space (1/6-em)]:[thin space (1/6-em)]1 700 1
CNF-3 3[thin space (1/6-em)]:[thin space (1/6-em)]1 700 1
CNF-4 4[thin space (1/6-em)]:[thin space (1/6-em)]1 700 1
CNF-5 5[thin space (1/6-em)]:[thin space (1/6-em)]1 700 1
CNF-6 6[thin space (1/6-em)]:[thin space (1/6-em)]1 700 1
CNF-7 5[thin space (1/6-em)]:[thin space (1/6-em)]1 600 1
CNF-8 5[thin space (1/6-em)]:[thin space (1/6-em)]1 800 1
CNF-9 5[thin space (1/6-em)]:[thin space (1/6-em)]1 900 1
CNF-10 5[thin space (1/6-em)]:[thin space (1/6-em)]1 700 0.5
CNF-11 5[thin space (1/6-em)]:[thin space (1/6-em)]1 700 2
CNF-12 5[thin space (1/6-em)]:[thin space (1/6-em)]1 700 3
CKF


Characterization

A Bruker IFS66v/sIR spectrometer (Bruker, Karlsruhe, Germany) is used for the Fourier transformed infrared (FTIR) analysis in the range of 400 to 4000 cm−1 with the resolution of 4 cm−1. The morphologies of TKF, CKF, and CNF samples are characterized using an S-4800 field emission scanning electron microcopy (SEM) (HITACHI, Tokyo, Japan), respectively. The chemical composition and distribution of the products are obtained by energy dispersive X-ray spectroscopy (EDS). Thermogravimetric analysis (TGA) is performed on a Perkin Elmer STA6000 thermogravimetric analyzer at a heating rate of 20 °C min−1 under a dry oxygen purge with a flow rate of 200 mL min−1. X-ray diffraction spectrographs analysis (XRD) is conducted using an X-ray powder diffractometer with a Cu anode (PAN analytical Co. X'pertPRO), running at 40 kV and 30 mA. The X-ray photoemission spectroscopy (XPS) analyses are carried out with X-ray photoelectrometer (K-Alpha-surface Analysis, Thermon Scientific) with a hemispherical energy analyser and using a monochromatic Al Kα X-ray source (1361 eV). The Raman spectra (Raman) are recorded with an inVia Renishaw Raman spectrometer system (HR Micro Raman spectrometer, Horiba JOBIN YVON US/HR800 UV) equipped with a 632.8 nm wavelength laser. Nitrogen sorption analysis is carried out using an ASAP 2020 accelerated surface area and porosimetry instrument (Micromeritics), equipped with an automated surface area, at 77 K using Brunauer–Emmett–Teller (BET) calculations for the surface area. The pore size distribution plots were recorded from the desorption branch of the isotherms based on the Barrett–Joyner–Halenda (BJH) model.

Electrochemical analysis

Electrochemical experiments were carried out in a three-electrode beaker cell with a standard calomel electrode (SCE) reference electrode. The working electrodes are prepared by mixing the obtained CNF, carbon black and polytetrafluoroethylene at a weight ratio of 80[thin space (1/6-em)]:[thin space (1/6-em)]10[thin space (1/6-em)]:[thin space (1/6-em)]10 and pressed on stainless steel. The electrochemical behaviour of the working electrodes is evaluated by cyclic voltammetry (CV), galvanostatic charge–discharge (GCD) and electrochemical impedance spectroscopy (EIS) using a CHI660E electrochemical working station 1.0 M H2SO4 aqueous electrolyte. CV tests are performed in the potential window ranging from 0 to 0.8 V (vs. SCE) at 10, 40, 80 and 100 mV s−1. EIS measurements are carried out in the frequency range from 100 kHz to 0.005 Hz at open circuit potential with a perturbation of 5 mV. The capacitance was calculated from the discharge curves, according to the eqn (1):24
 
image file: c5ra22469a-t1.tif(1)
where Cs is the specific capacitance, I mean the constant discharge current, t is the discharge time, m equals to the mass of active materials in a single electrode, and V is the discharge voltage.

Result and discussion

The effect factors for the preparation of porous CNF

It is well-known that the activation conditions such as alkali–carbon ratio, activation temperature and activation time has greatly effects on the specific surface area and the electrochemical property of the carbon materials. Therefore, the activation conditions are optimized firstly according to the results of specific surface area and specific capacitance. The specific capacitances of all these samples are calculated used GCD curves according to the eqn (1). The GCD test of these samples is carried out at current density 0.5 A g−1 within the potential range from 0 to 0.8 V in 1.0 M H2SO4 electrolyte, as depicted in Fig. S1.

The alkali–carbon ratio is first optimized at 700 °C for 1 h, and the alkali–carbon ratio are selected to be 1[thin space (1/6-em)]:[thin space (1/6-em)]1, 2[thin space (1/6-em)]:[thin space (1/6-em)]1, 3[thin space (1/6-em)]:[thin space (1/6-em)]1, 4[thin space (1/6-em)]:[thin space (1/6-em)]1, 5[thin space (1/6-em)]:[thin space (1/6-em)]1, and 6[thin space (1/6-em)]:[thin space (1/6-em)]1, respectively (Table 1). The GCD curves of the samples activated using different alkali–carbon ratio are presented in Fig. S1a, and the specific capacitance are summarized in the Table 2. It can be clearly seen that the specific capacitance increases with increase in the alkali–carbon ratio, and reaches the maximum value of 330.5 F g−1 while the alkali–carbon ratio is 5[thin space (1/6-em)]:[thin space (1/6-em)]1. This result is consistent with the pore structural parameters of the samples well (Table 2). The CNF-5 sample exhibits the largest specific surface area and total pore volume of 1564 m2 g−1 and 0.8237 cm3 g−1, respectively. In addition, it can be noted that all the samples possess large micropore area. The porous structure of the CNF-1–6 samples are analyzed in detail by N2 gas adsorption–desorption isotherm (Fig. S2a). Judged from the adsorption–desorption isotherm, it can be clearly found that the samples of CNF-1–5 exhibit a type I isotherm, indicating the material contains mainly micropores.25 The saturation in the isotherm at the higher pressure can be due to the large density of micropores in the material. However, the isotherm of CNF-6 indicates a type-IV with an increasing slope at higher relative pressures. This effect is commonly related to capillary condensation in mesopores.26 Furthermore, a hysteresis loop is observed for CNF-6, indicating the coexistence of both micropore and mesopore structures in the material.27 These results are also confirmed by the pore size distribution of the CNF-1–6 (Fig. S2b). It can be seen that pore density is higher in the region of less than 2 nm, and most of the pores have a pore diameter ranging from 1–2 nm for the sample of CNF-1–5. In the case of CNF-6, the centre of the pore size distribution located at 10 nm, which may be due to the high alkali–carbon ratio during the activation process. Base on above analysis, the most appropriate alkali–carbon ratio is 5[thin space (1/6-em)]:[thin space (1/6-em)]1.

Table 2 The specific surface area, pore volume and the specific capacitance of the samples at current density 0.5 A g−1 in 1.0 M H2SO4 electrolyte
Samples SBETa (m2 g−1) Smicrob (m2 g−1) Sexternalb (m2 g−1) Vporec (cm3 g−1) Capacitanced (F g−1)
a BET (Brunauer–Emmett–Teller) surface area.b Micropore surface area, external surface area, and micropore volume, calculated using t-plot method.c Total pore volume, measured at P/P0 = 0.975.d The specific capacitance calculated used GCD curves according to the eqn (1). The GCD curves are showed in Fig. S1.
CNF-1 355 203 153 0.2454 225.4
CNF-2 373 215 158 0.2554 277.7
CNF-3 754 371 384 0.6252 294.6
CNF-4 862 428 434 0.7094 296.9
CNF-5 1565 1053 587 0.8237 330.5
CNF-6 1107 587 520 0.7232 150.5
CNF-7 528 293 235 0.2971 295.7
CNF-8 1515 823 740 0.8397 270.5
CNF-9
CNF-10 1155 264 891 0.5824 193.2
CNF-11 1640 1122 1012 0.9391 436.9
CNF-12 1356 170 1186 0.5136 264.4
CKF 21 3 18 0.0089


The activation temperature is also optimized at an alkali–carbon ratio of 5[thin space (1/6-em)]:[thin space (1/6-em)]1 and activation time of 1 h, and the temperature is selected to be 600, 700, 800, and 900 °C, respectively (Table 1). The GCD curves and the specific capacity of CNF-5, 7–9 are displayed in Fig. S1b and Table 2, respectively. It can be found that the CNF-5 sample exhibits the highest specific capacitance. It is worth noting that there is no sample when the activation temperature is up to 900 °C. This may be ascribed to the fact that the sample is converted into carbon dioxide at this temperature. The specific surface area and total pore volume of the CNF-5, 7–9 samples are summarized in Table 2. It can be observed that CNF-5 prepared at 700 °C shows a larger specific surface area and total pore volume than the others, and the specific surface area and total pore volume undergo a great increase with the increasing temperature from 600 °C to 700 °C. The N2 gas adsorption–desorption isotherm of CNF-5, 7, and 8 is shown in Fig. S2c. The three samples exhibit a type-I sorption isotherm with saturation at a relative pressure (P/P0) of ca. 0.2, indicting a typical result for microporous materials. It suggests that the material is suitable as an electrode material for electrical double layer capacitors. Fig. S2d shows the pore size distribution obtained from the N2 adsorption–desorption isotherm. It can be found that three samples exhibit similar shape, and the pore size of three samples is centered at about 1.9 nm, which is agreed well with the N2 gas adsorption–desorption isotherm. Therefore, the optimum activation temperature is 700 °C in this work according to the above analysis.

The activation time is optimized at an alkali–carbon ratio of 5[thin space (1/6-em)]:[thin space (1/6-em)]1 and activation temperature of 700 °C. The activation time is selected to be 0.5 h, 1 h, 2 h and 3 h, respectively. The GCD curves of the CNF-5, 10–12 samples are displayed in the Fig. S1c. The sample of CNF-11 prepared at 700 °C for 2 h with an alkali–carbon ratio of 5[thin space (1/6-em)]:[thin space (1/6-em)]1 exhibits the highest specific capacitance with the value of 436.9 F g−1. As shown in Table 2, the specific surface area of samples increases by 75 m2 g−1 while the activation time increases from 1 h to 2 h, and CNF-11 sample shows the largest specific surface area and total pore volume in the all samples. When the activation time is extended to 3 h, the specific surface area is reduced to 1356 m2 g−1, this decrease also result in the decrease in the specific capacitance. The N2 adsorption–desorption isotherm of the CNF-5, 10–12 samples are depicted in Fig. S2e. The curves shape of these samples is close to the type I isotherm, indicating the co-existence of micropores and mesopores in these products. In particular, the sharp rise of N2 uptake at relatively low pressure (≤0.01 P/P0) reveals the existence of rich micropores. The corresponding pore size distribution is calculated by the BJH method (Fig. S2f), it reveals that the pore size distribution (PSD) is quite narrow with a maximum located at ∼2 nm. Therefore, the optimum alkali–carbon ratio, activation temperature, and activation time is 5[thin space (1/6-em)]:[thin space (1/6-em)]1, 700 °C, and 2 h, respectively. The obtained sample of CNF-11 at the optimum condition is selected for further study.

As a control, the un-activated CKF is also evaluated by the analysis of specific surface area and total pore volume, as summarized in Table 2. It shows the low specific surface area and total pore volume of 20.1 m2 g−1 and 0.0089 cm3 g−1, respectively. The N2 adsorption–desorption isotherm of CKF is presented in Fig. 1a, there is no significant adsorption–desorption during the increase pressure process, which can be ascribed to the low BET specific surface area. In addition, the isotherm and the pore size distribution of the sample is not detected. When CKF is activated at 700 °C for 2 h using KOH as activation agent, the activation reaction between KOH and CKF could be described as follows:28–30

 
6KOH + 2C → 2K2CO3 + 2K + 3H2 (2)
 
K2CO3 + C → K2O + 2CO (3)
 
K2CO3 → K2O + CO2 (4)


image file: c5ra22469a-f1.tif
Fig. 1 (a) N2 adsorption–desorption isotherm of CNF-11 and CKF, (b) pore size distribution of CNF-11.

Amorphous carbon and the pore structure are formed via the etching processes due to above reactions. Thus, the specific surface area and total pore volume of CNF-11 sample increase to be 1639 m2 g−1 and 0.9391 cm3 g−1 compared with that of CKF, respectively. The N2 adsorption–desorption isotherms of CKF-11 is also shown in Fig. 1a, it demonstrates a type I isotherm coupled with a faint hysteresis loop characteristic of a type IV isotherm.31 Micropore filling occurs and quickly reaches a saturation plateau at a relative pressure lower than 0.2. The adsorption features in this range gives evidence of the presence of abundant micropores in the samples. These micropores are derived from intrinsic voids by evaporation of less stable substances and gas during pyrolysis and activation treatment. Moreover, the pore size distribution calculated from the adsorption branch shows enhanced probability below 2 nm (Fig. 1b), also verifying the increase in micropores during activation process. No discernible pore size distribution over 2 nm can be observed, which also confirms the much lower fraction of mesopores and macropores.

Structural characterization

The structure changes of KF after carbonization can be confirmed by the FTIR technique. Fig. 2a shows the FTIR spectra of TKF, CKF, and CNF-11 samples. As for TKF, the absorption band at 1742 cm−1 is ascribed to the C[double bond, length as m-dash]O stretching vibration of the ester bond of the cellulose. The bands around 1375 and 1245 cm−1 are within the range of C–H and C–O bending vibration, respectively.32 The absorption band at 1056 cm−1 is within the region of polysaccharide.33 After TKF is carbonized and activated using an alkaline etching method, the FTIR spectrum becomes simplified. The peaks of the functional groups –OH (3430 cm−1), C[double bond, length as m-dash]O (1450 cm−1) and C–O (1067 cm−1) are detected in the spectrum, which suggests the existence of –OH and –COOH groups. The relatively poor peaks in the FTIR spectrum at 1567 cm−1 suggests the presences of the olefinic structures. These oxygen functional groups on the surface of CNF-11 greatly enhance its hydrophilic properties and also act as binding sites for the electrolyte ions.34
image file: c5ra22469a-f2.tif
Fig. 2 (a) FTIR spectra of TKF, CKF, and CNF-11, (b) XRD patterns of TKF and CNF-11, (c) XRD patterns of CNF-5, CNF-10, CNF-11, CNF-12, and (d) TGA curves of TKF and CNF-11.

The crystalline structures of the TKF and CNF-11 samples are also investigated by means of XRD technology. As shown in Fig. 2b, the XRD pattern of TKF microtubes shows three peaks of cellulose at 2θ = 15.78°, 22.62° and 34.96° corresponding to the (101), (002), and (004) crystallographic planes, respectively. Three peaks represent amorphous part and crystalline part in cellulosic fibers.35 For the sample of CNF-11, it can be clearly seen that the material possess a well-developed graphitic stacking peak at 22.3°, and a weak peak at 43.8° due to the formation of a higher degree of intralayer condensation, which should greatly improve the electrical conductivity.36 The XRD patterns of the samples of CNF-5, 10–12 are depicted in the Fig. 2c, it can be observed that all of these materials show similar shape and two diffraction peaks located at 2θ = 22.3° and 43.8° can be found obviously. However, the CNF-11 sample show a higher relative intensity at the low-angle scattering peak indicates a high density of micropores.37

Thermal analysis is performed to analyze the decomposition temperature and thermal stability of materials. The TGA curves of the TKF and CNF-11 samples are presented in Fig. 2d. For TKF, the weight loss (1.2%) below 150 °C is ascribed to the removal of adsorbed water and the evaporation of the intercalated water molecules.38 Later, the sharp weight loss is observed at about temperature range of 230 °C to 320 °C, due to the decomposition of oxygen-containing groups.38,39 The TKF undergoes a weight loss of 77.4% in the multistep weight loss process. However, the curve of CNF-11 keeps a stable tendency at temperatures lower than 500 °C. The sharp weight decrease at 500–650 °C suggests the decomposition of the carbon.40

In addition, the Raman spectroscopy of CNF-11 is illustrated in Fig. 3a. The peaks located at around 1320 and 1590 cm−1 are assigned to the characteristic D (defects and disorder) and G (graphitic) bands of carbon materials, respectively.41 The D/G ratio of band intensities indicates the degree of structural order with respect to a perfect graphitic structure. Here, the D/G intensity ratio of CNF-11 sample is determined to be 1.02, indicating a higher structural alignment. The relatively lower D/G intensity ratio for the sample might indicate a reduced amount of heteroatom doping (such as N and O).34


image file: c5ra22469a-f3.tif
Fig. 3 (a) Raman spectrum of CNF-11, (b) XPS survey spectrum of CNF-11, (c) C 1s XPS spectrum of CNF-11, and (d) O 1s XPS spectrum of CNF-11.

The surface chemical composition of CNF-11 sample is revealed by XPS analysis. From Fig. 3b, the survey spectrum of the sample shows two peaks with binding energies at 284.8 and 532.4 eV, which are characteristic of C 1s and O 1s orbital, respectively.42 These peaks indicate the surface composition of CNF-11 sample comprises carbon and oxygen elements. The deconvoluted C 1s peak shows the presence of C–C bonds in graphite domains (284.4 eV), C–O (284.9 eV) and C[double bond, length as m-dash]O (285.4 eV) groups (Fig. 3c). A high resolution O 1s spectrum is shown in Fig. 3d, and two distinct peaks are identified: the peak located at 532.3 eV for the C–O groups and the peak at 533.6 eV from the C[double bond, length as m-dash]O group.43 This results further verifying the partial graphitization of the carbon and the presence of hydroxyl and carbonyl groups on the sample, which basically coincides with the XRD and FTIR data.

The morphologies of TKF, CKF, and CNF-11 samples are characterized by SEM. It can be clearly observed that TKF shows a smooth surface and a regular hollow tubular structure with outer diameter of 20–25 μm and inner diameter of 16–23 μm, as well as a wall thickness around 400 nm (Fig. 4a and b). As shown in Fig. 4c, a small amount of the complete tubular structure is observed after being carbonized. The hollow tubular structure of TKF is almost completely destroyed during the calcination process accompanied with the formation of carbon nanoflakes. It also can be found that the tube wall breaks into pieces, and the thickness of tube wall greatly decreases compared with that of the TKF (Fig. 4d). After being activated, the morphology of CNF-11 sample has a similar shape to CKF. Fig. 4e illustrates the scale-like morphology with the thickness ranging from 140 to 300 nm. In addition, there are a small number of short tubular fibers are observed (Fig. 4f). For a comparison, the morphology of CNF-5, 10–12 samples is also investigated by SEM (Fig. S3). It can be clearly found that the activated time almost have no effect on the samples' morphologies. Furthermore, it is worth noting that very few hollow tubular carbon fibers can be observed in the samples obtained at different activated time, which is also consistent with the results reported by our groups.44


image file: c5ra22469a-f4.tif
Fig. 4 SEM images of (a and b) TKF, (c and d) CKF, and (e and f) CNF-11.

Selected area EDX analysis of the CNF-11 sample is provided Fig. 5. The SEM image in the selected area exhibits a scale-like structure with smooth surface. Selected area EDX analysis demonstrated the distribution of oxygen and carbon components in the sample, which derived from the TKF (Fig. 5a and b). This result implies that the hollow tubular TKF is fully transformed into carbon material after calcination treatment. For a comparison, the samples which prepared at 0.5 h (CNF-10), 1 h (CNF-5), 3 h (CNF-12), and CKF have also been tested by EDX technology (ESI Fig. S2–S4). EDX analysis affirms that the existence of C and O elements in these samples. The content of oxygen element in the sample of CNF-11 is about 25.39%, which higher than other samples. The higher content of O element in the sample of CNF-11 greatly enhance its hydrophilic properties and also act as binding sites for the electrolyte ions in the charge–discharge process.45,46


image file: c5ra22469a-f5.tif
Fig. 5 The selected area EDS curves of CNF-11.

Electrochemical properties

The high surface area, porous, and partial graphitization characteristics of the CNF-11 sample make it good candidates as electrode materials for supercapacitors. To evaluate the capacitive performance of CNF-11 sample, the detail CV, GCD, EIS, and cycle stability property are measured in a three-electrode system within the potential range 0–0.8 V in 1.0 M H2SO4 electrolyte. Fig. 6a presents the CV curves of the CNF-11 sample electrode at different scan rates. It can be seen that the electrode exhibits a quasi-rectangular loop without obvious redox peaks, characteristic of typical electrical double layer capacitive behavior.47 In addition, it is obvious that the plateau current increases accordingly with the scan rate, and the quasi-rectangular loop is largely retained without apparent distortion even at a higher scan rate, providing evidence of low internal resistance and fast electrolyte diffusion kinetics even at high scan rates, which further contributes to a high rate capability.48
image file: c5ra22469a-f6.tif
Fig. 6 (a) CV curves of CNF-11 in 1.0 M H2SO4 electrolyte at different scan rates from 10 mV s−1 to 100 mV s−1, (b) GCD curves of CNF-11 in 1.0 M H2SO4 electrolyte at different current densities, (c) Nyquist plot for CNF-11 in 1.0 M H2SO4 electrolyte, and (d) cycle stability of CNF-11 in 1.0 M H2SO4 electrolyte for 5000 cycles.

The capacitive performances for the CNF-11 sample electrode are further tested with GCD experiments at different current density. The GCD curves of the sample are showed in the Fig. 6b, and the specific capacitance is calculated from GCD curves according to the eqn (1). All the GCD curves of CNF-11 at various current densities are quasi-triangular and symmetrical, indicating that the electrodes possess typical electrical double layer capacitive behavior and superior charge–discharge reversibility, which is consistent well with the CV results. The specific capacitance is calculated to be about 324.8, 345.0 and 436.9 F g−1 at current density 2.0, 1.0, and 0.5 A g−1, respectively. The decrease in specific capacitance at a higher current density is mainly caused by insufficient diffusion of the electrolyte into deep micropores at a high current density,49 but 77% capacitance retention can still be achieved in the range 0.5–2 A g−1, demonstrating the high rate capability. The superior performance of the sample can be ascribed to its porous structure and high BET surface area, which can be beneficial for the electrolyte penetration and accelerate the kinetic process of the ion diffusion within electrode materials.

The facilitated ion and electron transport behavior of the CNF-11 material is confirmed by the EIS test in the open-circuit voltage. The Nyquist plot is shown in Fig. 6c, which comprises an inconspicuous semicircle in the high-frequency region and a straight line at low frequency. In the high-frequency region, the intercept end on the real axis represents the series resistance (Rs), which includes the bulk electrolyte resistance, intrinsic active material resistance and contact resistance between electrode and collector.50 The Rs value of the CNF-11 material is around 0.8 Ω. The diameter of the arc in the medium-frequency region represents charge transfer resistance (Rct) at the electrode/electrolyte interface.31 The lower Rct for the CNF-11 sample (0.4 Ω) reflects more rapid ion diffusion and accumulation on a porous electrode surface, more efficient electrical double layer capacitive behavior, which is due to its increased surface area and hydrophilicity after alkali activation.51 In the low-frequency region, the Nyquist plot shows the straightest line with an almost 90° angle, which is characteristic of better capacitive behavior.52

The cycling performance of the CNF-11 sample is evaluated by GCD measurements at current density 2.0 A g−1 in 1.0 M H2SO4 electrolyte for 5000 cycles. The corresponding results are shown in Fig. 6d. As shown in Fig. 6d, no obvious decrease in the specific capacitance can be observed after 5000 cycles. This indicated a high degree of reversibility in the repetitive charge–discharge cycles. The good cycling stability can be assigned to the versatile pores and high structural stability. The micropores of the sample benefit the shuttling of electrolytes, alleviating the over-accumulation of electrolytes in micropores. In addition, the columbic efficiency as function of cycle number is also shown in Fig. 6d, the columbic efficiency can retain nearly 94% over 5000 cycles, which indicates that the CNF-11 electrode material displays good cyclic stability.

In order to completely determine the electrochemical performance of the obtained materials, energy density and power density of the CNF-11//CNF-11 electrochemical capacitor were estimated using the following equations:53

 
image file: c5ra22469a-t2.tif(5)
 
image file: c5ra22469a-t3.tif(6)
where C (F g−1) is the measured device capacitance, V (V) refers to the potential change within the discharge time t (s), E (W h kg−1) refers to the energy density, P (W kg−1) corresponds to the power density. From the CV curves at different scan rates (Fig. 7a), it can be seen that the CNF-11//CNF-11 device still maintained the rectangular-shaped CV even at a high potential scan rate of 100 mV s−1. As shown in Fig. 7b, the triangular shape of the charge–discharge curves at different current densities indicates good charge propagation behaviour of electrolyte ions in the CNF-11 electrode. The specific capacitances of supercapacitor are calculated using the GCD curves based on the total mass of the active material on the two electrodes is about 51.2, 54.2, 56.1 and 56.5 F g−1 at current density of 2.0, 1.0, 0.5 and 0.25 A g−1, respectively. The high specific capacitance is related to its large surface area and high conductivity, which provides low-resistant pathways and interconnected and short ion diffusion channels for ion and electron transports. The Ragone plot for the CNF-11//CNF-11 electrochemical supercapacitor in 1.0 M H2SO4 electrolyte is presented in Fig. 7c. The assembled supercapacitor with a cell voltage of 1.0 V exhibits an energy density of 7.85 W h kg−1 at a power density of 125 W kg−1, and still retains 7.11 W h kg−1 at a high power density of 1000 W kg−1. The cycling lifetime for the capacitors is also investigated at the current density of 1.0 A g−1 in 1.0 M H2SO4 electrolytes. No obvious capacity shrinkage can be observed after 2000 cycles (Fig. 7d). It suggests that the assembled device exhibits good long-term cycle life and electrochemical stability. In addition, the columbic efficiency can retain about 93% after 2000 long cycles. Table S1 demonstrates the comparison in the energy and power density of supercapacitors based on various carbon derived from biomass presented in literature and this work. It can be seen that the energy and power density of the present CNF-11//CNF-11 supercapacitor surpasses many other carbon materials while two carbon materials shows higher energy density due to the higher specific surface area and different electrolyte. Taken into account the high price of other precursor materials, the present porous carbon nanoflakes with a high specific surface area can be produced on large-scale because KF is an agricultural product with a total annual production of two thousand tones.


image file: c5ra22469a-f7.tif
Fig. 7 Electrochemical performance of the CNF-11//CNF-11 device: (a) CV curves at various sweep rates within a potential window of 0–1.0 V, (b) GCD curves at different current densities, (c) Ragone plot of the ASC device at various current densities and (d) cycling stability of the ASC device after 2000 cycles.

Conclusion

In summary, porous carbon nanoflakes with a high specific surface area have been successfully fabricated via a facile carbonization and alkali activation procedure using natural KF as a low cost, green and renewable carbon source. The resultant carbon nanoflakes prepared at 700 °C for 2 h with an alkali carbon ratio of 5[thin space (1/6-em)]:[thin space (1/6-em)]1 possesses the highest specific surface area (1634.5 m2 g−1), appropriate PSD (≤2 nm), rich surface heteroatoms-doped functional groups (O species), high graphitization degree as well as good electrical conductivity. As a result, it exhibits the specific capacitance of about 430 F g−1 at a current density of 0.5 A g−1 and the excellent cycle stability with no obvious decrease in the specific capacitance after 5000 cycles. Furthermore, the assembled symmetrical supercapacitor based on the obtained sample exhibits an energy density of 7.85 W h kg−1 at a power density of 125 W kg−1 in 1.0 M H2SO4 electrolyte with a cell voltage of 1.0 V. Therefore, the favorable capacitive performances indicate that the low-cost KF can serve as a new resource of carbonaceous materials for high-performance supercapacitors.

Acknowledgements

The authors gratefully acknowledge the support of the National Natural Science Foundation of China (No. 51303190).

Notes and references

  1. P. Simon and Y. Gogotsi, Nat. Mater., 2008, 7, 845–854 CrossRef CAS PubMed.
  2. J. G. Jiang, H. Chen, Z. Wang, L. K. Bao, Y. W. Qiang, S. Y. Guan and J. D. Chen, J. Colloid Interface Sci., 2015, 452, 54–61 CrossRef CAS PubMed.
  3. G. P. Wang, L. Zhang and J. J. Zhang, Chem. Soc. Rev., 2012, 41, 797–828 RSC.
  4. K. Wang, H. P. Wu, Y. N. Meng and Z. X. Wei, Small, 2014, 10, 14–31 CrossRef CAS PubMed.
  5. J. Q. Sun, W. Y. Li, B. J. Zhang, G. Li, L. Jiang, Z. G. Chen, R. J. Zou and J. Q. Hu, Nano Energy, 2014, 4, 56–64 CrossRef CAS.
  6. R. Ramya, R. Sivasubramanian and M. V. Sangaranarayanan, Electrochim. Acta, 2013, 101, 109–129 CrossRef CAS.
  7. L. Mao, K. Zhang, H. S. O. Chan and J. S. Wu, J. Mater. Chem., 2012, 22, 1845–1851 RSC.
  8. X. C. Dong, X. W. Wang, J. Wang, H. Song, X. G. Li, L. H. Wang, C. P. Mary B, C. M. Li and P. Chen, Carbon, 2013, 50, 4865–4870 CrossRef.
  9. H. Zhu, J. Yin, X. L. Wang, H. Y. Wang and X. R. Yang, Adv. Funct. Mater., 2013, 23, 1305–1312 CrossRef CAS.
  10. A. Alabadi, X. J. Yang, Z. H. Dong, Z. Li and B. E. Tan, J. Mater. Chem. A, 2014, 2, 11697–11705 CAS.
  11. Y. P. Zhai, Y. Q. Dou, D. Y. Zhao, P. F. Fulvio, R. T. Mayes and S. Dai, Adv. Mater., 2011, 23, 4828–4850 CrossRef CAS PubMed.
  12. Y. Korenblit, M. Rose, E. Kockrick, L. Borchardt, A. Kvit, S. Kaskel and G. Yushin, ACS Nano, 2010, 4, 1337–1344 CrossRef CAS PubMed.
  13. H. F. An, Y. Wang, X. Y. Wang, L. P. Zheng, X. Y. Wang, L. H. Yi, L. Bai and X. Y. Zhang, J. Power Sources, 2010, 195, 6964–6969 CrossRef CAS.
  14. Y. W. Zhu, S. Murali, M. D. Stoller, K. J. Ganesh, W. W. Cai, P. J. Ferreira, A. Pirkle, R. M. Wallace, K. A. Cychosz, M. Thommes, D. Su, E. A. Stach and R. S. Ruoff, Science, 2011, 332, 1537 CrossRef CAS PubMed.
  15. Y. Y. Yang, Y. R. Liang, Y. D. Zhang, Z. Y. Zhang, Z. M. Li and Z. A. Hu, New J. Chem., 2015, 39, 4035–4040 RSC.
  16. J. C. Wang and S. Kaskel, J. Mater. Chem., 2012, 22, 23710–23725 RSC.
  17. C. Peng, X. B. Yan, R. T. Wang, J. W. Lang, Y. J. Ou and Q. J. Xue, Electrochim. Acta, 2013, 87, 401–408 CrossRef CAS.
  18. L. Sun, C. G. Tian, M. T. Li, X. Y. Meng, L. Wang, R. H. Wang, J. Yin and H. G. Fu, J. Mater. Chem. A, 2013, 1, 6462–6470 CAS.
  19. Y. P. Guo, J. R. Qi, Y. Q. Jiang, S. F. Yang, Z. Z. Wang and H. D. Xu, Mater. Chem. Phys., 2003, 80, 704–709 CrossRef CAS.
  20. Y. J. Kim, B. J. Lee, H. Suezaki, T. Chino, Y. Abe, T. K. Y. nagiurab, K. C. Parkb and M. Endo, Carbon, 2006, 44, 1592–1595 CrossRef CAS.
  21. D. Kalpana, S. H. Cho, S. B. Lee, Y. S. Lee, R. Misrac and N. G. Renganath, J. Power Sources, 2009, 190, 587–591 CrossRef CAS.
  22. Y. A. Zheng, Y. Liu and A. Q. Wang, Ind. Eng. Chem. Res., 2012, 51, 10079–10087 CrossRef CAS.
  23. Y. Liu, J. T. Wang, Y. A. Zheng and A. Q. Wang, Chem. Eng. J., 2013, 184, 248–255 CrossRef.
  24. B. Mu, W. B. Zhang, S. J. Shao and A. Q. Wang, Phys. Chem. Chem. Phys., 2014, 16, 7872–7880 RSC.
  25. W. Chaikittisilp, M. Hu, H. J. Wang, H. S. Huang, T. Fujita, C. W. Kevin, D. Wu, L. C. Chen, Y. Yamauchi and K. Ariga, Chem. Commun., 2012, 48, 7259–7261 RSC.
  26. W. J. Qian, F. X. Sun, Y. H. Xu, L. H. Qiu, C. H. Liu, S. D. Wang and F. Yan, Energy Environ. Sci., 2014, 7, 379–386 CAS.
  27. Y. S. Yun, S. Y. Cho, J. Y. Shim, B. H. Kim, S. J. Chang, S. J. Baek, Y. S. Huh, Y. S. Tak, Y. W. Park, S. J. Park and H. J. Jin, Adv. Mater., 2013, 25, 1993–1998 CrossRef CAS PubMed.
  28. M. A. Lillo-Ródenas, D. Cazorla-Amorós and A. Linares-Solano, Carbon, 2003, 41, 267–275 CrossRef.
  29. M. A. Lillo-Ródenas, J. Juan-Juan, D. Cazorla-Amorós and A. Linares-Solano, Carbon, 2004, 42, 1371–1375 CrossRef.
  30. J. Ma, F. Yu, L. Zhou, L. Jin, M. X. Yang, J. S. Luan, Y. H. Tang, H. B. Fan, Z. W. Yuan and J. H. Chen, ACS Appl. Mater. Interfaces, 2013, 4, 5749–5760 Search PubMed.
  31. X. Wang, Z. Y. Gao, J. L. Chang, D. P. Wu, X. R. Wang, F. Xu, Y. M. Guo and K. Jiang, RSC Adv., 2015, 5, 15969–15976 RSC.
  32. J. T. Wang, Y. A. Zheng and A. Q. Wang, Ind. Crops Prod., 2012, 40, 178–184 CrossRef CAS.
  33. T. T. Lim and X. F. Huang, Ind. Crops Prod., 2007, 26, 125–134 CrossRef CAS.
  34. F. W. Ma, J. F. Wan, G. Wu and H. Zhao, RSC Adv., 2015, 5, 44416–44422 RSC.
  35. M. Wada, J. Sugiyama and T. Okano, J. Appl. Polym. Sci., 1993, 49, 1491–1496 CrossRef CAS.
  36. J. P. Paraknowitsch, J. Zhang, D. S. Su, A. Thomas and M. Antonietti, Adv. Mater., 2010, 22, 87–92 CrossRef CAS PubMed.
  37. S. Tanaka, H. Fujimoto, J. F. Denayer, M. Miyamoto, Y. Oumi and Y. Miyake, Microporous Mesoporous Mater., 2015, 217, 141–149 CrossRef CAS.
  38. J. T. Chung, K. J. Hwang, W. G. Shim, C. Kim, J. Y. Park, D. Y. Choi and J. W. Lee, Mater. Lett., 2013, 93, 401–403 CrossRef CAS.
  39. K. J. Hwang, D. C. Kang, S. H. Lee, C. H. Hwang, C. Kim, N. Kim, S. H. Jin, I. H. Lee and J. Y. Park, Mater. Lett., 2014, 115, 265–267 CrossRef CAS.
  40. H. Chen, X. X. Wang, J. X. Li and X. K. Wang, J. Mater. Chem. A, 2015, 3, 6073–6081 CAS.
  41. B. Qiu, Y. R. Wang, D. Z. Sun, Q. Wang, X. Zhang, B. L. Weeks, R. O'Connor, X. H. Huang, S. Y. Wei and Z. H. Guo, J. Mater. Chem. A, 2015, 3, 9817–9825 CAS.
  42. E. G. Calvo, N. Ferrera-Lorenzo, J. A. Menéndez and A. Arenillas, Microporous Mesoporous Mater., 2013, 168, 206–212 CrossRef CAS.
  43. Y. P. Guo, S. F. Yang, K. F. Yu, J. J. Zhao, Z. C. Wang and H. D. Xu, Mater. Chem. Phys., 2002, 74, 320–323 CrossRef CAS.
  44. B. Mu, W. B. Zhang, W. B. Xu and A. Q. Wang, Electrochim. Acta, 2015, 178, 709–720 CrossRef CAS.
  45. Y. Dong, H. M. Lin, Q. M. Jin, L. Li, D. Wang, D. Zhou and F. Y. Qu, J. Mater. Chem. A, 2013, 1, 7391–7398 CAS.
  46. W. Chen, R. B. Rakhi, Q. Wang, M. N. Hedhili and H. N. Alshareef, Adv. Funct. Mater., 2014, 24, 3130–3143 CrossRef CAS.
  47. P. Z. Guo, Y. Gu, Z. B. Lei, Y. Q. Cui and X. S. Zhao, Microporous Mesoporous Mater., 2012, 156, 176–180 CrossRef CAS.
  48. L. W. Su, Y. R. Zhong, L. P. Wei and Z. Zhou, RSC Adv., 2013, 3, 9035–9041 RSC.
  49. R. T. Wang, P. Y. Wang, X. B. Yan, J. W. Lang, C. Peng and Q. J. Xue, ACS Appl. Mater. Interfaces, 2012, 4, 5800–5806 CAS.
  50. D. Puthusseri, V. Aravindan, S. Madhavi and S. Ogale, Energy Environ. Sci., 2014, 7, 728–735 CAS.
  51. L. Zhou, C. Gao and W. J. Xu, ACS Appl. Mater. Interfaces, 2010, 2, 1483–1491 CAS.
  52. Y. Wang, Z. Q. Shi, Y. Huang, Y. F. Ma, C. Y. Wang, M. M. Chen and Y. S. Chen, J. Phys. Chem. C, 2009, 113, 13103–13107 CAS.
  53. L. F. Chen, X. D. Zhang, H. W. Liang, M. G. Kong, Q. F. Guan, P. Chen, Z. Y. Wu and S. H. Yu, ACS Nano, 2012, 6, 7092–7102 CrossRef CAS PubMed.

Footnote

Electronic supplementary information (ESI) available: GCD curves of the samples of CNF-1–12 in 1.0 M H2SO4 electrolyte at current density of 0.5 A g−1, N2 adsorption–desorption isotherm and the pore size distribution of CNF-1–12, SEM images and the selected area EDS curves of CKF, CNF-5, CNF-10, and CNF-12, Comparison of energy density and power density of various carbon materials with KF derived carbon. See DOI: 10.1039/c5ra22469a

This journal is © The Royal Society of Chemistry 2016
Click here to see how this site uses Cookies. View our privacy policy here.