Nanoscale characteristics of antibacterial cationic polymeric brushes and single bacterium interactions probed by force microscopy
Merve Gultekinoglu†
ab,
Yoo Jin Oh†c,
Peter Hinterdorferc,
Memed Dumand,
Demet Çatçatd and
Kezban Ulubayram*abd
aDepartment of Basic Pharmaceutical Sciences, Faculty of Pharmacy, Hacettepe University, Ankara 06100, Turkey. E-mail: ukezban@hacettepe.edu.tr
bGraduate Department of Bioengineering, Institute for Graduate Studies in Science and Engineering, Hacettepe University, Ankara 06640, Turkey
cInstitute for Biophysics, Johannes Kepler University, Linz A-4020, Austria
dGraduate Department of Nanotechnology and Nanomedicine, Institute for Graduate Studies in Science and Engineering, Hacettepe University, Ankara 06640, Turkey
First published on 27th January 2016
Abstract
Cationic brushes are powerful molecules for antibacterial purposes with permanent activity and mobility. Therefore, clarifying the characteristics of the brush structure and related interactions with microbial cells becomes important. In this study, two different molecular weight (Mn: 1800 and 60![[thin space (1/6-em)]](https://www.rsc.org/images/entities/char_2009.gif) 000) polyethyleneimine (PEI) molecules were grafted on a polyurethane (PU) surface. Moreover, an alkylation step was performed to enhance the antibacterial efficiency by increasing the polycationic character of the PEI brushes. The surface potential of the PEI brushes was raised with an additional alkylation step. Nanoscale characterization of the PEI brushes on PU surfaces was examined in terms of topography, roughness, and surface potentials by Kelvin Probe Force Microscopy (KPFM). The nanomechanical behaviour of the PEI brushes was investigated in Milli-Q water and phosphate buffer saline by Atomic Force Microscopy (AFM). The nanomechanical properties were directly affected by the incubation medium and surface properties. Additionally, polymeric brush–single bacterium interactions were probed by Single Cell Force Spectroscopy (SCFS). The antibacterial activity of the PEI brushes was probed at a single bacterium level with the Escherichia coli K-12 bacteria species. As a result, rupture forces between E. coli K-12 and the alkylated PEI grafted surface were calculated to identify the bacterial adhesion process at piconewton force sensitivity. It was found that, alkylated high molecular weight PEI brushes show the lowest rupture force (56.1 pN) with the lowest binding percentage (%5) against single bacterial cells. This study indicated that, increasing the chain length, charge (alkyl groups) and mobility of PEI brushes decreases the binding percentage and force at a single bacterium level, synergistically.
000) polyethyleneimine (PEI) molecules were grafted on a polyurethane (PU) surface. Moreover, an alkylation step was performed to enhance the antibacterial efficiency by increasing the polycationic character of the PEI brushes. The surface potential of the PEI brushes was raised with an additional alkylation step. Nanoscale characterization of the PEI brushes on PU surfaces was examined in terms of topography, roughness, and surface potentials by Kelvin Probe Force Microscopy (KPFM). The nanomechanical behaviour of the PEI brushes was investigated in Milli-Q water and phosphate buffer saline by Atomic Force Microscopy (AFM). The nanomechanical properties were directly affected by the incubation medium and surface properties. Additionally, polymeric brush–single bacterium interactions were probed by Single Cell Force Spectroscopy (SCFS). The antibacterial activity of the PEI brushes was probed at a single bacterium level with the Escherichia coli K-12 bacteria species. As a result, rupture forces between E. coli K-12 and the alkylated PEI grafted surface were calculated to identify the bacterial adhesion process at piconewton force sensitivity. It was found that, alkylated high molecular weight PEI brushes show the lowest rupture force (56.1 pN) with the lowest binding percentage (%5) against single bacterial cells. This study indicated that, increasing the chain length, charge (alkyl groups) and mobility of PEI brushes decreases the binding percentage and force at a single bacterium level, synergistically.
Introduction
The inhibition of bacteria adhesion is a critical issue that needs to be addressed in medical devices. The adhesion of bacteria to a surface is the first step of infection. If adhered bacteria are not removed from the surface, bacterial species integrate and a thick, dense biofilm structure occurs.1 Biofilm formation is an irreversible process and also a fundamental problem on the surface of biomaterials. For many years, the antibacterial efficiency of biomedical materials has traditionally been tested by counting the number of adhered bacteria colonies or measuring the optical density of bacterial suspensions.2 However, these techniques do not give quantitative information about bacteria–surface interactions in detail. With the development of nanotechnology and particularly the emergence of Force Microscopy (FM), determining cellular interactions has become more practical at nanometer resolution and piconewton sensitivity. FM techniques provide information about the structures of bacteria and also the surface characteristics and physical properties of materials along with the elucidation of molecular interactions between cells and surfaces from biophysical aspects, at the scale that they occur.3 In 1999 Bowen et al., examined single cell-surface interactions for the first time, by sticking a yeast cell (S. cerevisiae) on a tip-less Atomic Force Microscopy (AFM) cantilever.4 Thus the anti-fouling properties of membranes were probed in a direct and fast manner at small sample sizes. Single cell investigations probed by AFM were termed as Single Cell Force Spectroscopy (SCFS). The SCFS technique investigates not only the interactions at the bacterium–surface interface, but also at the cell–cell and cell–surface interfaces. For instance, Liu et al. studied the nanoscale adhesion forces between uropathogenic P-fimbriated E. coli and human uroepithelial cells with SCFS5 in the presence of cranberry juice cocktail (CJC) to enlighten the mechanism of urinary tract inhibition by CJC. In addition, Beaussart et al. focused on the nanoscale adhesion forces of P. aeruginosa Type IV pili to hydrophilic and hydrophobic surfaces and to host cells,6 since Type IV pili mediate cell adhesion and the following infection. It was also revealed that Type IV pili have unique nanomechanical properties to resist mechanical stress under physiological conditions.Moreover, SCFS has become an informative tool to characterize adhesion kinetics at the nanoscale between a single cell and functionalized surfaces.7 Basically, cell adhesion on a functionalized surface depends on the chemical (composition) and physical structure (roughness and stiffness) of the corresponding surface. Additionally, electrostatic interactions between the cell membrane and the surface play an important part in the adhesion kinetics.8 The electrostatic properties of living organisms and surfaces can be imaged by Kelvin Probe Force Microscopy (KPFM). Nonnenmacher and co-workers developed KPFM for the first time which allows the measurement of the contact potential difference (CPD) at cell/material interfaces.9 KPFM is also a useful tool to characterize surfaces in an ambient environment that gives quantitative information about surface mapping in terms of surface potential (mV) and topography (nm).10
In addition, an AFM cantilever is commonly used as a nanoindenter to identify the nanomechanical properties of surfaces with high precision.11–14 For this purpose, several techniques have been adapted to FM for investigating material and cell mechanics.15–17 The nanomechanical properties of materials and cells are identified through Young’s modulus that can be obtained from the slope of the withdrawal part of the force–distance curves.18,19 The geometry of the tip apex is very important to be able to apply the correct model. Commonly, two models have been defined for the spherical and conical apexes of indenters. Firstly, in 1882 the Heinrich Hertz model was defined and then in 1965 an expanded version was defined by Sneddon.20,21 The Hertz model describes the indentation of a spherical indenter on an elastic sample. This model can only be used if the indentation depth is less than the radius of the curvature of the tip. If the indentation depth is close to or more than the radius of the probe tip, the Sneddon model is more appropriate for contact between an infinitely hard conical indenter and an elastic sample surface. However both of the models do not describe the contact between the pyramidal end and the surface. So another model which was derived from both of the previous models for a blunted pyramidal tip apex was used to define this contact between the tip and the surface.
Our main objective in this work was to investigate the nanoscale properties of polymeric brushes such as; topography, roughness, electrostatic potential, stiffness and their interaction with single bacteria. Recently, antimicrobial polymer brushes have gained much interest owing to their permanent antimicrobial activity. Especially, cationic compounds which can be easily combined with polymeric brushes are promising candidate materials for antibacterial applications.22–24 In our previous study, it was shown that polycationic polyethyleneimine (PEI) brushes exhibit permanent antibacterial activity without any cytotoxic effect to the surrounding tissue.25
In this study, PEI molecules were covalently grafted to polyurethane (PU) surfaces as polymeric brushes through the isocyano anchor cites on PU using a “grafting to” method. Then the PEI chains were alkylated by bromohexane through the amino groups of PEI to increase the surface charge and the antibacterial character (Fig. 1). It is because of the fact that PEI is a cationic polymer which means that it interacts with the negatively charged bacterial membrane electrostatically and disrupts the membrane. Furthermore, PEI brushes have antibacterial mechanisms, which inhibit the bacterial adhesion via flexible and dynamic cationic chains, permanently.26 Topography, roughness, electrostatic potential and stiffness, which are known to be crucial surface parameters in bacterial adhesion, were probed by different force microscopy techniques for PEI brushes. Moreover, the antibacterial efficiency of the PEI brushes on PU surfaces was determined at a single cell (bacterium) level. Interactions between single bacteria and polycationic PEI brushes were investigated as a function of chain length, topography and charge.
Results and discussion
PEI brushes on PU substrates
PEI chains were “grafted onto” PU surfaces as polymeric brushes with two different molecular weight PEI molecules (Mn: 1800 and 60![[thin space (1/6-em)]](https://www.rsc.org/images/entities/char_2009.gif) 000). PEI grafted PU surfaces will be denoted as PU-g-LPEI for low molecular weight PEI grafted PU surfaces and PU-g-HPEI for high molecular weight PEI grafted PU surfaces. Then alkylation was performed to increase the polycationic character and antibacterial activity of the PEI brushes. After the alkylation step, PU-g-LPEI and PU-g-HPEI will be denoted as PU-g-LPEI-R and PU-g-HPEI-R. In the previous work, Attenuated Total Reflectance-Fourier Transform Infrared Spectroscopy (ATR-FTIR) and X-ray Photoelectron Spectroscopy (XPS) data confirmed that the PEI grafting and alkylation steps were performed successfully.25
000). PEI grafted PU surfaces will be denoted as PU-g-LPEI for low molecular weight PEI grafted PU surfaces and PU-g-HPEI for high molecular weight PEI grafted PU surfaces. Then alkylation was performed to increase the polycationic character and antibacterial activity of the PEI brushes. After the alkylation step, PU-g-LPEI and PU-g-HPEI will be denoted as PU-g-LPEI-R and PU-g-HPEI-R. In the previous work, Attenuated Total Reflectance-Fourier Transform Infrared Spectroscopy (ATR-FTIR) and X-ray Photoelectron Spectroscopy (XPS) data confirmed that the PEI grafting and alkylation steps were performed successfully.25
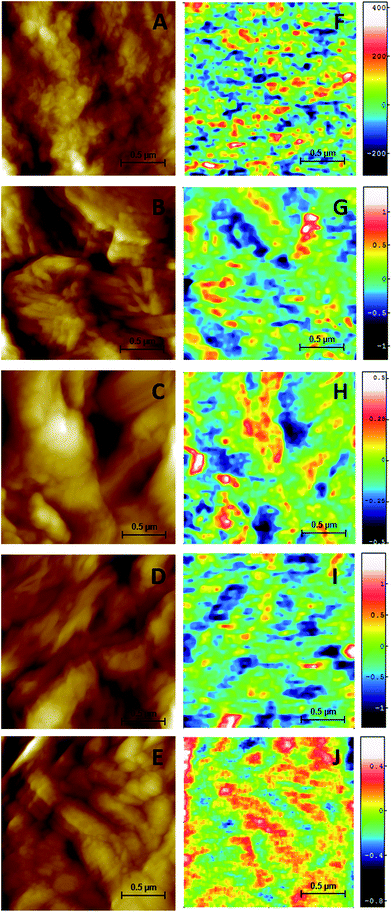
In this study, PU and polycationic PEI brushes on PU surfaces were characterized in terms of surface potential, topography and nanomechanical properties via FM. Furthermore, the nanoscale properties of the PEI brushes were correlated with single bacterium (E. coli)-interactions. The surface topography and potential of samples were identified by KPFM (Fig. 2). For each sample, 2 × 2 μm2 areas were scanned with a ∼2.3 μm s−1 scan speed for (n = 5). Morphological evaluation was performed through roughness calculations using Gwyddion 2.34 software and tabulated in Table 1.
| Sample | Mn | SP* (mV) | Rms (nm) |
|---|---|---|---|
| PU | — | 207 | 15.74 |
| PU-g-LPEI | 1800 | 557 | 110.0 |
| PU-g-HPEI | 60![[thin space (1/6-em)]](https://www.rsc.org/images/entities/char_2009.gif) 000 000 |
447 | 103.9 |
| PU-g-LPEI-R | 1800 | 1033 | 112.9 |
| PU-g-HPEI-R | 60![[thin space (1/6-em)]](https://www.rsc.org/images/entities/char_2009.gif) 000 000 |
588 | 139.7 |
The Rms (root-mean-square) of surface roughness was calculated as 15.74 nm for PU. A remarkable increase was observed in surface roughness after PEI grafting for both low and high molecular weight brushes as 110.0 nm for PU-g-LPEI and 103.9 nm for PU-g-HPEI. After bromo-alkylation, a slight increase was observed in the surface roughness characteristics. The surface roughness values of the alkylated PEI brushes increased up to 112.9 nm for PU-g-LPEI-R and 139.7 nm for PU-g-HPEI-R (Table 1).
The surface potential (SP) images obtained from KPFM analysis showed that the surface potentials of sample groups exhibit various electrostatic characteristics in an ambient environment (Fig. 2). Differences in surface potential values (Table 1) were calculated as 207 mV for PU. Although the polycationic nature of PEI increased due to the chain length, PU-g-LPEI had higher surface potential than PU-g-HPEI. The SP values were calculated as 507 mV for PU-g-LPEI and 447 mV for PU-g-HPEI. In addition, bromo-alkylation was also performed to enhance the polycationic character of PEI. Therefore, the SP was calculated as 1033 mV for PU-g-LPEI-R and 588 mV for PU-g-HPEI-R (Table 1). Thus, it was concluded that the surface potentials of PEI brushes are increased with chain length and N-alkylation.
Nanomechanical properties of PEI brushes in liquid media
Nanomechanical behaviours of PEI brushes were identified using a nanoindentation test. An AFM cantilever with a pyramidal end was used as an indenter to identify the elasticity of the PEI brushes. The force/displacement curves were exploited in order to characterize elastic behaviour. Stiffness and hardness parameters were obtained through load/displacement (dP/dh) curves. The Young’s modulus values of PU and PEI brushes were calculated using the obtained curves. Basically, the mechanical properties of PU depend on the hard and soft segment ratio of the polymer.27,28 PU–Tecoflex® gives improved mechanical properties such as elasticity, hardness, tensile strength to biomedical materials and it is a biocompatible polymer for in vivo applications.29,30 The investigation of its nanomechanical behaviours after modification was as a function of brush length and charge. Because the stiffness of PEI brushes depends on the mobility of chains and surface charge. Nanoindentation measurements were performed using AFM in both PBS and Milli-Q water. Comparative analysis of the Young’s modulus values are shown in Fig. 3.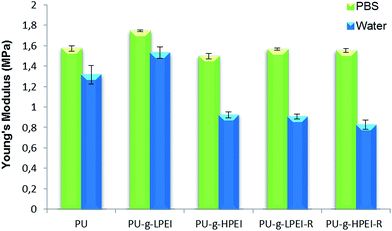 | ||
| Fig. 3 Nanomechanical behaviour of PU and PEI brushes as a function of brush length and charge. Comparison of Young’s modulus values of PU and PEI brushes in PBS and Milli-Q water media. | ||
In PBS, the Young’s modulus was calculated as 1.57 MPa for PU. The Young’s modulus values of the PEI brushes were also calculated as 1.75 MPa for PU-g-LPEI, 1.50 MPa for PU-g-HPEI, 1.56 MPa for PU-g-LPEI-R and 1.55 MPa for PU-g-HPEI-R in PBS. Meanwhile, in Milli-Q water, the Young’s modulus of PU decreased to 1.32 MPa. In addition, the Young’s modulus values of the PEI brush structures were decreased to 1.53 MPa for PU-g-LPEI, 0.92 MPa for PU-g-HPEI, 0.91 MPa for PU-g-LPEI-R and 0.83 MPa for PU-g-HPEI-R under aqueous conditions. In PBS, due to the ion concentration, the polymer brushes collapsed and a more dense structure occurred. On the other hand, in Milli-Q water, the polymer brushes stretched and the free volume increased as reported in other studies.31 Therefore, Milli-Q water was defined as a “good” solvent for polycationic polymer brushes.32,33
The Young’s modulus describes a material’s resistance against elastic deformation under the applied load. In PBS the samples have higher Young’s modulus values than in Milli-Q water. This tendency can be explained by Derjaguin, Landau, Verwey, and Overbeek (DLVO) theory with the contribution of the electrostatic double layer repulsion and van der Waals forces.34,35 In Milli-Q water, the interactions between sample groups and the cantilever only consist of van der Waals forces. Also the polycationic polymeric brushes were in an unfolded conformation owing to the high dielectric constant of water. Besides, in PBS there were not only van der Waals forces but also electrostatic double layer repulsion interactions, because PBS is a salt solution and ions in the solution cover the charged surface (polycationic PEI brushes) as the electric double layer and directly affect the force between sample and cantilever.36
Also PU-g-LPEI had a higher Young’s modulus value than the other sample groups in both PBS and Milli-Q water. This tendency can be explained by the reinforcement effect of closely packed LPEI chains and the steric hindrance between the chains. PU-g-HPEI had a lower Young’s modulus and stiffness than PU-g-LPEI. HPEI chains have more free volume, owing to the long chain length, that increased the flexibility of PU-g-HPEI. Also after alkylation, there was a slight difference between PU-g-HPEI and PU-g-HPEI-R because HPEI chains are extremely long and alkyl chains dissipate the mechanical load for fracture but not for elastic deformation. On the other hand, both electrostatic repulsion between chains and free volume for load dissipation of recoverable deformation resistance were increased for PU-g-LPEI-R.37 The molecular weight (chain length) of PEI affects the Young’s modulus owing to the charge through the active N-central number for bromo-alkylation. The obtained force curves indicated that the stiffness of the surfaces changes with PEI brush length and charge.
Bacterial adhesion probing by SCFS
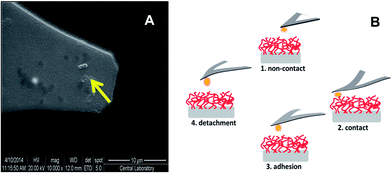
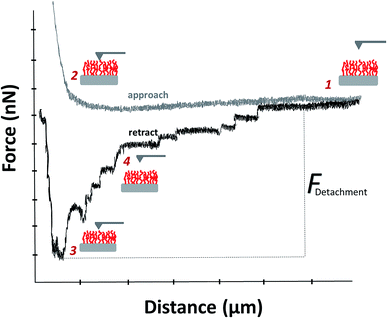
PEI is an antibacterial polycationic polymer which disrupts and makes holes in the bacterial membrane with a contact-active strategy.38 PEI “grafting to” PU substrates as brushes provides a synergistically antibacterial effect with the dynamic motion of brush chains and polycationic nature of PEI to inhibit bacterial adhesion and further biofilm formation.25 Also alkylation was performed to increase the polycationic structure through amine groups. In this regard, Bieser and co-workers have reported that functional group densities influence the efficiency of antimicrobial surfaces.39In this manuscript, bacteria–surface interactions were investigated at a single cell resolution by utilizing a SCFS technique. In spite of the conventional techniques which provide information only about the number of adherent bacteria on the surface, SCFS reveals the single bacterium–surface interactions at the nanoscale, quantitatively. For this reason, the interaction of PEI brushes with single E. coli K-12 (in terms of binding capability and force) was probed by SCFS. A tip-less AFM cantilever was functionalized with a single E. coli K-12 (Fig. 4) and during the experiments, interaction time and load were kept constant to compare the binding characteristics of the PU surface and PEI brushes. Bacterial viability (motility) was also controlled by microscopic examination at the end of the measurements. Fig. 4B represents the non-contact (1), contact (2), binding (3) and detachment (4) of the cantilever from the surface schematically. The number of binding percentages and rupture (detachment) forces were calculated with force–distance curves. The rupture forces between E. coli K-12 and the surfaces gave detailed information about the binding characteristics of a single bacterium on polycationic PEI brushes.
Antibacterial activity through the average number of binding events per 100 F–D curves for each sample groups are shown in Fig. 5. Glass was used as the blank sample. Glass (%95) and PU (%96) showed similar high binding percentages. The binding percentage of E. coli K-12 considerably decreased in the presence of PEI brushes. After PEI grafting on PU surfaces, PU-g-LPEI and PU-g-HPEI showed %50 and %39 bacteria binding per 100 F–D curves, respectively. Due to the increase in chain length of PEI, the antibacterial activity of the brushes increased as well.
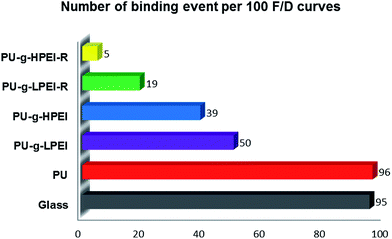 | ||
| Fig. 5 SCFS binding event percentage of a single E. coli K-12 on PU, PU-g-LPEI, PU-g-HPEI, PU-g-LPEI-R and PU-g-HPEI-R substrates, individually. Glass was used as the blank sample. | ||
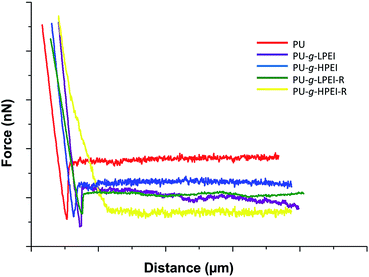
In addition, the alkylation of PEI molecules in relation to increasing surface charge and volume decreased the bacterial binding percentage. PU-g-LPEI-R had %19 and PU-g-HPEI-R had only %5 binding percentage of E. coli K-12 per 100 F–D curves. The binding of E. coli K-12 was analysed through the number of binding events per 100 F–D curves, and rupture (detachment) force calculations of retraction curves (Fig. 6).
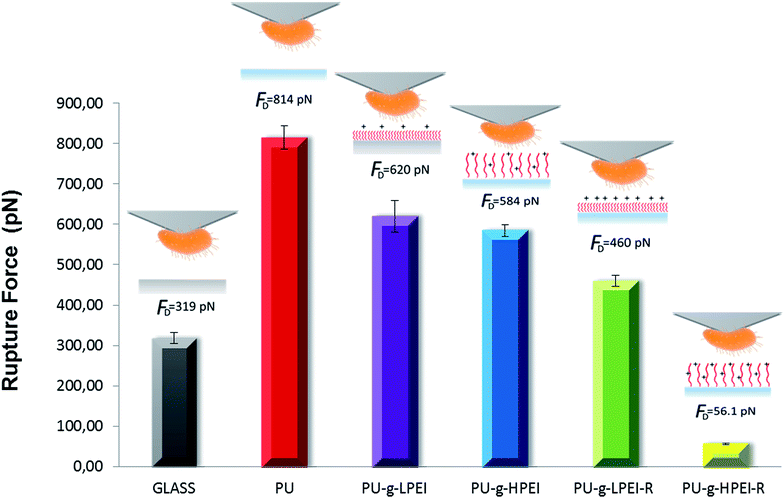
The rupture force gives direct information about the binding strength of bacteria. PU had the greatest binding percentage of %96 (n = 258) and a rupture force of 814 pN (Fig. 7). After surface modification, the binding percentages and rupture forces decreased. PU-g-LPEI had a rupture force of 620 pN and a binding percentage of %50 (n = 230) which decreased to PU-g-LPEI-R 584 pN and %19 (n = 230), respectively. PU-g-HPEI had a lower rupture force than both PU-g-LPEI and PU-g-LPEI-R with 460 pN (n = 244). However, PU-g-HPEI-R showed the maximum antibacterial efficiency with the lowest rupture force (56.1 pN) and E. coli K-12 binding percentage (%5, n = 244). Lu et al. has reported that bacterial adhesion depends on intermolecular and surface interactions such as electrostatic; van der Waals, hydrophobic forces, hydrogen bonding and covalent bonding which are affected by the physicochemical properties of the sample and the bacterial surface.40
In this study, this information was supported by comparative results. E. coli K-12 binding on PEI brushes basically depends on surface characteristics like; PEI chain length (Mw), charge (alkylation) and nanomechanical properties (stiffness, flexibility). Single cell force spectroscopy results indicated that, PU-g-HPEI-R showed highly effective antibacterial activity in comparison to PU, PU-g-LPEI, PU-g-HPEI and PU-g-LPEI-R. In the literature there are several reports about the antibacterial properties of polymeric brushes, however most of them describe the antibacterial nature of polymeric brushes towards individual properties. For instance Gibney and co-workers have reported that the “antibacterial activity of PEI depends on both molecular weight and architecture”.41 Therefore PU-g-HPEI exhibited higher antibacterial performance than PU-g-LPEI. In addition, PU-g-LPEI-R showed higher antibacterial activity than PU-g-HPEI owing to the higher surface charge after the alkylation step. Nevertheless PU-g-HPEI-R showed much higher antibacterial efficiency than PU-g-LPEI-R in terms of both percentage and force as mentioned before, because PU-g-HPEI-R has long dynamic PEI chains with higher elasticity than other sample groups. In addition PU-g-HPEI-R exhibited an increased surface charge after alkylation which, as Murata et al. have pointed out, shows the importance of the solvent accessibility and high surface charge density of polymer brushes in killing bacteria.24 As a result, this study showed that; bacterial adherence is not only affected by the chain length, charge or nanomechanical properties of individual polymeric brushes, but also a combination of these properties reduced bacterial binding in a single bacterium level, synergistically.
Experimental methods
Brush-like PEI grafting on PU surfaces
PEI brushes were synthesized on the PU surface as described in previous work.25 Tecoflex®–aliphatic polyether-EG93A (PU) was used for the experiments. First of all, the PU surface (Fig. 1a) was activated with hexamethylene diisocyanate (HMDI, 5% (v/v)) in the presence of a tin(II) chloride catalyst (0.25% (v/v)). The reaction occurred in toluene solution at 60 °C under a nitrogen atmosphere for 90 min (Fig. 1b). After this reaction, active isocyano (–NCO) anchor groups were obtained on the PU surface. Then, two different molecular weight (Mn: 1800 and 60![[thin space (1/6-em)]](https://www.rsc.org/images/entities/char_2009.gif) 000) PEI chains were covalently “grafted to” the PU surface through active isocyanate groups. The PEI grafted PU surfaces were denoted as PU-g-LPEI for low molecular weight PEI grafted PU surfaces and PU-g-HPEI for high molecular weight PEI grafted PU surfaces. PEI brushes were synthesized in 50% (v/v) methanol and 50% (v/v) triethylamine solution with 1.3 × 10⁻⁶ mole PEI concentration at 45 °C for 24 h (Fig. 1c). The PEI brushes were covalently grafted to the PU surface from the N end atoms of PEI to the active isocyano (–NCO) groups of the PU surface. The PEI brushes were also alkylated through N atoms by bromohexane. Alkylation was applied in 91% (v/v) tert-amyl alcohol, 9% (v/v) bromohexane solution at 55 °C for 6 h (Fig. 1d). The pH of the solution was balanced with KOH. After the alkylation step, PU-g-LPEI and PU-g-HPEI were denoted as PU-g-LPEI-R and PU-g-HPEI-R. Alkylation was carried out to enhance the antibacterial character of surfaces. All chemical reactions were confirmed using an Attenuated Total Reflectance-Fourier Transform Infrared Spectrometer (ATR-FTIR) and X-ray Photoelectron Spectrometer (XPS) in detail, previously.25
000) PEI chains were covalently “grafted to” the PU surface through active isocyanate groups. The PEI grafted PU surfaces were denoted as PU-g-LPEI for low molecular weight PEI grafted PU surfaces and PU-g-HPEI for high molecular weight PEI grafted PU surfaces. PEI brushes were synthesized in 50% (v/v) methanol and 50% (v/v) triethylamine solution with 1.3 × 10⁻⁶ mole PEI concentration at 45 °C for 24 h (Fig. 1c). The PEI brushes were covalently grafted to the PU surface from the N end atoms of PEI to the active isocyano (–NCO) groups of the PU surface. The PEI brushes were also alkylated through N atoms by bromohexane. Alkylation was applied in 91% (v/v) tert-amyl alcohol, 9% (v/v) bromohexane solution at 55 °C for 6 h (Fig. 1d). The pH of the solution was balanced with KOH. After the alkylation step, PU-g-LPEI and PU-g-HPEI were denoted as PU-g-LPEI-R and PU-g-HPEI-R. Alkylation was carried out to enhance the antibacterial character of surfaces. All chemical reactions were confirmed using an Attenuated Total Reflectance-Fourier Transform Infrared Spectrometer (ATR-FTIR) and X-ray Photoelectron Spectrometer (XPS) in detail, previously.25
Surface characterization of PEI brushes by KFM and AFM
To investigate the electrostatic properties of the brush surfaces and morphologies, the KPFM technique was applied. Samples were cut into 3 × 3 mm pieces and attached to the metal sample holder via silver paste to ground the sample surface. The PU and PEI brush (PU-g-LPEI, PU-g-HPEI, PU-g-LPEI-R and PU-g-HPEI-R) surfaces were examined using KPFM. Surface potential and topography images were obtained with an Agilent 5500 AFM (Agilent Technologies, Chandler, AZ) in AC-AFM mode with the MAC III unit (containing three dual phase lock-in amplifiers). 2 × 2 μm2 areas were scanned with a ∼2.3 μm s−1 scan speed. We used a Pt coated silicon cantilever (AC 240 TM, Olympus, Japan) with a nominal spring constant of 2 N m−1 and a nominal tip radius of 20–30 nm. The surface potential images contained 512 data points and the resonance frequency of the cantilever was 60–70 kHz. Additionally, an AC voltage between 4–10 kHz and a DC voltage were applied to the cantilever and the sample was grounded. The KPFM data were analysed using Agilent Technologies PicoView software (1.12.4 version). In addition, roughness calculations were evaluated with Gwyddion 2.34 software. In the single-pass KPFM operation, the resonance frequency of the AC voltage is smaller than the mechanical resonance frequency of the cantilever. Details of the experimental method were published in another report.42Nanoindendation measurements
The nanomechanical properties of the PEI brushes were defined through nanoindentation experiments with an AFM cantilever (Fig. 8). Indentation was carried out at room temperature with a silicon nitride (Si3N4) AFM tip (Bruker) with a 10 pN nm−1 nominal spring constant. All measurements were performed both in aqueous (Milli-Q water) and phosphate buffered saline (PBS) media. 3 × 3 mm sample pieces were stuck on the sample holder with double-faced adhesive tape. The duration of sweep was 2 s and the sweep distance was 1 μm. During nanoindentation experiments more than 150 curves were acquired (>2000 data points for each curve) in both aqueous and PBS media.Data were processed through the Sneddon-like model in eqn (1) which was derived from the Hertz model in eqn (2) for blunted pyramidal tips to define the relation between force and indentation.
 | (1) |
Eqn (1) represents the calculation of loading force (F). The indentation distance (δ) with the following equation, δ = (h − he) = hc, where h is the maximum height, he is effective height and hc is contact depth. ν defines the Poisson ratio and α is the contact radius. Young’s modulus (E, elastic modulus) also can be calculated using eqn (1) for the measured forces.
 | (2) |
Single bacterium interactions by force spectroscopy
Escherichia coli (E. coli) K-12 strain W3110 (wild-type strain) were obtained from the National BioResource Project (NBRP, Japan) and used to evaluate the single bacterium–surface interactions. E. coli strains were grown overnight in 15 mL round tubes containing a Luria–Bertani (LB, Difco) medium at 37 °C and 220 rpm. The cultures were then 100-fold diluted in fresh LB medium and continuously grown at 37 °C with aeration until their optical density at 600 nm reached 0.5.43 The tip-less cantilever (MLCT-O10, Bruker, USA) was coated with poly-L-lysine of molecular weight between 150–300 kDa (Sigma-Aldrich USA) at a concentration of 0.01%. After that, it was incubated in a 5 μL droplet of 0.1% glutaraldehyde solution (Sigma-Aldrich, USA) for 15 min. After the incubation time, the cantilever was washed thoroughly more than 10 times with deionized water. The washed and coated cantilever was again coated with the 20 μL droplet of the bacteria suspension directly set onto the cantilever for 30 min. A single bacterium was attached onto a tip-less Si3N4 AFM cantilever. The spring constant of the cantilever was 30 pN nm−1. Approximately 250 force curves in total from 4 random points were obtained for each sample.Conclusions
In this manuscript, a direct probing technique was applied to PEI brushes to investigate bacteria–PEI brush interactions in a single bacterium resolution. The SCFS study results indicated that bacteria–surface interactions are directly affected by the nanoscale properties of the PEI brushes. Bacteria binding decreases with increasing chain length, charge (alkyl groups) and mobility of the PEI brushes in terms of force and average number. Among the samples, alkylated high molecular weight PEI brushes (PU-g-HPEI-R) indicated robustness against the adhesion of bacteria, having very low binding (%5) and force (56.1 pN). In conclusion, SCFS provides new aspects to determine the interactions between bacteria–PEI brushes at the single bacterium level to deeply understand the antibacterial surface phenomenon. Force microscopy with complementary applications such as AFM, KPFM and SCFS presents a great practicality for determining the interactions and forces between molecules and/or cells at nanometer resolution with piconewton force sensitivity.Acknowledgements
The authors would like to thank the TUBITAK, The Scientific and Technological Research Council of Turkey, (Grant no. 112M293) for providing financial support to this study.Notes and references
- R. Kolter and E. P. Greenberg, Nature, 2006, 441, 300–302 CrossRef CAS PubMed.
- S. K. Lower, in Bacterial Adhesion, Springer, 2011, pp. 285–299 Search PubMed.
- F. Variola, Phys. Chem. Chem. Phys., 2015, 17, 2950–2959 RSC.
- W. R. Bowen, N. Hilal, R. W. Lovitt and C. J. Wright, J. Membr. Sci., 1999, 154, 205–212 CrossRef.
- Y. Liu, P. A. Pinzón-Arango, A. M. Gallardo-Moreno and T. A. Camesano, Mol. Nutr. Food Res., 2010, 54, 1744–1752 CAS.
- A. Beaussart, A. E. Baker, S. L. Kuchma, S. El-Kirat-Chatel, G. A. O’Toole and Y. F. Dufrêne, ACS Nano, 2014, 8, 10723–10733 CrossRef CAS PubMed.
- Y. F. Dufrêne, Trends Microbiol., 2015, 23(6), 376–382 CrossRef PubMed.
- C. Canale, A. Petrelli, M. Salerno, A. Diaspro and S. Dante, Biosens. Bioelectron., 2013, 48, 172–179 CrossRef CAS PubMed.
- M. Nonnenmacher, M. P. o'Boyle and H. K. Wickramasinghe, Appl. Phys. Lett., 1991, 58(25), 2921–2923 CrossRef.
- H. Jacobs, P. Leuchtmann, O. Homan and A. Stemmer, J. Appl. Phys., 1998, 84, 1168–1173 CrossRef CAS.
- M. van Landingham, S. McKnight, G. Palmese, J. Elings, X. Huang, T. Bogetti, R. Eduljee and J. Gillespie Jr, J. Adhes., 1997, 64, 31–59 CrossRef CAS.
- D. Tranchida, S. Piccarolo and M. Soliman, Macromolecules, 2006, 39, 4547–4556 CrossRef CAS.
- D. Tranchida, Z. Kiflie, S. Acierno and S. Piccarolo, Meas. Sci. Technol., 2009, 20, 095702 CrossRef.
- R. Ferencz, J. Sancheza, B. Blümichb and W. Herrmanna, Polym. Test., 2012, 425–432 CrossRef CAS.
- P. Hinterdorfer and Y. F. Dufrêne, Nat. Methods, 2006, 3, 347–355 CrossRef CAS PubMed.
- E. P. Wojcikiewicz, X. Zhang and V. T. Moy, Biol. Proced. Online, 2004, 6, 1–9 CrossRef CAS PubMed.
- J. Helenius, C.-P. Heisenberg, H. E. Gaub and D. J. Muller, J. Cell Sci., 2008, 121, 1785–1791 CrossRef CAS PubMed.
- R. Mahaffy, S. Park, E. Gerde, J. Käs and C. Shih, Biophys. J., 2004, 86, 1777–1793 CrossRef CAS PubMed.
- D. Hoffman, I. Miskioglu, K. E. Aifantis and J. Drelich, J. Adhes. Sci. Technol., 2012, 26(8–9), 1201–1220 CAS.
- H. Hertz, Leipzig, 1895, 1, 2 Search PubMed.
- I. N. Sneddon, Int. J. Eng. Sci., 1965, 3(1), 47–57 CrossRef.
- T. P. Schaer, S. Stewart, B. B. Hsu and A. M. Klibanov, Biomaterials, 2012, 33, 1245–1254 CrossRef CAS PubMed.
- J. Hasan, R. J. Crawford and E. P. Ivanova, Trends Biotechnol., 2013, 31, 295–304 CrossRef CAS PubMed.
- H. Murata, R. R. Koepsel, K. Matyjaszewski and A. J. Russell, Biomaterials, 2007, 28, 4870–4879 CrossRef CAS PubMed.
- M. Gultekinoglu, Y. T. Sarisozen, C. Erdogdu, M. Sagiroglu, E. A. Aksoy, Y. J. Oh, P. Hinterdorfer and K. Ulubayram, Acta Biomater., 2015, 21, 44–54 CrossRef CAS PubMed.
- L. Timofeeva and N. Kleshcheva, Appl. Microbiol. Biotechnol., 2011, 89, 475–492 CrossRef CAS PubMed.
- K. Yusoh, J. Jin and M. Song, Prog. Org. Coat., 2010, 67, 220–224 CrossRef CAS.
- P. Schön, K. Bagdi, K. Molnár, P. Markus, B. Pukánszky and G. J. Vancso, Eur. Polym. J., 2011, 47, 692–698 CrossRef.
- R. Williams, Y. Krishna, S. Dixon, A. Haridas, I. Grierson and C. Sheridan, J. Mater. Sci.: Mater. Med., 2005, 16, 1087–1092 CrossRef CAS PubMed.
- K. Webb, W. Li, R. W. Hitchcock, R. M. Smeal, S. D. Gray and P. A. Tresco, Biomaterials, 2003, 24, 4681–4690 CrossRef CAS PubMed.
- J. L. Cuellar, I. Llarena, J. J. Iturri, E. Donath and S. E. Moya, Nanoscale, 2013, 5, 11679–11685 RSC.
- M. Biesalski and J. Rühe, Macromolecules, 2002, 35, 499–507 CrossRef CAS.
- T. Farhan, O. Azzaroni and W. T. Huck, Soft Matter, 2005, 1, 66–68 RSC.
- J. N. Israelachvili, Intermolecular and surface forces, Academic press, 3rd edn, 2011 Search PubMed.
- W. Wang, K. Li, M. Ma, H. Jin, P. Angeli and J. Gong, Adv. Colloid Interface Sci., 2015, 225, 88–97 CrossRef CAS PubMed.
- H.-J. Butt, B. Cappella and M. Kappl, Surf. Sci. Rep., 2005, 59, 1–152 CrossRef CAS.
- D. Julthongpiput, M. LeMieux and V. Tsukruk, Polymer, 2003, 44, 4557–4562 CrossRef CAS.
- Y. He, E. Heine, N. Keusgen, H. Keul and M. Möller, Biomacromolecules, 2012, 13, 612–623 CrossRef CAS PubMed.
- A. M. Bieser and J. C. Tiller, Macromol. Biosci., 2011, 11, 526–534 CrossRef CAS PubMed.
- Q. Lu, J. Wang, A. Faghihnejad, H. Zeng and Y. Liu, Soft Matter, 2011, 7, 9366–9379 RSC.
- K. A. Gibney, I. Sovadinova, A. I. Lopez, M. Urban, Z. Ridgway, G. A. Caputo and K. Kuroda, Macromol. Biosci., 2012, 12, 1279–1289 CrossRef CAS PubMed.
- S. Magonov and J. Alexander, Beilstein J. Nanotechnol., 2011, 2, 15–27 CrossRef CAS PubMed.
- Y. J. Oh, Y. Cui, H. Kim, Y. Li, P. Hinterdorfer and S. Park, Biophys. J., 2012, 103, 1666–1671 CrossRef CAS PubMed.
Footnote |
| † These two authors contributed equally. |
| This journal is © The Royal Society of Chemistry 2016 |


