
Evolution of confined species and their effects on catalyst deactivation and olefin selectivity in SAPO-34 catalyzed MTO process†
Mingjian Luo*ab,
Hongyan Zanga,
Bing Hua,
Baohui Wanga and
Guoliang Maoa
aProvincial Key Laboratory of Oil & Gas Chemical Technology, College of Chemistry & Chemical Engineering, Northeast Petroleum University, Daqing 163318, P.R. China. E-mail: luomingjian@nepu.edu.cn; Tel: +86 459 6507736
bQiTaiHe BaoTaiLong Coal Chemical Co., Ltd., QiTaiHe 154000, P.R. China
First published on 19th January 2016
Abstract
Confined species in SAPO-34 cages participate in methanol reaction and affect product selectivity as well as leading to the deactivation of the catalyst during the MTO process. In this work, spatial- and time-evolution of the confined species in a fixed bed are investigated by TG and dissolution–extraction experiment. Results indicate that both methanol and olefins lead to the formation of confined methylbenzenes and methylnaphthalenes, which are active intermediates in the MTO process. These intermediates further transformed into phenathrene and pyrene in the methanol reaction section and led to the deactivation of the catalyst. A pseudo-steady state period, during which selectivities of products are relatively stable, is achieved while most of cages are occupied by naphthalene and methylnaphthalenes. Confined species reduce the cage volume for products and reactants and thus affect product selectivities. Empty cages are likely to form relatively large-size products like C4 and C5+ molecules. Cages occupied by large-size methylnaphthalenes tend to form more ethene, less propene and even less C4+ products than those occupied by relatively small methylbenzenes. Simultaneously, secondary reactions of olefins, which increase the formation of alkanes and C4+ products during the initiation period, are greatly reduced in the pseudo-steady state period since olefins are hindered from entering occupied cages. As a result, ethene and propene selectivities and C2/C3 ratio tend to increase while C4+ and alkane selectivities decrease with the prolonging of time on stream.
1 Introduction
Light olefins, which are the foundation of the chemical industry, are mainly produced via steam cracking of distillates from crude oil. The increase in energy demand and the limitation of crude oil reserves motivate scientists to pursue substitute feedstocks for olefin production. Using methanol synthesized from syngas, the methanol-to-olefins (MTO) process offers a feasible and applicable route for the production of light olefins from the abundant natural gas or coal and the regenerative biomass.1–4 This process is catalyzed by shape-selective acidic zeolites, such as ZSM-5, SAPO-34, MOR, etc.SAPO-34 is an excellent zeolite for the catalyzation of MTO. Due to its shape selectivity chabasite structure small pores, only product molecules small enough easily get through the narrow pores and the hydrocarbon products are mostly ethene and propene. Accompanying the formation of olefins, large molecules are also formed and confined within the SAPO-34 cages. These large molecules constitute the “hydrocarbon pool”,5–10 participate in the transformation of methanol to olefins as well as further transforming into coke content and leading to the deactivation of the catalyst.11–13 Methylbenzenes are found to be high-efficiency “hydrocarbon pool” species in MTO process.6–8,14–20 However, methylbenzenes would further transform into methylnaphthalene derivatives, phenanthrene derivatives, and then pyrene.8,20–26 These large aromatic molecules occupy the nanocages of SAPO-34 and reduce mass transfer of reactant and products. Especially pyrene, the largest molecule that can be accommodated in SAPO-34 cages, may fully block the cages.8,20–24 As a result, the conversion of methanol is suppressed and the catalyst is deactivated. In addition to the deactivation of catalyst, the types and the amount of confined species also greatly affect product selectivity. Several researchers have noted that ethene selectivity and C2/C3 ratio tend to increase with the time on stream (TOS).14,26–31 Song et al.14 stated that methyl number of methylbenzenes affects product selectivity: methylbenzenes with four to six methyl groups benefit the product of propene while dimethylbenzenes and trimethylbenzenes mainly lead to the formation of ethene. This opinion is supported by theoretical study.15 Song et al.27 also found that methylnaphthalenes is ca. one-third as active as methylbenzenes, but the former-based catalyst obtains higher ethene selectivity than the latter-based one. Chen et al.28 correlated the product selectivities with coke percentage. They found that ethene increase while propene, butene and C5+ decrease with the increase of coke amount. They proposed that larger-sized reaction intermediate reduces free space in cages, thus suppresses the formation of larger molecules and enhances the formation of ethene. Confined species also reduce the diffusivity of reactants and products, which benefits the formation of light products.22,29–33 To depict the time-evolution of catalyst bed during MTO experiment, Haw and Marcus21 proposed a “cigar burn” mechanism. They regarded the induction period, during which sufficient methylbenzenes are formed, as the lighting of cigar. Then a band of active catalyst moves downstream, leaving deactivated catalyst in its wake. They stated that products shift from water and dimethyl ether, to a mixture of light olefins and water, and then finally back to water and dimethyl ether. However, they didn't further discuss the evolution of confined species, the secondary reaction of olefins, and their roles in catalyst deactivation and products selectivities.
In this work, spatial- and time-evolution of confined species along the catalyst bed in SAPO-34 cages were investigated by TG and dissolution–extraction experiment. A “three sections, three periods” mechanism is proposed to explain the formation and transformation of confined species as well as its effects on catalyst deactivation and product selectivity.
2 Experimental
Commercial SAPO-34 catalyst (ca. 4–5 μm, Fig. S1†) was obtained from Chemist Corporation. Generally, 0.8 g catalyst (40–80 mesh) was loaded in the isothermal zone of a fixed bed quartz reactor (8 mm i.d.) and separated into four equal segments by quartz wool. High purity nitrogen was used as carrier gas. Prior to the experiment, catalyst was activated at 550 °C under a 50 mL min−1 flowing nitrogen for 4 hour. Then the temperature was lowered to 425 °C, at which methanol was injected by a syringe pump at 1 mL h−1. Product was in situ analyzed with an Agilent 4890 GC equipped with an HP-PLOT Q capillary column (30 m × 0.32 mm × 20 μm) and an FID detector. The feeding of methanol was stop at 50, 100, 150 or 200 min. Then the oven was open and the reactor was removed from the oven.Total amount of confined species, hereinafter called coke, was analyzed on a Perkin Elmer Diamond TG/DTA instrument. After the sample (about 10 mg) was loaded, analysis was performed under an 80 mL min−1 flowing air from room temperature to 800 °C at a ramp rate 15 °C min−1.
Confined species in SAPO-34 cages were analyzed by dissolution–extraction experiments. Typically, 15 mg of the coked catalyst was dissolved in 0.5 mL 15% HF in polyethene tube. Organic compounds were extracted from the water phase by 0.5 mL CCl4. Then the extracted phase was analyzed on a Shimadzu GC 14 equipped with an SE 30 capillary column (30 m × 0.32 mm × 0.25 μm) and an FID detector. The species were preliminarily identified by a Thermo Fisher Trace GC-MS equipped with a TR-1 MS capillary column (30 m × 0.25 mm × 0.25 μm).
3 Results
3.1 TG/DTA analysis
The thermogravimetric (TG) and differential thermal analysis (DTA) profiles of coked catalysts in the presence of flowing air are showed in Fig. S2 and S3,† respectively. The derivative thermogravimetric (DTG) profiles are showed in Fig. 1. The weight loss at low temperature (<300 °C) can be ascribed to the loss of physical and chemical adsorbed water.34,35 The weight loss above 300 °C is related to the oxidation of two types coke confined in catalyst cages: coke I, which relates to more H-rich species like alkylated aromatics, can be oxidized at a relative low temperature; and coke II, which relates to more carbonaceous ones like bulky polyaromatics, needs a relative high temperature to oxidize.12,32,35,36 In the DTA results (Fig. S3†), an exothermal peak corresponding to the oxidation of coke I initiates at about 300 °C, achieves the largest weight loss rate between 420 and 480 °C, and ends at about 500 °C; while the one of coke II takes place above 500 °C. Obviously, with regard to catalyst located at the same position of the bed, coke amount increases as well as the initiative oxidation temperature shift to higher with the prolonging of TOS, which implies that more coke is formed as well as coke I is gradually transformed into coke II. While the effect of catalyst position is concerned, it is observed that more coke II is formed on the upper section catalyst than that on the lower section ones.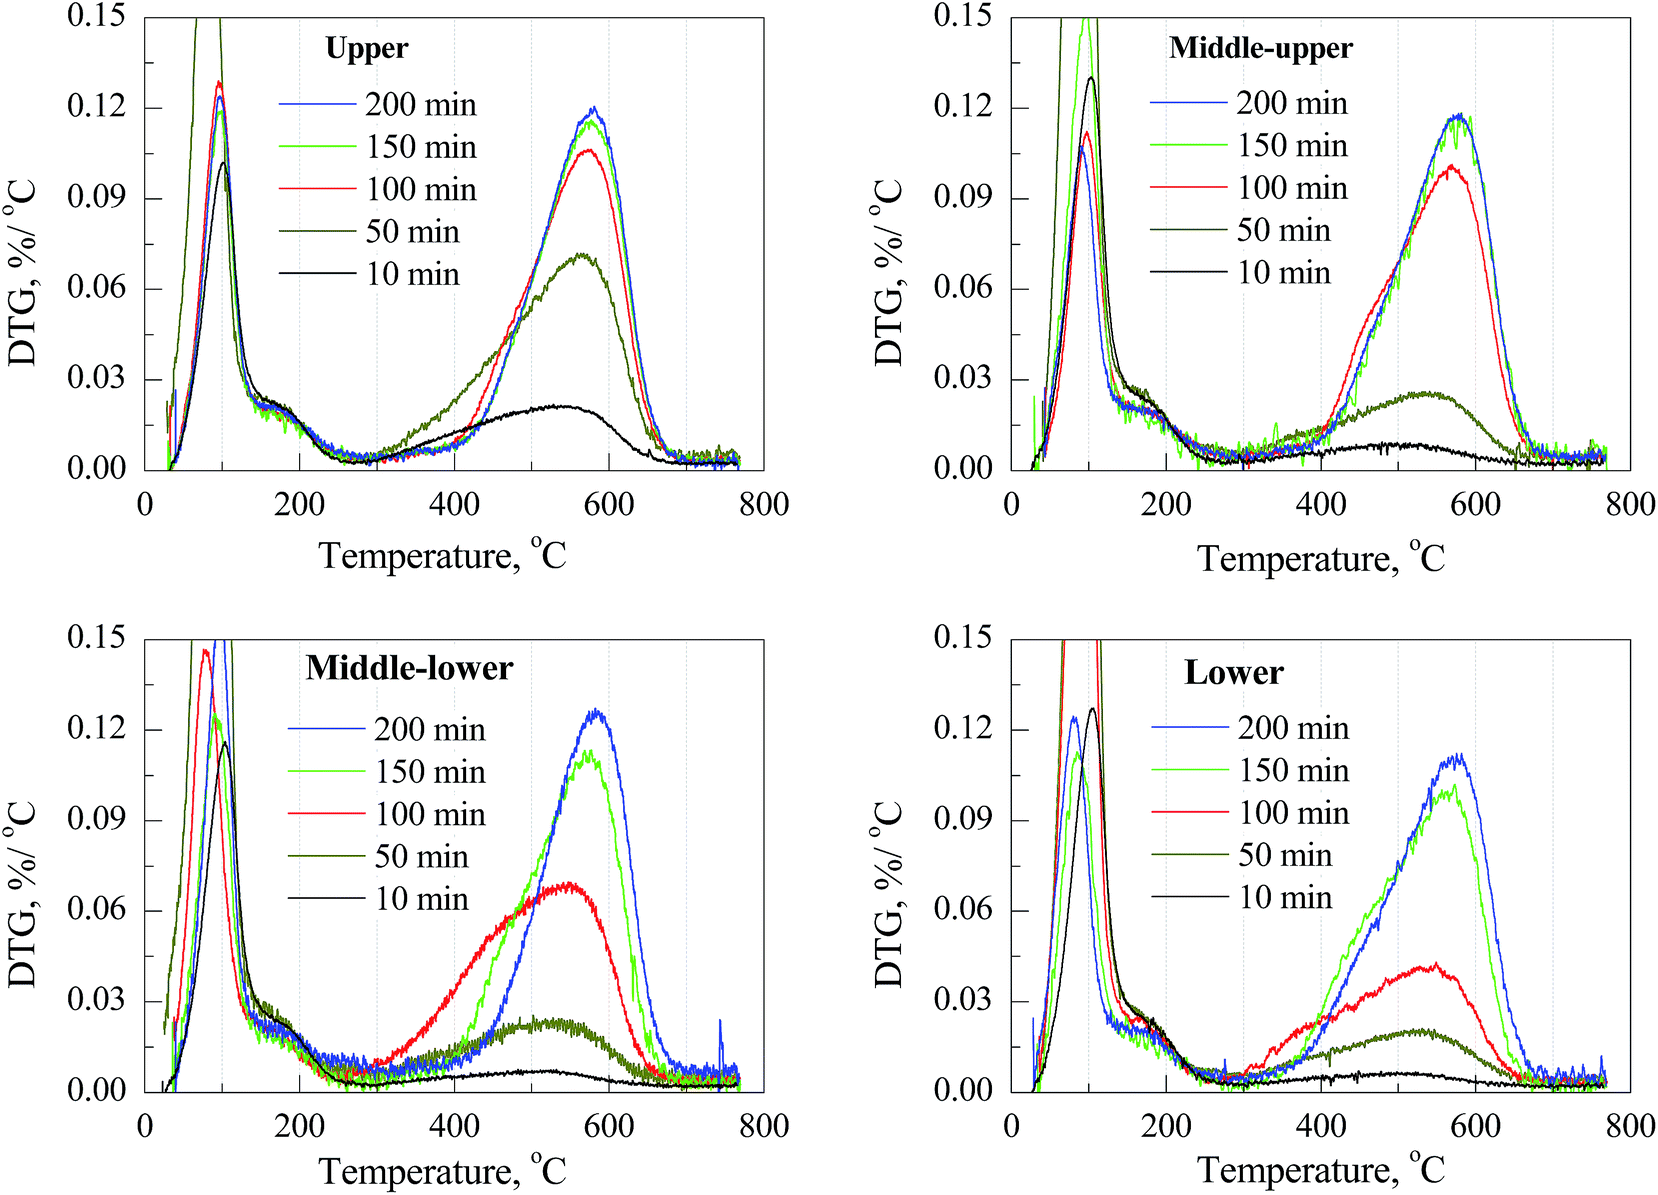 | ||
| Fig. 1 DTG profiles of coked catalysts located at different position with different time on stream. | ||
The weight loss between 300 and 750 °C, which corresponding to the coke weight deposited in catalyst pore, is illustrated in Fig. 2. Concerning catalyst at same bed position, coke weight increases with the prolonging of TOS. At 10 min, the coke weights of the upper, middle-upper, middle-lower and lower section catalysts are 56.4, 25, 21.5 and 19.6 mgcoke gcatalyst−1, respectively. These values come to 153, 66.9, 66.4 and 55.4 mgcoke gcatalyst−1 at 50 min. The upper section catalyst shows a much higher coke deposit speed than the lower three sections while the laters have similar coke deposit rate during 50 min. The coke weights of upper and middle-upper catalysts hardly increase after 100 min, while the ones of middle-lower and lower catalysts hardly increase after 150 min. The ultimate coke weights are about 200 mgcoke gcatalyst−1.
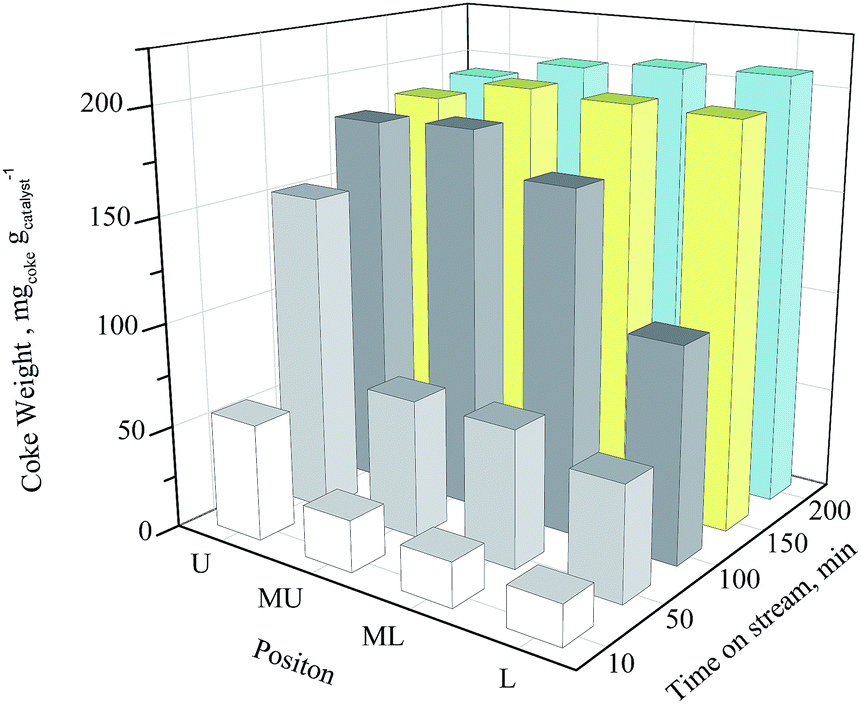 | ||
| Fig. 2 Coke weight of coked catalyst along catalyst bed with different time on stream. U: upper section catalyst; MU: middle-upper section catalyst; ML: middle-lower section catalyst; L: lower section catalyst. | ||
3.2 Coke species
Confined hydrocarbon species of coked catalysts were analyzed by dissolution–extraction experiment. Gas chromatograms are showed in Fig. S4.† Similar to reported results,25,26 methylbenzene, polymethylbenzenes, naphthalene and its methylation products, phenathrene and its methylation products, pyrene and methylpyrenes are detected. Fig. 3 shows the weight of hydrocarbons confined in the cage catalyst. The values are calculated via the percentages of hydrocarbons from gas chromatograms and the total coke amount from TG results (Tables S1 and S2†).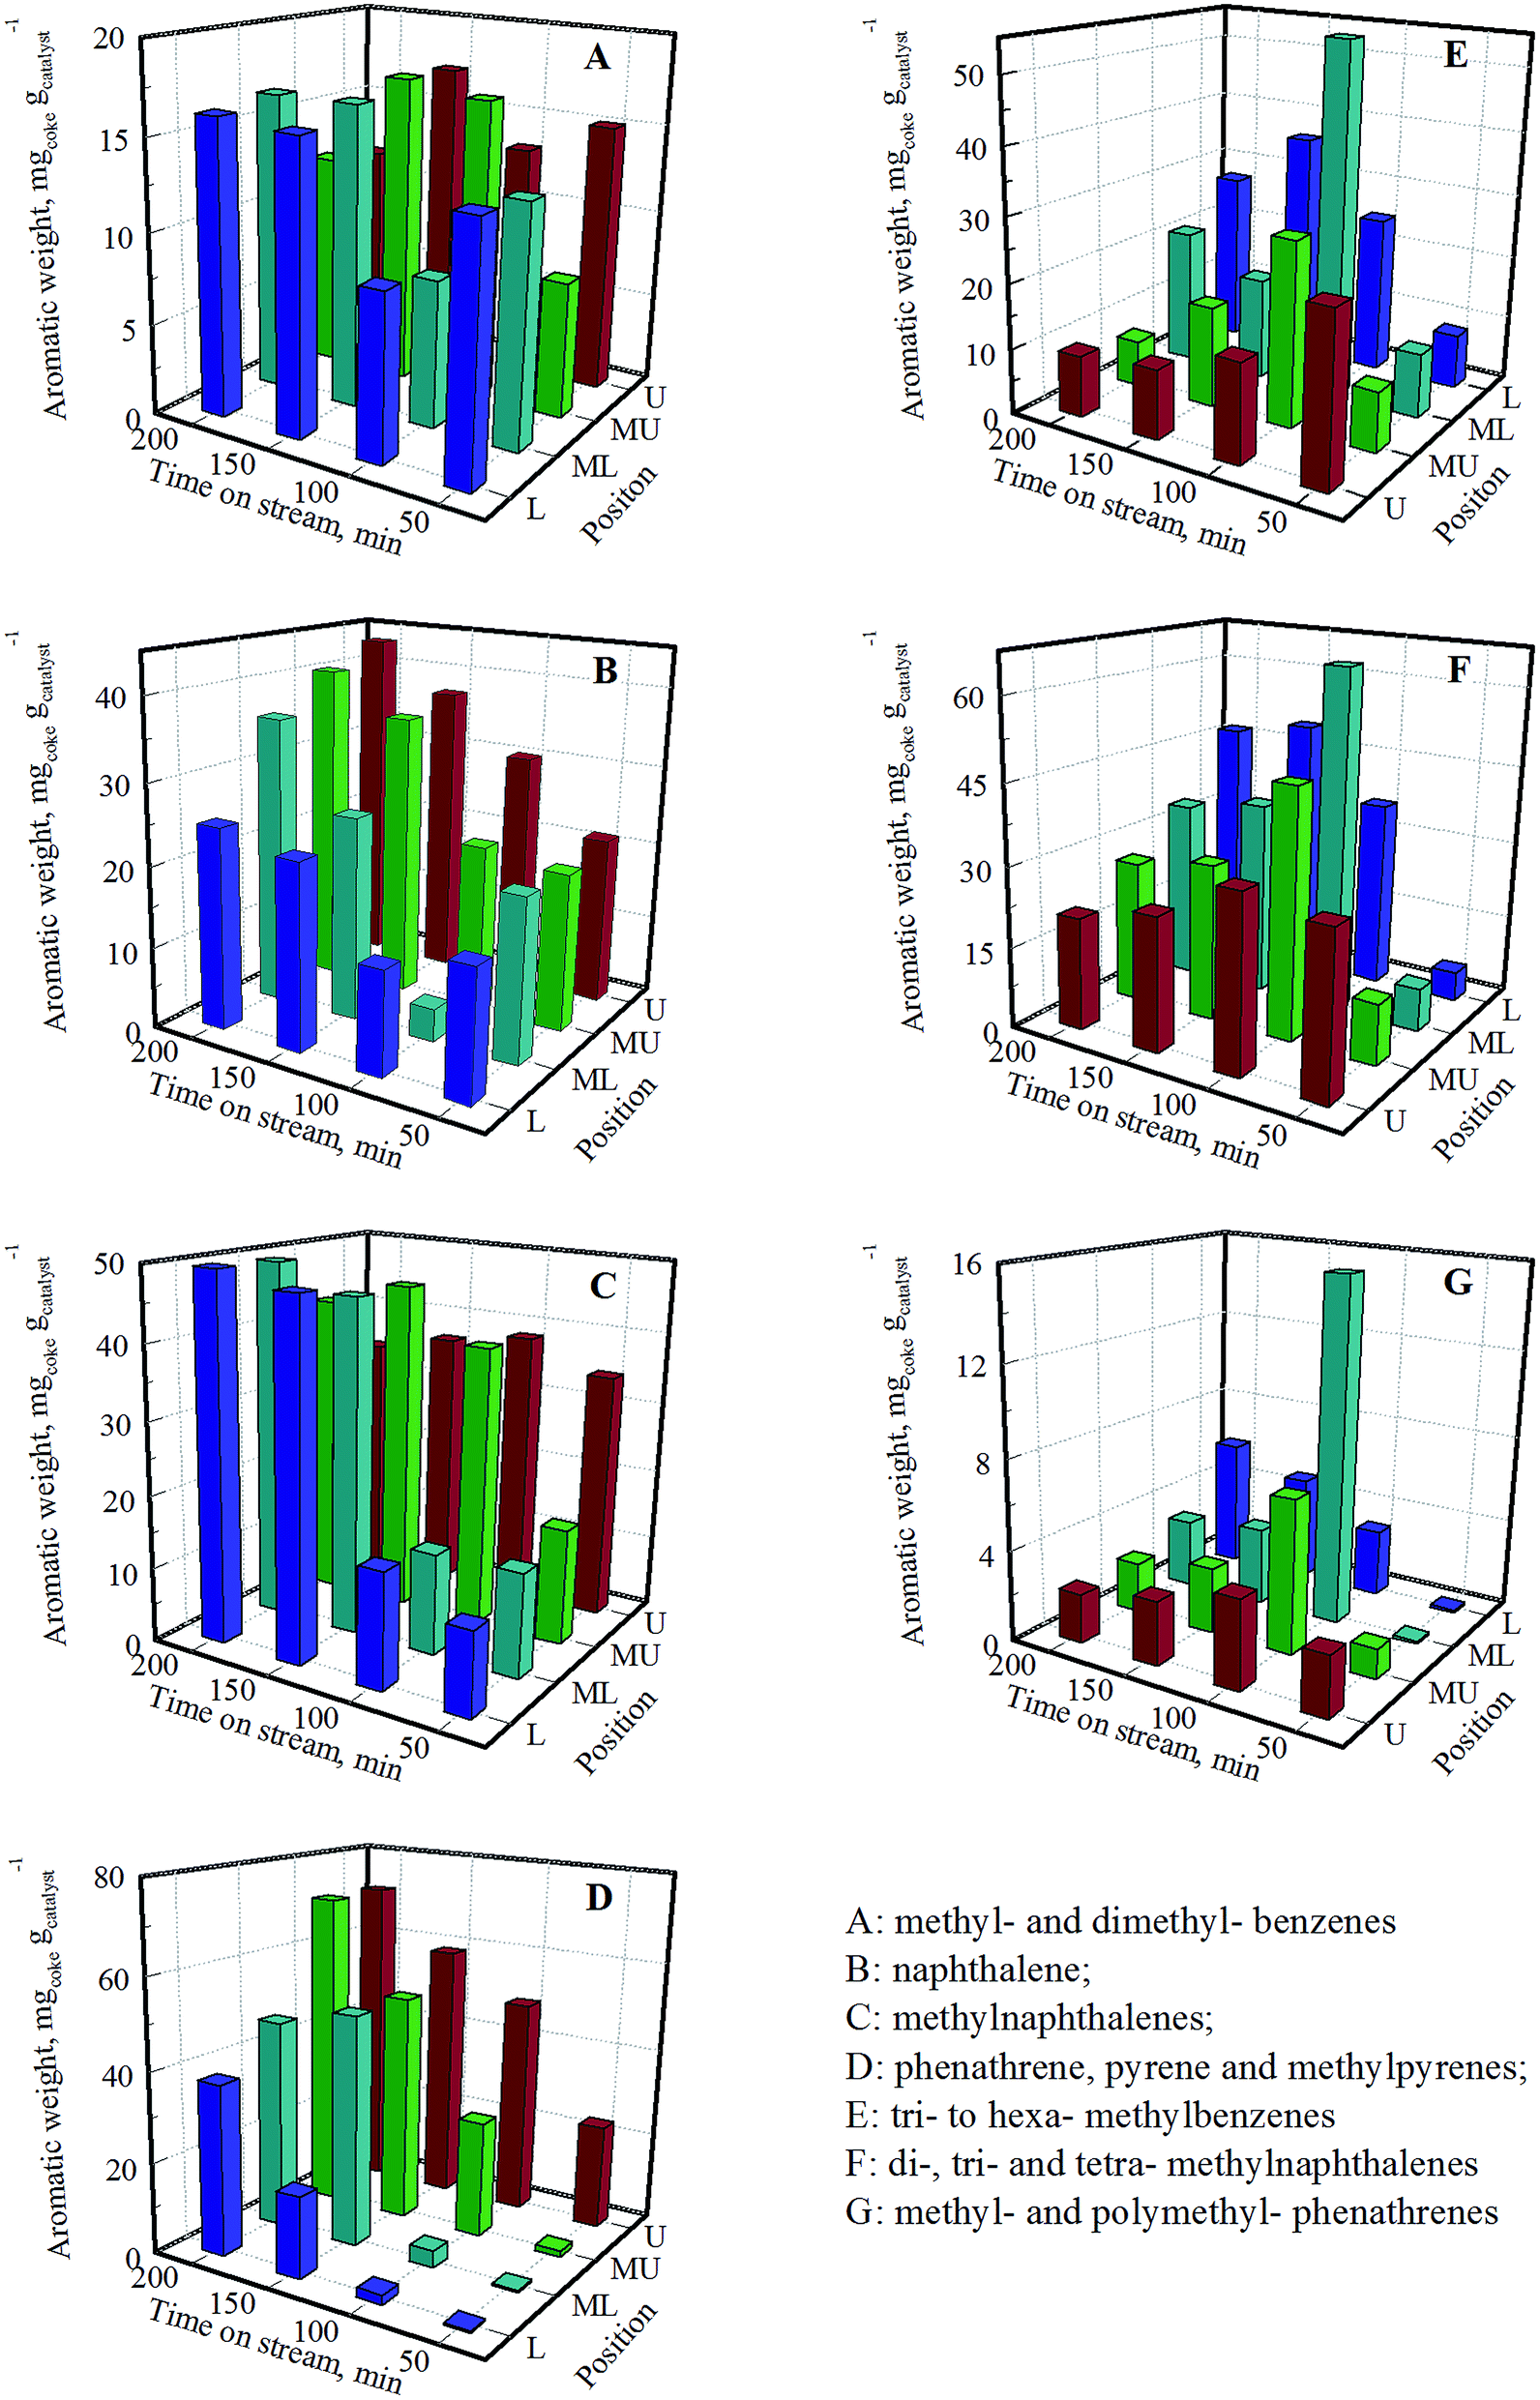 | ||
| Fig. 3 Weight of confined aromatic species in coked catalyst. | ||
As observed in Fig. 3A, 10–15 mgcoke gcatalyst−1 methylbenzene and dimethylbenzene are trapped in most of coked catalysts. The middle-upper catalyst at 50 min, the middle-lower and lower catalysts at 100 min, and the upper and middle-upper catalyst at 200 min have relative low methylbenzene and dimethylbenzene content. Fig. 3E–G show that upper catalysts with short TOS, middle catalysts with moderate TOS and lower catalysts with long TOS have abundant amount of polymethylbenzenes, polymethylnaphthalenes and methylpyrenes, while lower catalysts with short TOS and upper catalysts with long TOS are opposite. Fig. 3B and D show that the upper and long TOS catalysts tend to form more naphthalene, phenathrene, pyrene and methylpyrenes, especially the latter three types of aromatics. The evolution of methylnaphthalenes (Fig. 3C) is somewhat similar to above-mentioned species. However, it keeps a high reservation for upper catalysts with long TOS.
3.3 Product selectivity
To investigate the role of upper and lower section catalyst in MTO process, product selectivities of 0.2, 0.4 and 0.8 g catalyst are contrasted at a same feed rate. Results are shown in Table S3† and Fig. 4. Methanol can fully converse to hydrocarbons for 10, 50 and 150 min TOS with 0.2, 0.4 and 0.8 g catalyst, respectively. In case of full methanol conversion, it can be observed that the selectivities of alkanes, C4 products and C5+ products decrease while the ones of ethene and propene increase with the increase of TOS. While methyl ether presents in the product, the selectivities of methane and ethane in hydrocarbons begin to increase with even longer TOS. These results are consistent with literatures.37–39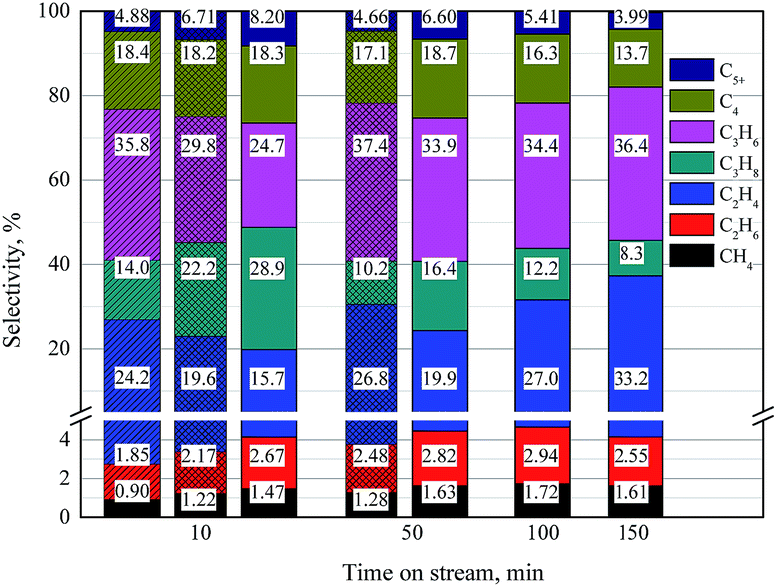 | ||
| Fig. 4 Product selectivity during MTO process. Fill with color and slope line: 0.2 g catalyst; fill with color and grid: 0.4 g catalyst; fill with only color: 0.8 g catalyst. | ||
Contrast the products at same TOS, we can found that the selectivities of alkanes and C5+ products increase while the ones of ethene and propene decrease with the increase of catalyst amount. This result implies that ethene and propene are further catalyzed by the lower section catalyst and transferred into alkanes and heavy products.
4 Discussions
4.1 Evolution of confined species
Based on the coke analysis and product selectivity, a coke evolution mechanism is proposed in Fig. 5. This mechanism further supplements and improves the “cigar burn” mechanism proposed by Haw and Marcus.21 In this mechanism, the reaction process is temporally divided into three periods: initiation period, pseudo-steady state period and breakthrough period. The catalyst bed is spatially divided into three sections: deactivated section, methanol reaction section and olefin reaction section.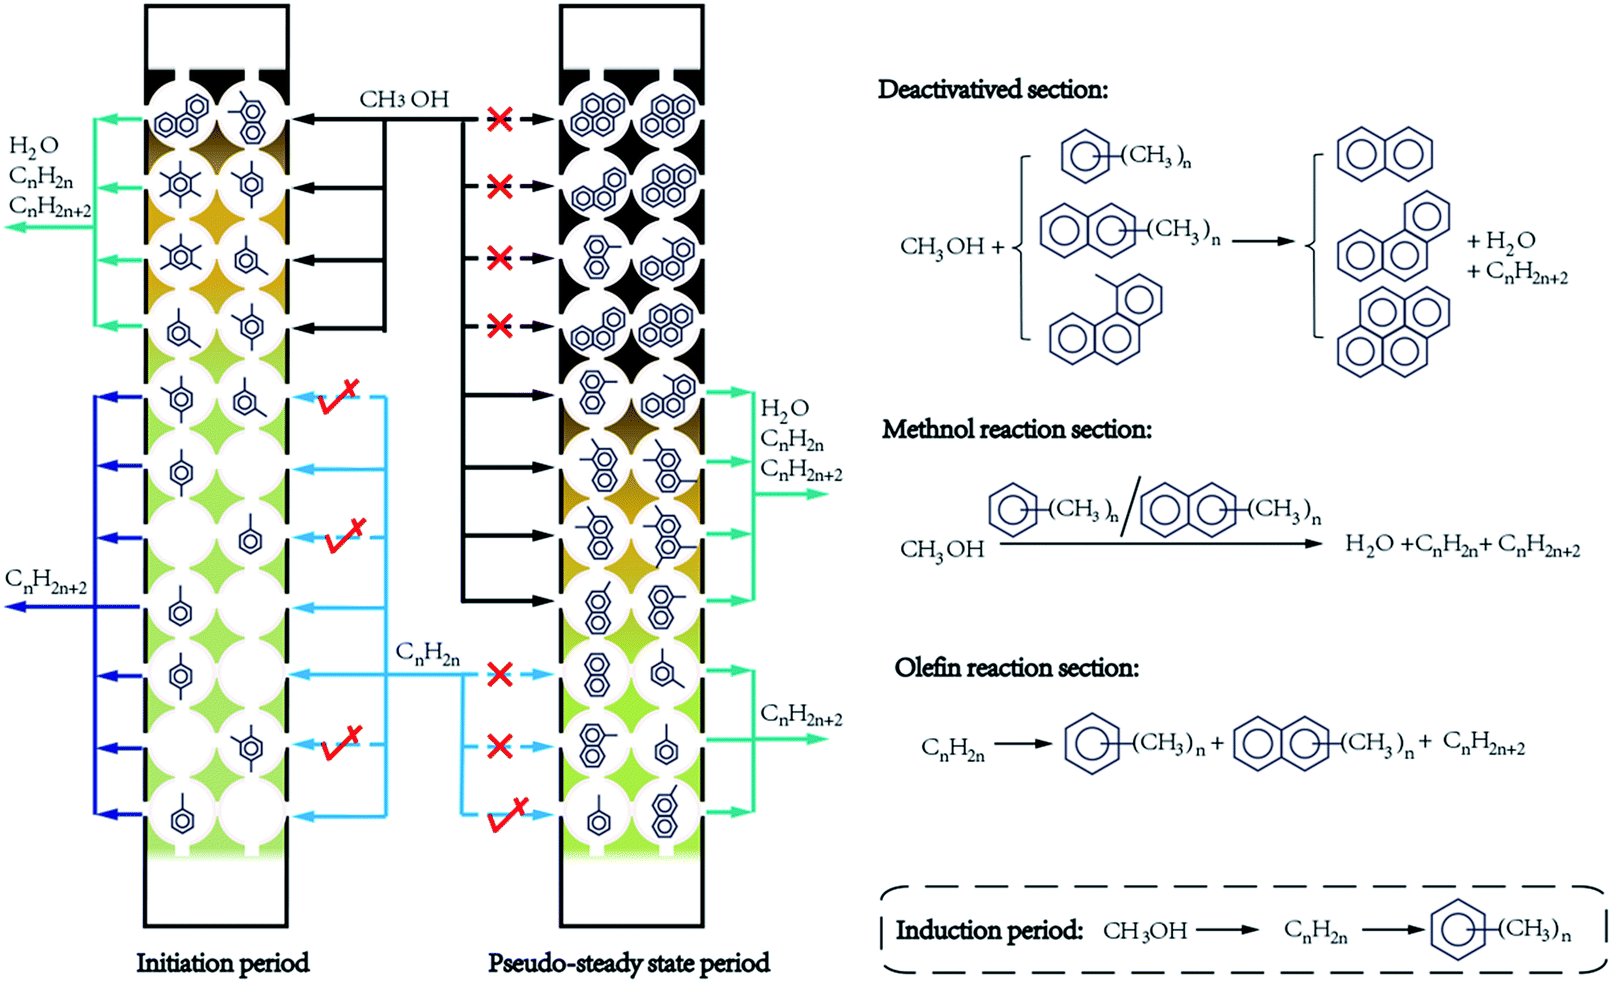 | ||
| Fig. 5 Space and time evolution of coke species during MTO process. | ||
We assign the early stage that product selectivity apparently varies to be initiation period. This period begins with the induction period during which C–C bonds are initially formed.7,40–44 As observed by pulse reaction experiment, the induction period is very short.40 In this period, hydrocarbon pool are initialized and methanol reaction is accelerated.6,16,17,42 It can be observed in Fig. 4 that a small amount of catalyst is sufficient for the full conversion of methanol. Thus methanol reaction section is formed at the top part of catalyst bed. In this section, the methylation of confined species with methanol increases the methyl number of polymethylbenzenes. Thus as showed in Fig. 3, S4, Tables S1 and S2,† this section tends to have more methyl-rich species than methyl-lack ones. Methyl- and dimethyl-benzenes even decrease in amount in this section. The decomposition of methyl-rich species produces light olefins. Simultaneously, polymethylbenzenes increase in amount, gradually further condense into H-deficient diaromatics, triaromatics, and tetraaromatics. To balance the formation of H-deficient aromatics, alkanes are also formed.
Methanol can be full converted after induction period. However, product selectivities change greatly with TOS and steady state is not achieved. Thus the initiation period goes on. Contrast the products of 0.2, 0.4 and 0.8 g catalyst at TOS 10 min (Fig. 4), it can be found that 0.4 g catalyst produces less ethene and propene than 0.2 g catalyst, even less ethene and propene are in products of 0.8 g catalyst. In other word, 8.5% ethene and 11.1% propene are converted into 0.57% methane, 0.82% ethane, 14.9% propane and 3.32% C5+ by the lower 0.6 g of 0.8 g catalyst. At TOS 50 min, 6.9% ethene and 3.5% propene are further converted into alkanes by the lower half of 0.8 g catalyst. Therefore, though olefins are less reactive than methanol,9,10 they are catalyzed by the lower section of catalyst bed.45 Hence, this section can be named olefin reaction section. In this section, olefins transform into alkanes and confined aromatics (Fig. 2, 3 and S4, Tables S1 and S2†). Inter-transformation of olefins might also take place.
With the proceeding of reaction, confined species transform from methylbenzenes to methylnaphthalene, and then to phenathrenes and pyrenes. This transformation affects MTO reaction. With the evidences that (1) contrast products of different amount of catalyst, less ethene than propene is converted in 10 min while it is reverse in 50 min; (2) propene selectivities of 0.8 g catalyst hardly change after 50 min; (3) ethene selectivity tends to be stable with the extending of TOS; (4) very little phenathrene and pyrene, especially pyrene, is formed in olefin reaction section; and (5) molecule sizes decrease in the order of propene > ethene > methanol, it is reasonable to conclude that propene is the easiest one to be prevented from entering confined molecule occupied cage, then ethene, and methanol is the last. In consideration of confined molecules size (Table 1), SAPO-34 cage size, and confined species distribution (Fig. 3), we supposed that naphthalene and methylnaphthalenes are large enough to prevent most of olefin molecules from entering SAPO-34 cages. When most of catalyst cages are occupied by naphthalene and methylnaphthalenes, the secondary reactions of olefin become negligible. Nevertheless, catalytic activity for methanol is still remained for this so-called olefin reaction section. The product selectivities become relative stable, but still change slowly. Confined species transform slowly as well. This period can be named pseudo-steady state period.
| Hydrocarbon | rg × 2, Å | Hydrocarbon | rg × 2, Å |
|---|---|---|---|
| Methanol | 2.41 | Dimethylbenzenes | 4.92–5.30 |
| Methane | 1.99 | Trimethylbenzenes | 5.26–5.60 |
| Ethene | 2.64 | Tetramethylbenzenes | 5.65–5.77 |
| Ethane | 2.81 | Pentamethylbenzene | 5.96 |
| Propene | 3.37 | Naphthalene | 5.26 |
| Propane | 3.41 | Methylnaphthalenes | 5.57–5.87 |
| Linear butenes | 4.20–4.33 | Dimethylnaphthalenes | 5.77–6.19 |
| Linear pentenes | 4.32–4.59 | Phenathrene | 6.28 |
| Methylbenzene | 4.64 | Pyrene | 6.48 |
Further transformation of confined species into phenathrenes and pyrenes mainly takes place in methanol reaction section. Phenathrene, methylphenanthrenes and pyrene, especially pyrene, are similar size to the SAPO-34 cage. Therefore, they block the cages, hinder the diffusion of methanol and lead to the deactivation of catalyst.21,25,26,32,33 Deactivated section catalyst arises at the top part of catalyst bed. Amount of polymethyl species decrease rapidly in deactivated section. However, certain amount of methylbenzenes and methylnaphthalenes species, especially single methyl ones, still remains in this section (Fig. 3 and S4†). Isotopic switch experiment clearly demonstrated that these light species are not accessible to methanol feed in deactivated catalysts.26 According to in situ UV/Vis spectroscopy, these methyl species are located at the near-core region of SAPO-34 crystals and surrounded by the near-surface region phenathrene and pyrene.23,46 Though active in methanol conversion, they are inaccessible for reactant. Scale down the crystal size of SAPO-34 would reduce the percentage of these still active confined species. Thus, longer lifetime were observed on small size SAPO-34s than on large ones.24,31,47,48
Accompany with the deactivation of catalyst, methanol reaction section moves toward the export of catalyst bed with the progress of reaction. While most of the catalyst bed are deactivated, methanol can't fully convert into olefins. The reaction turns into break through period. In this period, methanol conversion keeps decrease until the catalyst is fully deactivated.
4.2 Synergy between SAPO-34 cage and confined species and its effect on product selectivity
The CHA structure SAPO-34 zeolite has a 6.5 × 11 Å cage and six 3.8 × 3.8 Å windows connected to this cage.19,21 It is unnecessary to further discuss the well known shape selective effect of the window. We focus on the synergy between SAPO-34 cage and confined species here. The volume of cage for reactant and product depends on the sizes of confined species. The larger the confined species are, the smaller the reactant can enter into the cages and the less likely large size products to form. Gyration radiuses, although not equivalent to kinetic diameters of molecules, are calculated by Chem 3D for main product molecules and confined species to aid the discussion. Values are listed in Table 1.At the beginning of initiation period, only a few SAPO-34 cages are filled with methylbenzene and polymethylbenzenes while most are empty. The volume of empty cage is large enough for the formation of large molecules. Therefore, considerable amount of C4 and C5+ products (26.5%) is formed at short TOS as well as selectivity of C3 (53.6%) is 2.92 times as high as the one of C2 (Fig. 4 and Table S3†). Simultaneously, olefins are easy to enter into the empty cages and transform into confined species and alkanes, which further decreases the selectivities of ethene and propene while increases those of ethane and propane at short TOS. As a result, selectivities of alkanes and C5+ are high at short TOS.
Gradually, most of SAPO-34 cages are filled with confined species, which reduces the production of large molecules like C5+. Naphthalene and its methylation products arise and increase in both methanol reaction section and olefin reaction section. Since they are larger than methyl- and polymethyl-benzenes, residual cage volume for olefin products is shrinking. Large-size molecules, even propene, are less likely to form in methylnaphthalene occupied cages. As a result, the formation of large molecule is further reduced. The formation of propene is also reduced in a certain extent.27 Additionally, the diffusion of olefins into cages is reduced by confined species at the olefin reaction section, which favors the selectivities of olefins. The relative large size propene is more likely to be excluded than ethene. Thus 3.9% ethene and 5.1% propene are converted by the lower half 0.4 g catalyst at TOS 10 min while the value are 6.9% and 3.5% at TOS 50 min.
While pseudo-steady state period is achieved, naphthalene and its methylation products become main confined species in methanol and olefin reaction sections. Their amount reaches 110–120 mg gcatalyst−1 (Fig. 3 and Table S2†), which is much more than that of methyl- and polymethyl-benzenes (30–50 mg gcatalyst−1). Therefore, we suggest that methylnaphthalenes, rather than methylbenzenes, are dominative organic reaction centers for methanol conversion during pseudo-steady state period. Because methylnaphthalenes are larger size than methylbenzenes, more ethene and propene, especially ethene, are tend to form with the extending of TOS.
In summary, confined species increase in size during the reaction process which reduces the cage volume for reactants and products. As a result, C4+ product decreases, propene first increases and then decreases, while ethene and C2/C3 ratio increase with the prolonging of TOS.
5 Conclusions
Confined species, such as methylbenzenes and methylnaphthalenes, are gradually form and transform in SAPO-34 cages by the conversion of methanol and olefins during initiation period. These confined species accelerate the methanol reaction, but their formation is accompanied with the formation of alkanes which lowers the olefin selectivity. Olefin reactions become insignificant and product distribution is relative stable when most of SAPO-34 cages are occupied by methylbenzenes and methylnaphthalenes. Hereinafter, reaction turns into pseudo-steady state period. Confined species further transform into phenathrene and pyrene at the near-surface region of SAPO-34 crystals which in turn lead to the deactivation of catalyst.Synergy between SAPO-34 cage and confined species affect the product selectivity. Empty cages are likely to form relative large-size molecules, such as C4 and C5+ products. Confined species reduce the cage volume for products and reactant. Cages occupied by large size methylnaphthalenes tend to form more ethene, less propene and even less C4+ than those occupied by small size methylbenzenes. Confined species in cages also hinder the secondary reaction of olefins. Consequently, ethene selectivity and C2/C3 tend to increase with long TOS.
Acknowledgements
This work is financially supported by Heilongjiang Postdoctoral Foundation (LBH-TZ0419), Heilongjiang Youth Science Foundation (QC2015013), and NEPU Youth Science Foundation (NEPUQN2014-15). The authors acknowledge the support of Analysis and Test Center of Northeast Petroleum University for SEM, TG/DTA and GC-MS analysis.References
- M. Stöcker, Microporous Mesoporous Mater., 1999, 29, 3–48 CrossRef.
- M. Stöcker, in Zeolites and Catalysis: Synthesis, Reactions and Applications, 2010, vol. 2, pp. 687–711 Search PubMed.
- A. Galadima and O. Muraza, Ind. Eng. Chem. Res., 2015, 54, 4891–4905 CrossRef CAS.
- P. Tian, Y. Wei, M. Ye and Z. Liu, ACS Catal., 2015, 5, 1922–1938 CrossRef CAS.
- Y. X. Wei, D. Z. Zhang, F. X. Chang, Q. H. Xia, B. L. Su and Z. M. Liu, Chem. Commun., 2009, 5999–6001 RSC.
- W. Song, J. F. Haw, J. B. Nicholas and C. S. Heneghan, J. Am. Chem. Soc., 2000, 122, 10726–10727 CrossRef CAS.
- W. Dai, C. Wang, M. Dyballa, G. Wu, N. Guan, L. Li, Z. Xie and M. Hunger, ACS Catal., 2015, 5, 317–326 CrossRef CAS.
- Q. Qian, C. Vogt, M. Mokhtar, A. M. Asiri, S. A. Al-Thabaiti, S. N. Basahel, J. Ruiz-Martínez and B. M. Weckhuysen, ChemCatChem, 2014, 6, 3396–3408 CrossRef CAS.
- I. M. Dahl and S. Kolboe, Catal. Lett., 1993, 20, 329–336 CrossRef CAS.
- I. M. Dahl and S. Kolboe, J. Catal., 1994, 149, 458–464 CrossRef CAS.
- D. Chen, H. P. Rebo, A. Grønvold, K. Moljord and A. Holmen, Microporous Mesoporous Mater., 2000, 35–36, 121–135 CrossRef CAS.
- E. Epelde, M. Ibanez, A. T. Aguayo, A. G. Gayubo, J. Bilbao and P. Castano, Microporous Mesoporous Mater., 2014, 195, 284–293 CrossRef CAS.
- Y. X. Wei, C. Y. Yuan, J. Z. Li, S. T. Xu, Y. Zhou, J. R. Chen, Q. Y. Wang, L. Xu, Y. Qi, Q. Zhang and Z. M. Liu, ChemSusChem, 2012, 5, 906–912 CrossRef CAS PubMed.
- W. Song, H. Fu and J. F. Haw, J. Am. Chem. Soc., 2001, 123, 4749–4754 CrossRef CAS PubMed.
- B. Arstad, J. B. Nicholas and J. F. Haw, J. Am. Chem. Soc., 2004, 126, 2991–3001 CrossRef CAS PubMed.
- B. Arstad and S. Kolboe, Catal. Lett., 2001, 71, 209–212 CrossRef CAS.
- B. Arstad and S. Kolboe, J. Am. Chem. Soc., 2001, 123, 8137–8138 CrossRef CAS PubMed.
- U. Olsbye, M. Bjorgen, S. Svelle, K. P. Lillerud and S. Kolboe, Catal. Today, 2005, 106, 108–111 CrossRef CAS.
- M. Guisnet, J. Mol. Catal. A: Chem., 2002, 182–183, 367–382 CrossRef CAS.
- J. F. Haw, W. G. Song, D. M. Marcus and J. B. Nicholas, Acc. Chem. Res., 2003, 36, 317–326 CrossRef CAS PubMed.
- J. Haw and D. Marcus, Top. Catal., 2005, 34, 41–48 CrossRef CAS.
- G. Qi, Z. Xie, W. Yang, S. Zhong, H. Liu, C. Zhang and Q. Chen, Fuel Process. Technol., 2007, 88, 437–441 CrossRef CAS.
- Q. Qian, J. Ruiz-Martinez, M. Mokhtar, A. M. Asiri, S. A. Al-Thabaiti, S. N. Basahel, H. E. van der Bij, J. Kornatowski and B. M. Weckhuysen, Chem.–Eur. J., 2013, 19, 11204–11215 CrossRef CAS PubMed.
- W. Dai, G. Wu, L. Li, N. Guan and M. Hunger, ACS Catal., 2013, 3, 588–596 CrossRef CAS.
- H. Fu, W. Song and J. F. Haw, Catal. Lett., 2001, 76, 89–94 CrossRef CAS.
- B. P. C. Hereijgers, F. Bleken, M. H. Nilsen, S. Svelle, K. P. Lillerud, M. Bjørgen, B. M. Weckhuysen and U. Olsbye, J. Catal., 2009, 264, 77–87 CrossRef CAS.
- W. Song, H. Fu and J. F. Haw, J. Phys. Chem. B, 2001, 105, 12839–12843 CrossRef CAS.
- D. Chen, A. Grønvold, K. Moljord and A. Holmen, Ind. Eng. Chem. Res., 2007, 46, 4116–4123 CrossRef CAS.
- I. M. Dahl, H. Mostad, D. Akporiaye and R. Wendelbo, Microporous Mesoporous Mater., 1999, 29, 185–190 CrossRef CAS.
- Z. Li, J. Martinez-Triguero, P. Concepcion, J. Yu and A. Corma, Phys. Chem. Chem. Phys., 2013, 15, 14670–14680 RSC.
- D. Chen, K. Moljord, T. Fuglerud and A. Holmen, Microporous Mesoporous Mater., 1999, 29, 191–203 CrossRef CAS.
- D. Chen, K. Moljord and A. Holmen, Microporous Mesoporous Mater., 2012, 164, 239–250 CrossRef CAS.
- D. Chen, H. P. Rebo and A. Holmen, Chem. Eng. Sci., 1999, 54, 3465–3473 CrossRef CAS.
- S. J. Jong, A. R. Pradhan, J. F. Wu, T. C. Tsai and S. B. Liu, J. Catal., 1998, 174, 210–218 CrossRef CAS.
- F. Bauer, E. Geidel, W. Geyer and C. Peuker, Microporous Mesoporous Mater., 1999, 29, 109–115 CrossRef CAS.
- A. T. Aguayo, A. G. Gayubo, J. Erena, A. Atutxa and J. Bilbao, Ind. Eng. Chem. Res., 2003, 42, 3914–3921 CrossRef CAS.
- S.-G. Lee, Y.-H. Kim, E.-J. Kang and C.-S. Park, J. Ind. Eng. Chem., 2014, 20, 61–67 CrossRef CAS.
- T. Álvaro-Muñoz, E. Sastre and C. Márquez-Álvarez, Catal. Sci. Technol., 2014, 4, 4330–4339 Search PubMed.
- S. X. Tian, S. F. Ji, D. D. Lu, B. Y. Bai and Q. Sun, J. Energy Chem., 2013, 22, 605–609 CrossRef CAS.
- Y. X. Wei, D. Z. Zhang, F. X. Chang and Z. M. Liu, Catal. Commun., 2007, 8, 2248–2252 CrossRef CAS.
- G. J. Hutchings, G. W. Watson and D. J. Willock, Microporous Mesoporous Mater., 1999, 29, 67–77 CrossRef CAS.
- J. Li, Z. Wei, Y. Chen, B. Jing, Y. He, M. Dong, H. Jiao, X. Li, Z. Qin, J. Wang and W. Fan, J. Catal., 2014, 317, 277–283 CrossRef CAS.
- W. Wang, Y. Jiang and M. Hunger, Catal. Today, 2006, 113, 102–114 CrossRef CAS.
- S. Ilias and A. Bhan, ACS Catal., 2013, 3, 18–31 CrossRef CAS.
- H. Q. Zhou, Y. Wang, F. Wei, D. Z. Wang and Z. W. Wang, Appl. Catal., A, 2008, 348, 135–141 CrossRef CAS.
- D. Mores, E. Stavitski, M. H. Kox, J. Kornatowski, U. Olsbye and B. M. Weckhuysen, Chem.–Eur. J., 2008, 14, 11320–11327 CrossRef CAS PubMed.
- Y. Iwase, K. Motokura, T. Koyama, A. Miyaji and T. Baba, Phys. Chem. Chem. Phys., 2009, 11, 9268–9277 RSC.
- K. Y. Lee, H. J. Chae, S. Y. Jeong and G. Seo, Appl. Catal., A, 2009, 369, 60–66 CrossRef CAS.
Footnote |
| † Electronic supplementary information (ESI) available. See DOI: 10.1039/c5ra22424a |
| This journal is © The Royal Society of Chemistry 2016 |