Structural and conformational properties of polybenzimidazoles in melt and phosphoric acid solution: a polyelectrolyte membrane for fuel cells†
Swagata Pahari* and
Sudip Roy*
National Chemical Laboratory, Pune, India. E-mail: s.pahari@ncl.res.in; s.roy@ncl.res.in; Fax: +91 20 2590 2615; Tel: +91 20 2590 3148
First published on 21st December 2015
Abstract
Poly[2,2′-(p-phenylene)-5,5′-bibenzimidazole (PBI) and poly(2,5-benzimidazole) (ABPBI) doped with phosphoric acid (PA) are considered as potential polymer electrolyte membranes for high temperature fuel cells. Conformational and structural properties of polymer chains in the presence of PA govern the function of the membrane. Therefore, in this work, a single chain conformational analysis of ABPBI and PBI in melt as well as in PA was performed using classical molecular dynamics simulations. End-to-end distance and the radius of gyration reveal significant changes in the conformations of PBI and ABPBI in PA. The structural changes are analyzed locally segment-wise as well as globally in these polymers. The shape and nature of the curvature along the chain is found to be significantly different for ABPBI and PBI. The role of the solvent (PA) on the chain backbone structure is explored for PA doped ABPBI and PBI chains. The PA arrangement along the backbone confirms that benzimidazole density in the case of both of the polymers determines the PA absorbing capacity. The H-bonding interactions between various atoms of the polymer backbone and the atoms of the PA molecules are evaluated along the polymer chain which relates to the arrangement of PA along the backbone. The reasons for the varying number of H-bonds along ABPBI and PBI which in turn has a significant effect on the stiffness of the chains are investigated.
1 Introduction
Polymer electrolyte membrane fuel cells (PEMFCs) are potential power sources for transportation, stationary applications and portable electronics.1,2 PEMFC technology has already provided a good performance which is competitive with the alternative available technologies in some of these applications.3–5 One of the challenging tasks to commercialize a PEMFC as an alternative power source is the development of a membrane with efficient performance at higher temperatures (above 100 °C) and under low external humidification.6 High temperature membranes have several advantages: (i) high tolerance to fuel impurities,7 (ii) an increase of the reaction rate at the cathode,3 (iii) additional pressure is not required,2 and (iv) the performance of the fuel cell becomes independent of humidity.4 Among the high temperature polyelectrolyte membranes studied so far, polybenzimidazole based polymers are promising membrane materials.8 The key to proton transport in these materials is their impregnation with phosphoric acid (PA).9–12 Poly[2,2′-(p-phenylene)-5,5′-bibenzimidazole (polybenzimidazole, PBI) and poly(2,5-benzimidazole) (ABPBI) solvated with PA are the most efficient membrane materials investigated so far.13–15 These polyelectrolyte materials are less expensive compared to Nafion, no humidification is required for PEMFC application and working temperatures are also high (up to 200 °C). Wainright et al.16 first showed that PA doped PBI can be used as a replacement for Nafion membranes at higher temperatures in PEMFCs with various fuels.8,17,18 Similarly, ABPBI with certain concentrations of PA also performs as an efficient membrane19–22 for PEMFCs. Litt et al. first cast a PA impregnated ABPBI membrane from an EtOH/NaOH solution and they found that ABPBI absorbed more PA than the previously known PBI.9 The lack of a phenylene ring in the backbone of ABPBI may give rise to a better affinity towards PA compared to PBI. However, ABPBI is the simplest of all the benzimidazole types of polymers as it is prepared from a simple, comparatively inexpensive, commercially available monomer.21–23 Besides that, doping of ABPBI with a given amount of PA leads to more acid uptake compared to PBI.20,23 Since the acid provides hydrogen ion mobility, conductivity increases as the percentage of acid increases. Another key feature of ABPBI molecules is their high thermal stability. Concerning the mechanical properties of these membranes, Wainright et al. reported that the mechanical strength of comparably doped PBI and ABPBI films are almost same. But the synthesis of higher molecular weight ABPBI is achievable, which yields higher elongation and toughness.20 Litt et al.9 found that within the high viscosity range, ABPBI film is much tougher and more elongated than the PA doped PBI film. Despite these advantages of ABPBI over PBI, ABPBI has not been considered widely because of its poor solubility in common solvents, which are generally used in the membrane casting method.23 Another important disadvantage of ABPBI is that in the case of ABPBI, with the increase in PA content the loss of mechanical strength is more than it is in PBI as it gets dissolved more readily in PA due to its higher basicity.Savinell and coworkers24 observed that the PBI membrane with a higher doping level (27.7 mol RU−1) exhibits a proton conductivity of 0.24 S cm−1 at 160 °C whereas an ABPBI membrane with an acid doping level of only 2.5 mol RU−1 shows a proton conductivity of 0.14 S cm−1 at 180 °C.25 Asensio and coworkers20 reported that PA doped ABPBI exhibits a better proton conductivity than PBI because of the presence of a higher imidazolium concentration per unit volume of ABPBI, resulting in an increased capability of dissolving in acid.
Not many computational studies on properties and proton conductance mechanism have been performed on polybenzimidazole (PBI and ABPBI) membranes.26–30 This is primarily because of their complexity and the higher length and time scale of the system. Li et al.26,27 explored the nature of hydrogen bonding interactions and the energy barriers for different proton transport pathways within PA-doped polybenzimidazole. The authors reported the proton affinities of benzimidazole, PA, water and their corresponding ions and categorized them based on their ability to associate protons. They also found that at a lower doping level of PA, there is the formation of strong hydrogen bonds between PA and the polymer chain. The activation energy barriers for various proton transport pathways suggest that the excess proton moves to benzimidazole after the initial optimization. They also performed classical molecular dynamics (MD) simulations on neat, hydrated and phosphoric acid solvated PBI and ABPBI and investigated a number of different types of H-bonds to characterize the complex H-bonding network for both of the polymers. Authors confirmed the less hydrophilic character of PBI, therefore it has lower affinity towards PA compared to ABPBI. The effect of the PA doping level and temperature in H-bonding for both the PBI and ABPBI systems were also reported in their paper. Zhu et al. discussed the H-bonding network within neat PBI and PA solvated PBI by investigating radial distribution function (RDF) plots between different proton donor and acceptor sites.29 They found that among the pristine PBIs, p-PBI is more ordered and stretched than the m-PBI. In our earlier report,31,32 we had studied the PA solvated monomer (BI) of the PBI system. We had discussed the structural arrangement of BI, the probability of stacking and the effect of the amount of PA on this arrangement. We had also revealed the probabilities of different types of H-bonding between BI and PA which is responsible for the structural heterogeneity, and a correlation between structural and dynamical heterogeneity in the PA doped BI system had been established.33
To date, the comparative single chain structural properties of PBI and ABPBI in PA are unexplored. The computation of single chain conformational behavior will serve as the first step to understand the physical properties of the polymers in PA as a solvent, which are of direct interest. The microstructure of a single chain of polymer tells us about the physical arrangement of the monomer units along the backbone which in turn results in the macroscopic properties of the polymer such as durability, mechanical strength, and solvent up-take capacities. In this work, we have performed classical MD simulations of PBI and ABPBI single chains solvated in PA as well as melt systems of both the polymers. We have investigated the structural properties of the single polymer chain in melts and the effect of solvent on the chain conformations. The objective of this work is to provide correlations and differences between the structural and conformational complexities of PBI and ABPBI in PA (and in melt) and its effect on their properties as fuel cell membranes. The end-to-end distance and radius of gyration of ABPBI and PBI single chains, which gives us a direct indication about the conformational behavior of the polymer chain, are calculated and analyzed. We studied how the conformational changes are reflected in their solvent uptake capacities. The arrangements of the solvent along the backbone of the ABPBI and PBI chain have been compared and how it affects the rigidity of the chain was explored. The difference in the hydrogen bonding arrangement along the ABPBI and PBI chains and its correlation with the proton conductivity has been studied.
2 Computational details
We have performed classical MD simulations on PBI and ABPBI polymer melts as well as PA solvated PBI and ABPBI single chains, separately, using an all-atomistic force field. The chemical structures of the monomers of PBI and ABPBI are shown in Fig. 1. We have constructed PBI chains consisting of 8 monomer units and ABPBI chains consisting of 24 monomer units to keep the initial chain length of both of the polymers about the same. All the simulations were performed with a GROMACS 4.0.7 package.34,35 The simulation cells of the melt of PBI and ABPBI were constructed separately by adding 80 polymer chains to each. Single chains of PBI (8 repeating units) and ABPBI (24 repeating units) were solvated with PA. These two solvated systems represent an extremely dilute polymer solution. The concentration of the solution is ∼0.05 g cm−3. The total potential energy used to calculate forces among the atoms was the sum of all the bonded and non-bonded interactions. The bonded interaction energy consists of the harmonic bond, angle potential, and proper and improper dihedral potential. The non-bonded interaction energy consists of Lennard-Jones (LJ) potential and electrostatic interaction. All these potential energy forms are used as implemented in the GROMACS 4.0.7 package.34,35 The parameters for the bond and angle potentials for PBI and ABPBI were adapted from the OPLS-AA force field.36,37 The parameters for dihedral potential for PBI and ABPBI were calculated from quantum chemical calculations. We optimized PBI and ABPBI made of three monomers using the B3LYP functional with 6-311g(d,p) basis set by using the Gaussian 09 program.38 With these optimized structures, dihedral scan optimization was performed with an increment of 18° (each dihedral angle separately) in each step. At each step the geometry of the molecule was optimized and the energy value was calculated as a function of the dihedral angle, and fitted by the dihedral potential function of the form:
 | (1) |
All the simulations were carried out in an NPT ensemble with periodic boundary conditions in all directions. The temperature was maintained using a Berendsen thermostat41 with a coupling constant of 0.1 ps and a Berendsen barostat for isotropic pressure control with a coupling constant of 1 ps was used to keep the pressure constant at 1 bar. Reaction field electrostatics42,43 were used with a cut-off length of 1.2 nm for the pure melt systems. In the case of PBI and ABPBI in PA as a solvent, the particle mesh Ewald (PME) method was used for electrostatic interaction. For the PBI and ABPBI melt systems, 1 μs production runs were performed at a wide range of temperatures starting from 500 K up to 1000 K. Simulated annealing (SA) for better sampling of the phase space on the energy-optimized structure was performed on the single chains of PBI and ABPBI. These well-equilibrated single chains were replicated to prepare a bulk system containing 80 chains in each simulation cell. These bulk systems were gradually heated from 500 K to 1000 K, by 50 K in each step, and an NPT simulation of 500 ps was performed at each step. Similarly, the systems were cooled in six steps from 1000 K to 500 K. This SA cycle of heating and cooling was repeated at least six times until the potential energy converged with respect to the previous cycle. From the last SA steps, we grabbed frames at different temperatures and subjected them to NPT simulations for 800 ns at these temperatures to obtain the glass transition temperature. The melt systems were simulated at 750 K (above the glass transition temperature) while the single chains in PA were simulated at 450 K for 1 μs. For all the systems, trajectories were recorded every 2 ps and the last 10 ns of the production run were analyzed.
3 Force field validation
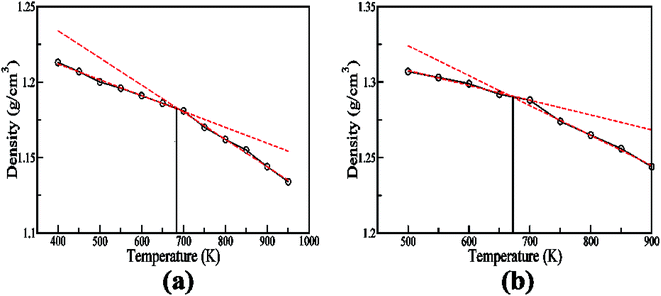
The validations of the force field for both of the polymers were done by comparing the density and glass transition temperature with the experiment. The calculated density of the bulk PBI at 300 K and 1 atm pressure from the simulation is 1.23 ± 0.02 g cm−3 where the experimental density of PBI varies from 1.2–1.34 g cm−3 depending on whether it is an untreated PBI fiber or an annealed or plasticized PBI fiber.44,45 Therefore, the density of the simulated PBI agrees well with the experimental density. For ABPBI, the calculated density from the simulation is 1.32 ± 0.03 g cm−3 at 300 K whereas the reported experimental density is 1.4 g cm−3.46 Hence, the densities of both of the polymers (PBI and ABPBI) are well in agreement with the experimental data. For computing the glass transition temperature, we have calculated densities at different temperatures ranging from 500 K to 1000 K and plotted for PBI and ABPBI as a function of temperature in Fig. 2. In the case of PBI, there is a change of slope in density as a function of temperature plot below 680 K (Fig. 2a) which indicates that ∼680 K is the glass transition temperature for PBI. The glass transition temperature for PBI is reported as 690–700 K.13 For ABPBI, we obtained the glass transition temperature of 670 K (Fig. 2b) while the experimental value is >673 K.47 Thus the comparable values of density and glass transition temperature validate the force field for ABPBI and PBI.4 Results and discussion
4.1 Structural properties of the polymer
The physical properties of a polymer depends on the structural properties and conformation of a single polymer chain to a large extent. The physical arrangement of the monomers along the backbone of a polymer chain reveals the microstructure of the system. For example, we can have two polymers of the same composition but different durability due to different structural arrangement of the polymer chains.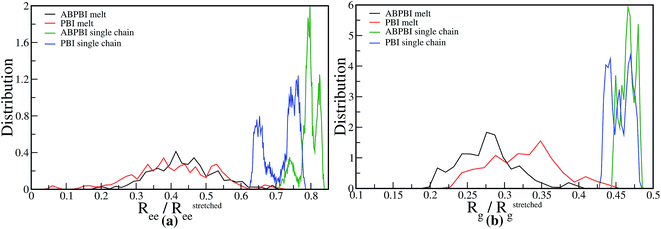 | ||
| Fig. 3 Distribution of (a) fractional end-to-end distance and (b) fractional radius of gyration for PBI and ABPBI in melt as well as in PA solvated systems. | ||
Since PBI and ABPBI are membrane candidates for PEMFC in the presence of PA, it is important to understand the conformation of a single polymer chain in PA as a solvent. The conformation of a single polymer chain in solvent reflects the physical properties of the system e.g. miscibility and the solvent uptake capacity of the polymer. This is related to the efficiency of these polymers as a membrane material for high temperature fuel cells. To evaluate the quality (good or bad) of the solvent (PA) for ABPBI and PBI, we have investigated how the polymer conformation changes on moving from a melt system to a PA solvated system. We observe in Fig. 3(a) and (b) that both ABPBI and PBI chains become elongated in the presence of PA compared to their corresponding melt systems, which indicates the complete conformational change of these polymers in the presence of PA. Since both of the polymer chains become stretched in PA compared to the melt system, we can say that PA is a good solvent for both of the polymers (ABPBI and PBI). It is evident from Fig. 3(a) and (b) that the ABPBI chain becomes more elongated compared to the PBI chain in the presence of PA which is in agreement with the experimental results.9 The fractional Ree of the ABPBI chains varies from 0.71 to 0.84 where 0.79 is the most probable fractional Ree [Fig. 3(a)]. Apart from 0.79, there is another significant peak at 0.82 in the fractional Ree distribution plot which reflects that at some instants the chain becomes more elongated. There is also a relatively small peak at a lower distance (0.74). In the case of PBI, two distinct peaks are observed in Fig. 3(a): one at a lower distance (∼0.65) and other at a higher distance (∼0.75), which reveals two distinct conformations of PA solvated PBI chains. Similarly, from the distribution of fractional Rg in Fig. 3(b), we can see that the Rg of ABPBI varies from 0.44 to 0.48 and for PBI from 0.42 to 0.48. Distribution of Rg also indicates that ABPBI and PBI chains prefer to stay in extended conformations. However, the conformations guiding the extended structure of these two polymers are different, which can be attributed to different curvatures of the extended polymer chains. Therefore, ABPBI and PBI having the same major constituent (benzimidazole), solvated with the same solvent (PA) show different conformations which can be an indicator of their different physical properties like capability of dissolving acids, toughness or rigidity of the chain etc.
4.1.2.1 Local arrangement.
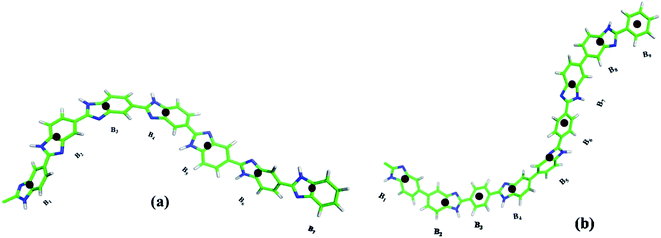
4.1.2.1.1 Bond distance distribution. The structural properties of melt and PA solvated systems of ABPBI and PBI suggest that polymer chains have different conformations. Thus, for a detailed understanding of the nature and shape of these polymer chains in melt and in PA solvent, we have investigated the local arrangement of polymer chain segments for both the ABPBI and PBI. To understand whether the polymer chains are coiled or fully stretched, we have calculated the distance between every ith COM particle and the (i + 1)th, (i + 2)th, …, and (i + 9)th and their distributions are plotted in Fig. 5, where i is the COM particle number. The COM particles along the polymer chain are represented as B1, B2, B3, …, Bn respectively [see Fig. 4(a) and (b)]. We refer to these distributions as the COM particles bond distance distribution in the rest of our paper. For ABPBI and PBI melt systems, we plotted the COM particles bond distance distribution averaged over a number of chains in Fig. 5(a) and (b) respectively. We have here considered up to the 10th bead from both ends of the chain for the clarity of visualization. If the polymer chain is completely extended, then the bond distance between Bi and Bi+2 would be twice that of Bi and Bi+1; Bi and Bi+3 would be thrice that of Bi and Bi+1 and so on. In the distance distribution plot [Fig. 5(a)] for the ABPBI melt system, we can see that the bond distance of Bi–Bi+2 (1.0 nm) is almost twice of Bi–Bi+1 (0.5 nm) but Bi and Bi+3 has a slightly smaller bond distance than thrice that of Bi–Bi+1. Bi–Bi+4 also has a smaller distance than four times Bi–Bi+1. These decreases in distances are much more prominent for longer bonds (starting from Bi–Bi+5 bonds). For longer bonds, bond lengths are fluctuating over a wide range of distances (from 0.9 nm to 4.6 nm), which indicates that different polymer chain form coils of different lengths which represent different structural conformations. In the case of PBI (Fig. 5(b)), Bi–Bi+1, Bi–Bi+2, Bi–Bi+3 has peaks at 0.5, 1.0 and 1.5, respectively. It seems that these sets of COM beads are stretched. Bi–Bi+4 has a maximum probable peak at ∼2.0 nm, while Bi–Bi+5 has a high probable region from 2.3 to 2.5 nm. This indicates that these sets of beads are also almost stretched. The distribution of bonds is sharper for the PBI melt system compared to ABPBI, which indicates that PBI chains are more stretched and less dynamic compared to ABPBI in the melt system. This observation matches well with the fractional Ree and Rg distribution (see Fig. 3(a) and (b)), which shows that ABPBI chains are more coiled. In the case of PA solvated ABPBI and PBI single chains, we can observe discrete peaks at varying distances in the COM bond distance distribution (Fig. 5(c) and (d)) plots. There are overlaps between the peaks to some extent, which indicate the curved nature of the polymer chains. Now if we compare the distance distributions of PA solvated ABPBI and PBI chains (Fig. 5(c) and (d)) with that of the melt systems, we can notice that the extent of the overlaps are more for the melt system. Therefore, it is clear that both the ABPBI and PBI chains become stretched in the presence of PA compared to the melt system. Fig. 5(c) and (d) also shows that the overlap in the bond distances is more for PA solvated PBI with respect to the PA solvated ABPBI chain. In the case of ABPBI chain, the bond distance of one COM particle overlaps only with the next neighboring COM particle whereas for PBI it can overlap with the bond distance of next five COM particles. Therefore, we can expect less curvature in the case of PA solvated ABPBI chain compared to PBI chains which means that the PA solvated ABPBI chain is more elongated than that of PBI.
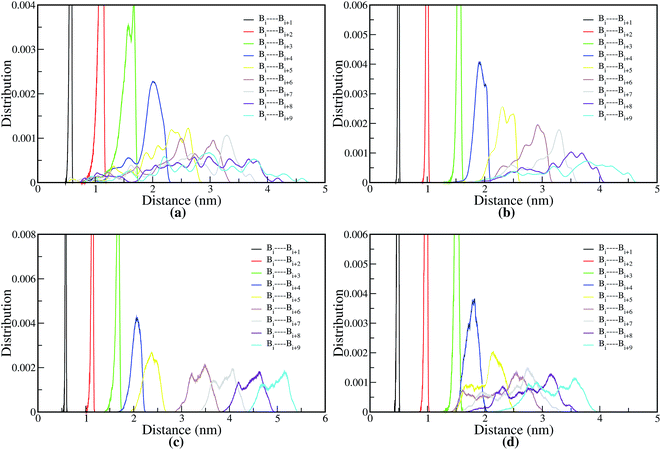 | ||
| Fig. 5 Bond distance distribution of COM particles for (a) ABPBI in melt, (b) PBI in melt, (c) PA solvated ABPBI and (d) PA solvated PBI chain. | ||
4.1.2.1.2 Angle distribution. To evaluate the shape of the curvature forming along the chain, we have calculated the angles between the COM particles which give us a more direct estimation of curvature. We have computed the angle between Bi, Bi+1, Bi+2; Bi+1, Bi+2, Bi+3; Bi+2, Bi+3, Bi+4 and so on (numbering is according to Fig. 4(a) and (b)) and the distribution is shown in Fig. 6 for both ABPBI and PBI in melt as well as in PA solvated systems. The larger the angle, the lesser the curvature will be and the smaller value of angle represents a sharp curvature, which in turn forms a coiled chain. We notice that in the melt systems, for both the ABPBI and PBI chains, a sharp peak is observed at 150° but apart from that a peak at 170° is also observed in the case of PBI. The two peaks in the angle distribution plot indicate two distinct conformations of PBI, which is in agreement with Rg (Fig. 3(b)). We can see in Fig. 6 that the angle between the COM particles varies from 105° to 180° for PBI whereas for ABPBI the angle varies from 75° (a much lower value) to 175°. The presence of smaller angles reflects the fact that the ABPBI chain has a sharp curvature compared to the PBI chain in the melt system. This result matches with the Rg (Fig. 3(b)) and COM particle bond distance distribution results (Fig. 5(a) and (b)). The comparative local microscopic arrangement of single polymer chains in melt with the solvated system shows (Fig. 6) that the angle distribution peak for ABPBI single chain in the PA solvated system is shifted to a slightly higher angle value compared to the melt system, which indicates that the ABPBI chain becomes extended in the presence of PA. Another interesting thing to observe is that in the case of melt, the angle varies over a wide range (80° to 175°) whereas for the PA solvated system the angle varies only from 120° to 175°. This reveals the fact that the ABPBI chain in the presence of PA as a solvent becomes less flexible compared to the melt system. The rigidity of the PA solvated ABPBI chain, which acts as a membrane material in fuel cells, contributes to the mechanical strength of the membrane, which in turn determines the efficiency of the fuel cell. For PBI, in the case of both melt and PA solvated systems, two distinct peaks are observed in the COM particle angle distribution plot (Fig. 6). Hence, there is no sign of conformational change as we go from melt to solvated system from this COM particle angle distribution plot. Thus PA has more effect on the conformation of the ABPBI chain compared to PBI. This observation is also supported experimentally by Litt et al.9
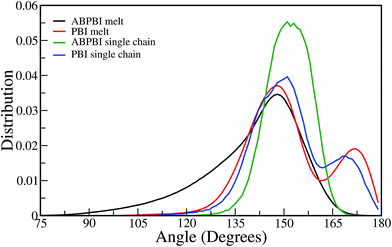 | ||
| Fig. 6 COM particles angle distribution for both PBI and ABPBI in melt as well as in PA solvated system. | ||
4.1.2.1.3 Curvature along the chain. To draw a clear picture of the shape of the curvature along the polymer chain, we have plotted the time average angle distribution of COM particles as a function of the angle number in Fig. 7. The angles were computed along the chain: ∠B1B2B3 were designated as 1, ∠B2B3B4 as 2, ∠B3B4B5 as 3, …, and ∠B22B23B24 as 22 (in Fig. 7 X-axis). These angles were computed for every chain in the melt systems. We have averaged over all such angles in the last 10 ns of the trajectory and present this in Fig. 7. There are 24 COM particles in both ABPBI and PBI chains; hence there are 22 angles along the chain. In Fig. 7, we notice a monotonic angle distribution curve for the ABPBI chains in the melt system. The average angle gradually decreases towards the center of the polymer chain and again increases, although the deviation is small (from 130° to 145°). Therefore, ABPBI chains in melt have a broad curvature in a long range i.e., a single broad semi-circular loop type of structure is formed along the ABPBI chains. On the contrary, in the case of the PBI melt system the angle distribution is periodic. This shows us that several small curvatures are formed along the chain, the curvatures are wavy in nature and the direction of the curvature is changing periodically. Since the angles vary only between 140° and 170°, the curvatures are not sharp. Therefore, the nature of the curvature is different in the PBI and ABPBI chains in the melt system. For PA solvated ABPBI (Fig. 7), several curvatures, oriented periodically in alternate directions were observed. The angle varies from 145° to 157°, which indicates that the curvature is very broad. Due to this wavy nature, the ABPBI chain in PA becomes elongated relative to the melt system. But the PBI chain in PA as well as in the melt system shows the same nature of the curvature [see Fig. 7]. The only difference is in the values of the angles. The angles near the centre of the chain are significantly lower in the case of the melt system of PBI, since the higher the angle, the less the sharpness of the curvature becomes which in turn elongates the polymer chain. This provides us with the evidence that the PBI chain gets elongated in PA compared to the melt system.
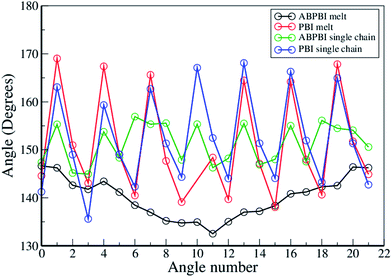 | ||
| Fig. 7 COM particles angle distribution as a function of angle number i.e. along the chain for both PBI and ABPBI. | ||
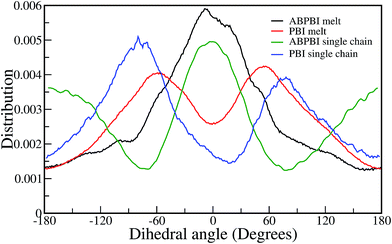
4.1.2.1.4 Dihedral angle distribution. The dihedral angle represents the angle between two planes and can give us the root cause of different curvatures in different systems. Therefore, the dihedral angle between four given COM particles along the polymer chain gives an idea about the local curvature along the chain. If the dihedral angle between four COM particles is 0°, the distance between the end COMs is the minimum and for 180°, the distance is the maximum. Hence, we have calculated every possible dihedral angle along each single chain for the ABPBI and PBI melts as well as for the PA solvated single chain systems. We have plotted the distribution of these calculated dihedral angles and compared them for each of the systems in Fig. 8. In the case of the melt system, there is a significant difference between ABPBI and PBI in the dihedral distribution plot (Fig. 8). For the ABPBI melt, a peak is observed at 0° whereas a peak minimum is observed at this angle for the PBI melt system. Two peaks of equal probability at +60° and −60° are observed for the PBI melt, which is absent in the ABPBI system. But at 180° and −180°, both the polymer melts show the same dihedral distribution minima. Since the peak at 0° represents the lowest distance, the distance between the terminal COM particles among the four COM particles (within which the dihedral angle is calculated) becomes less for ABPBI (i.e., the distance between the second next neighbor COM particles). The peak at only 0° for ABPBI is also indicative of similarities in the local curvature. But the difference in the overall end to end distance between ABPBI and PBI in melt systems is not much because of the presence of peaks at +60° and −60° for PBI systems. The two equally probable peaks for the PBI chain at +60° and −60° indicates that the nature of the curvatures are same for PBI but the directions are different which reveals the wavy curvature of the PBI chain. The result is well in agreement with the nature of the curvature analysis observed in Fig. 7.
For PA solvated ABPBI, apart from the peak at 0°, two peaks are observed at +180° and −180° (see Fig. 8). The presence of peaks at 180° specifies higher distances between the COM particles along the ABPBI chain in the presence of PA. Therefore, the ABPBI chain gets elongated in PA. In the case of solvated PBI, the dihedral distribution plot is almost the same as the PBI melt. In both of the cases two equally probable peaks are observed, and the only difference is that in the case of the PA solvated single chain, the dihedral angles shifted towards a higher value. This result indicates larger distances between next neighbor COM particles. Therefore the PA solvated PBI chain is relatively longer than the polymer chains in melt.
4.1.2.2 Global arrangement. From the analysis of the local arrangement, we concluded that the curvature along the PBI and ABPBI chains are different in the melt and PA solvent. Also, the shapes of the curvatures are different in the PA solvated PBI and ABPBI. To get a clear picture of the structure–property relationship, we have made a connection of these local variations in curvatures to the global structure of the polymer chains.
To evaluate the global arrangement of the chain segments along the polymer chain, we have calculated the angle between all of the COM particle bond vectors with respect to the first COM particle bond vector. According to Fig. 4(a) and (b), the angles were calculated between vectors  and so on. We have computed the time average of these angles and plotted them in Fig. 9 for melts as well as the solvated chains of ABPBI and PBI. The angle between the first and second vectors is represented as 1, between the first and third vectors as 2 and so on in Fig. 9 (X-axis). In the melt, initially we observe that the angle decreases for ABPBI up to the 4th angle and for PBI up to the 7th angle and beyond that the angle remains almost constant. Therefore both PBI and ABPBI chains in melt have broad curvatures over a large region and a small sharp curvature locally.
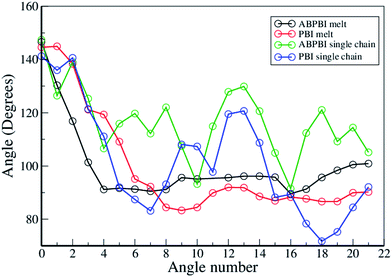 | ||
| Fig. 9 Distribution of angles between COM particles with respect to the first bond vector for PBI and ABPBI in both melt and PA solvated systems. | ||
Single chains of ABPBI and PBI in solvent are different from the corresponding melt systems. From Fig. 9, it is evident that ABPBI does not have a global (long range) curvature but it is more wavy (local curvatures) than PBI in solvent. However, PBI shows some global curvature (similar to bulk) in PA. This clarifies why the ABPBI chain is more extended compared to PBI in the presence of PA, which is well in agreement with the end-to-end-distance (Fig. 3(a)), Rg (Fig. 3(b)), and bond distance distribution (Fig. 5(c) and (d)) data.
4.1.3.1 Arrangement of PA molecule along the chain. The conformations of the ABPBI and PBI chains in the presence of PA are different though the polymers belong to the same benzimidazole family. The only chemical difference between ABPBI and PBI is the presence of phenylene rings in the backbone of PBI. The reason behind the different conformations of ABPBI and PBI may also be because of the interaction between the polymer backbone and solvent. Therefore, we have explored the interaction between the PA molecules and polymer backbones. To understand the structural arrangement of the PA molecules around the polymer chain, we have considered the COM of each PA molecule and plotted the RDF between these PA COMs and COM particles along the polymer chain as described in Fig. 4. We have computed the RDF between the COM of the benzene moiety for PBI, and the benzimidazole moiety for PBI and ABPBI chains and PA separately and plotted them in Fig. 10. We observe that the RDF plots almost overlap with each other and that the first solvation minima are also in the same position for the three RDFs. The PA solvation shells surrounding benzimidazole for both ABPBI and PBI are the same. But to our surprise it is also the same around the benzene moiety where there is no basic site in the phenylene ring with which PA can interact. To evaluate how many PA molecules are in the first solvation cell, we have calculated the coordination number for each RDF plot. The number of molecules in the first solvation shells are also the same in all of the three cases. However, from the visual examination of the trajectory, we found that there are some PA molecules, which are shared by two or three consecutive COM particles of the polymers. This means that the first solvation shells of consecutive COM particles overlap. In PBI, the benzene ring is in between two benzimidazole rings and it shares the solvation shell of two benzimidazole moieties. This might be the reason why we have the same number of PA molecules in the first solvation shell of benzene and benzimidazole. From Fig. 10, it is evident that the first solvation shell of benzimidazole/benzene is quite large (0.75 nm). At this large distance, the probability that the neighboring benzimidazole/benzene moieties are sharing the PA molecules becomes high. This is obvious as there is no direct interaction between the basic site of the polymer and the acidic site of PA, only the cooperative arrangement of PA molecules at such a larger distance. To explore this fact, we have counted the number of PA molecules within the first solvation shell as a function of the distance from the benzimidazole of ABPBI, the benzimidazole of PBI and the benzene of PBI separately and plot this in Fig. 11 (averaged over all the benzimidazole/benzene rings). Fig. 11 depicts that at lower distances the difference between the three plots are significant and as we go towards higher distances, the number of PA molecules starts decreasing. At a lower distance, the PA molecules are coming near to the benzimidazole ring because of the interaction between the acidic and basic sites of PA and the polymer backbone, respectively. However, PAs located far away from the polymer will behave as in the PA melt. PBI does not influence these PAs. Therefore, the numbers of PA molecules present at lower distances are more because of the interaction with benzimidazole compared to benzene. At this lower distance there is a chance that two benzimidazole molecules can share PA molecules in the case of ABPBI but it does not happen for PBI. For ABPBI, there is head–tail connection and for PBI head–head connection of benzimidazole moieties are present [see Fig. 4(a) and (b)]. As a consequence imidazole moieties are far apart in the case of PBI. Because of the larger separation of the imidazole moieties, they cannot interact with the same PA molecules. This is the reason why we observe more PA molecules at a 0.4 nm distance (Fig. 11) for ABPBI (15) compared to PBI (10). But to our surprise, benzene in the case of PBI has 8 PA molecules at 0.4 nm distances although it doesn’t have any interaction sites. Since the length of the benzene ring is smaller (less than 0.4 nm), the solvation shell at 0.4 nm from benzene COM is overlapping with the two neighboring benzimidazole rings which makes the number of the PA molecule as high as 8. The edge of the first solvation shell is at 0.75 nm (Fig. 10) for all benzimidazole and benzene for both the polymers. The overlapping of the large solvation shells plays the key role here. However, at shorter distances we can observe that the density of the PA around the benzimidazole ring is more for the ABPBI chain compared to the PBI chain which is well in agreement with experimental data20,23 that shows for a given amount of PA, ABPBI absorbs more PA compared to PBI which was also reported by Li et al.26 Since proton conductivity through these membrane strongly depends on the amount of solvent (PA), therefore the result indicates that PA doped ABPBI should exhibit better proton conductivity relative to PA doped PBI. Besides, a larger PA density along the ABPBI chain makes it more elongated and less flexible compared to PBI.
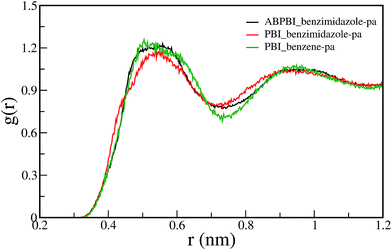 | ||
| Fig. 10 Radial distribution function (RDF) between COM of benzimidazole of PBI and PA; COM of benzimidazole of ABPBI and PA; COM of benzene of PBI and PAs. | ||
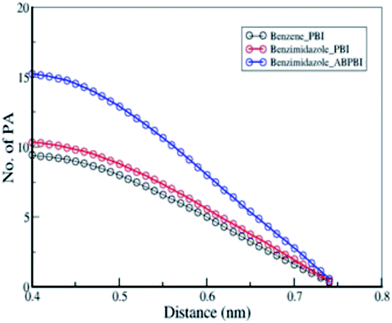 | ||
| Fig. 11 Number of PA molecules as a function of distance from COM particles of benzimidazole of PBI; benzimidazole of ABPBI; and benzene of PBI. | ||
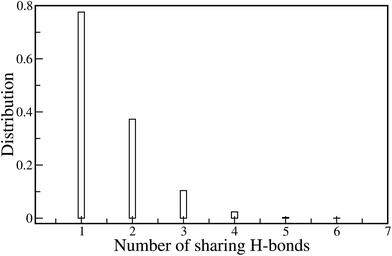
We have explored the H-bond formation along the chain for a detailed understanding of the structuring of the PA molecules along the polymer chain. Hydrogen bonding (H-bonding) between the PA and monomers plays the key role in determining chain flexibility. We calculated the number of hydrogen bonds formed between the backbone atoms of the polymer chain and the PA molecules. There are two possibilities for H-bond formation: (i) between the nitrogen of the polymer chain and the hydrogen atoms of PA, and (ii) between the amine hydrogen of the polymer chain and the oxygen atoms of PA. We have normalized the number of H-bonds by the number of imidazole moieties present in ABPBI and PBI and plot them in Fig. 12. Fig. 12(a) represents the number of H-bonds per imidazole moieties as a function of time and its distribution is plotted in Fig. 12(b). From Fig. 12(a), it is evident that the number of H-bonds per benzimidazole ring is more for ABPBI than PBI which is well in agreement with Li et al.’s report.26,27 This is only possible if two consecutive benzimidazole rings share some PA molecules i.e. the same PA molecule making two hydrogen bonds with two adjacent imidazole moieties. Therefore, we calculated the possibilities of such H-bonds for both ABPBI and PBI. In PBI, there are no such H-bonds shared between the neighboring benzimidazole moieties. On the contrary, in the case of ABPBI there are some H-bonds shared between two neighboring benzimidazole rings. We calculated the number of such H-bonds along the ABPBI chain and plot the distribution of this number in Fig. 13. It is evident that there are a maximum of six such H-bonds that can form along a single ABPBI chain but the probability is much lower. We can see in Fig. 13 that the number of sharing-bonds varies from one to six. The presence of these sharing H-bonds in PA doped ABPBI makes the chain less flexible compared to PA doped PBI.
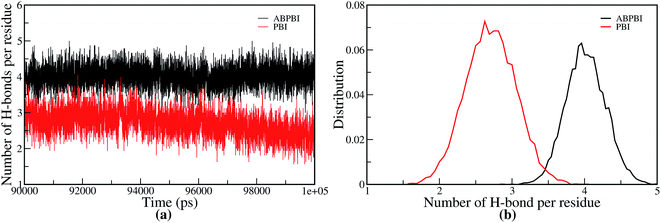 | ||
| Fig. 12 (a) Number of hydrogen bonds formed and (b) distribution of hydrogen bonds between the backbone atoms of both PBI and ABPBI chains with PA per benzimidazole. | ||
5 Conclusions
A detailed structural analysis of ABPBI and PBI single chains in melt as well as in PA were carried out using classical MD simulations. The end-to-end distance and radius of gyration shows that both the chains get elongated in the presence of PA compared to their corresponding melt system which proves that PA serves as a good solvent for both ABPBI and PBI. The PA doped ABPBI chain was observed to become more stretched compared to the PA doped PBI system. The nature of the chain conformations are different for the PA doped ABPBI and PBI which is revealed from the local as well as global arrangement of chain segments. Curvature formation along the chain is also characterized. The role of the solvent on the chain backbone structure is analyzed for PA doped ABPBI and PBI chains. The arrangement of PA molecules along the backbone confirms that ABPBI has more PA absorbing capacity than PBI. The H-bonding interaction between various atoms of the polymer backbone and the atoms of PA molecules were computed along the polymer chain. The number of H-bonds is more in the case of the ABPBI chain compared to the PBI chain. Some H-bonds are shared between neighboring benzimidazole moieties, which gives extra stability and stiffness to ABPBI. The conformational properties of the single polymer chains obtained in this work provide insight to explain the experimental findings about proton conduction. Further exploration using ab initio MD of smaller subsets of this system would reveal detail and clear understanding of the proton transport mechanism at various conformations, which is in progress. All this understanding will equip us further to develop an efficient membrane for fuel cells.Acknowledgements
SP acknowledges the University Grants Commission for the fellowship. SR acknowledges CSIR project CSC0129 for financial support and CSIR Fourth Paradigm Institute for computational time. The authors also acknowledge financial assistance received from the Center of Excellence in Polymers: COE-P (SPIRIT), established from funding received from the Department of Chemicals and Petrochemicals.References
- L. Qingfeng, H. Hjuler and N. Bjerrum, J. Appl. Electrochem., 2001, 31, 773–779 CrossRef.
- D. H. Choi, J. Lee, O. Kwon, J.-Y. Kim and K. Kim, J. Power Sources, 2008, 178, 677–682 CrossRef CAS.
- J. Parrondo, C. Venkateswara Rao, S. L. Ghatty and B. Rambabu, Int. J. Electrochem., 2010, 2011, 1–8 CrossRef.
- Y.-L. Ma, J. Wainright, M. Litt and R. Savinell, J. Electrochem. Soc., 2004, 151, A8–A16 CrossRef CAS.
- W. H. J. Hogarth, J. C. Diniz da Costa and G. Q. M. Lu, J. Power Sources, 2005, 142, 223–237 CrossRef CAS.
- D. Gomes and S. P. Nunes, J. Membr. Sci., 2008, 321, 114–122 CrossRef CAS.
- Q. Li, R. He, J.-A. Gao, J. O. Jensen and N. J. Bjerrum, J. Electrochem. Soc., 2003, 150, A1599–A1605 CrossRef CAS.
- J. A. Asensio, S. Borrós and P. Gómez-Romero, Electrochem. Commun., 2003, 5, 967–972 CrossRef CAS.
- M. Litt, R. Ameri, Y. Wang, R. Savinell and J. Wainwright, MRS Online Proc. Libr., 1998, 313 CrossRef.
- L. Qingfeng, H. A. Hjuler and N. J. Bjerrum, Electrochim. Acta, 2000, 45, 4219–4226 CrossRef.
- L. Vilčiauskas, M. E. Tuckerman, G. Bester, S. J. Paddison and K.-D. Kreuer, Nat. Chem., 2012, 4, 461–466 CrossRef PubMed.
- L. Vilčiauskas, M. E. Tuckerman, J. P. Melchior, G. Bester and K.-D. Kreuer, Solid State Ionics, 2013, 252, 34–39 CrossRef.
- R. He, Q. Li, A. Bach, J. O. Jensen and N. J. Bjerrum, J. Membr. Sci., 2006, 277, 38–45 CrossRef CAS.
- A. Wereta, M. T. Gehatia and D. R. Wiff, Polym. Eng. Sci., 1978, 18, 204–209 CAS.
- J. A. Asensio, S. Borrós and P. Gómez-Romero, J. Electrochem. Soc., 2004, 151, A304–A310 CrossRef CAS.
- J. Wainright, J.-T. Wang, D. Weng, R. Savinell and M. Litt, J. Electrochem. Soc., 1995, 142, L121–L123 CrossRef CAS.
- J. A. Asensio, S. Borrós and P. Gómez-Romero, J. Polym. Sci., Part A: Polym. Chem., 2002, 40, 3703–3710 CrossRef CAS.
- J.-T. Wang, R. Savinell, J. Wainright, M. Litt and H. Yu, Electrochim. Acta, 1996, 41, 193–197 CrossRef CAS.
- J. A. Asensio, S. Borrós and P. Gómez-Romero, J. Membr. Sci., 2004, 241, 89–93 CrossRef CAS.
- J. A. Asensio and P. Gómez-Romero, Fuel Cells, 2005, 5, 336–343 CrossRef CAS.
- S. Wang, F. Dong and Z. Li, J. Mater. Sci., 2012, 47, 4743–4749 CrossRef CAS.
- L. A. Diaz, G. C. Abuin and H. R. Corti, J. Power Sources, 2009, 188, 45–50 CrossRef CAS.
- S. C. Kumbharkar and U. K. Kharul, J. Membr. Sci., 2010, 360, 418–425 CrossRef CAS.
- S. Samms, S. Wasmus and R. Savinell, J. Electrochem. Soc., 1996, 143, 1225–1232 CrossRef CAS.
- H. Zhang and P. K. Shen, Chem. Rev., 2012, 112, 2780–2832 CrossRef CAS PubMed.
- S. Li, PhD thesis, University of Cincinnati, 2011.
- S. Li, J. Fried and J. Colebrook, Polym. Eng. Sci., 2013, 53, 597–608 CAS.
- A. P. Sunda, M. More and A. Venkatnathan, Soft Matter, 2013, 9, 1122–1132 RSC.
- S. Zhu, L. Yan, D. Zhang and Q. Feng, Polymer, 2011, 52, 881–892 CrossRef CAS.
- M. More, A. P. Sunda and A. Venkatnathan, RSC Adv., 2014, 4, 19746–19755 RSC.
- S. Pahari, C. K. Choudhury, P. R. Pandey, M. More, A. Venkatnathan and S. Roy, J. Phys. Chem. B, 2012, 116, 7357–7366 CrossRef CAS PubMed.
- M. More, S. Pahari, S. Roy and A. Venkatnathan, J. Mol. Model., 2013, 19, 109–118 CrossRef CAS PubMed.
- S. Pahari and S. Roy, J. Chem. Phys., 2013, 139, 154701 CrossRef PubMed.
- D. van der Spoel, E. Lindahl, B. Hess, G. Groenhof, A. E. Mark and H. J. Berendsen, J. Comput. Chem., 2005, 26, 1701–1718 CrossRef CAS PubMed.
- B. Hess, C. Kutzner, D. van der Spoel and E. Lindahl, J. Chem. Theory Comput., 2008, 4, 435–447 CrossRef CAS PubMed.
- W. L. Jorgensen and J. Tirado-Rives, J. Am. Chem. Soc., 1988, 110, 1657–1666 CrossRef CAS.
- W. L. Jorgensen, D. S. Maxwell and J. Tirado-Rives, J. Am. Chem. Soc., 1996, 118, 11225–11236 CrossRef CAS.
- M. J. Frisch, G. W. Trucks, H. B. Schlegel, G. E. Scuseria, M. A. Robb, J. R. Cheeseman, G. Scalmani, V. Barone, B. Mennucci, G. A. Petersson, H. Nakatsuji, M. Caricato, X. Li, H. P. Hratchian, A. F. Izmaylov, J. Bloino, G. Zheng, J. L. Sonnenberg, M. Hada, M. Ehara, K. Toyota, R. Fukuda, J. Hasegawa, M. Ishida, T. Nakajima, Y. Honda, O. Kitao, H. Nakai, T. Vreven, J. A. Montgomery Jr, J. E. Peralta, F. Ogliaro, M. Bearpark, J. J. Heyd, E. Brothers, K. N. Kudin, V. N. Staroverov, R. Kobayashi, J. Normand, K. Raghavachari, A. Rendell, J. C. Burant, S. S. Iyengar, J. Tomasi, M. Cossi, N. Rega, J. M. Millam, M. Klene, J. E. Knox, J. B. Cross, V. Bakken, C. Adamo, J. Jaramillo, R. Gomperts, R. E. Stratmann, O. Yazyev, A. J. Austin, R. Cammi, C. Pomelli, J. W. Ochterski, R. L. Martin, K. Morokuma, V. G. Zakrzewski, G. A. Voth, P. Salvador, J. J. Dannenberg, S. Dapprich, A. D. Daniels, Ö. Farkas, J. B. Foresman, J. V. Ortiz, J. Cioslowski and D. J. Fox, Gaussian 09 Revision A.1, Gaussian Inc., Wallingford CT, 2009 Search PubMed.
- C. M. Breneman and K. B. Wiberg, J. Comput. Chem., 1990, 11, 361–373 CrossRef CAS.
- S. A. Spieser, B. R. Leeflang, L. M. Kroon-Batenburg and J. Kroon, J. Phys. Chem. A, 2000, 104, 7333–7338 CrossRef CAS.
- H. J. Berendsen, J. P. M. Postma, W. F. van Gunsteren, A. DiNola and J. Haak, J. Chem. Phys., 1984, 81, 3684–3690 CrossRef CAS.
- J. G. Kirkwood, J. Chem. Phys., 1934, 2, 351–361 CrossRef CAS.
- L. Onsager, J. Am. Chem. Soc., 1936, 58, 1486–1493 CrossRef CAS.
- R. S. Bhavsar, S. B. Nahire, M. S. Kale, S. G. Patil, P. P. Aher, R. A. Bhavsar and U. K. Kharul, J. Appl. Polym. Sci., 2011, 120, 1090–1099 CrossRef CAS.
- S. Li, J. Fried, J. Colebrook and J. Burkhardt, Polymer, 2010, 51, 5640–5648 CrossRef CAS.
- W.-F. Hwang, D. Wiff, C. Verschoore, G. Price, T. Helminiak and W. Adams, Polym. Eng. Sci., 1983, 23, 784–788 CAS.
- D. Aili, L. N. Cleemann, Q. Li, J. O. Jensen, E. Christensen and N. J. Bjerrum, J. Mater. Chem., 2012, 22, 5444–5453 RSC.
Footnote |
| † Electronic supplementary information (ESI) available: All bonded force field parameters for PBI and ABPBI, charges of all atoms for PBI and ABPBI obtained from quantum chemical calculation, chemical structure of PBI and ABPBI along with atom numbering, fitting of dihedral potential energy of C–C–C–N dihedral for both PBI and ABPBI and C–C–C–C dihedral for PBI. See DOI: 10.1039/c5ra22159e |
| This journal is © The Royal Society of Chemistry 2016 |


