DOI:
10.1039/C5RA21796B
(Paper)
RSC Adv., 2016,
6, 3099-3116
Solidified SNEDDS of loratadine: formulation using hydrophilic and hydrophobic grades of Aerosil®, pharmacokinetic evaluations and in vivo–in silico predictions using GastroPlus™†
Received
19th October 2015
, Accepted 4th December 2015
First published on 7th December 2015
Abstract
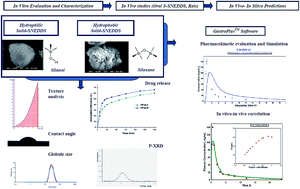
In the present study, hydrophilic and hydrophobic grades of Aerosil® were employed as adsorbents to develop a solid self-nanoemulsifying drug delivery system (S-SNEDDS) of loratadine and were evaluated for their influence on the powder flow, physicochemical and biopharmaceutical properties. Angle of repose measurements revealed better flowability of hydrophilic (15.61°) than hydrophobic (20.03°) S-SNEDDS. Texture analysis assessed their compaction behaviour. Lower initial contact angles were formed on dry hydrophobic S-SNEDDS (19.0°) than the dry hydrophilic one (26.7°). Irrespective of the type of carrier, S-SNEDDS displayed more than 80% drug loading. Hydrophobic S-SNEDDS demonstrated greater drug release (59.33%) at 15 min as compared to hydrophilic S-SNEDDS (48.23%). The excipient-compatibility study indicated no possible interactions. TEM revealed non-aggregated spherical nanosized globules (<50 nm) surrounded by an interfacial surfactant layer. SEM displayed spherical S-SNEDDS having uniform adsorption, and post-release effects depicted the presence of nanometric pores vacated by the previously adsorbed SNEDDS. Pharmacokinetic evaluations displayed enhanced systemic availability and plasma drug concentration attained by hydrophobic S-SNEDDS (Cmax, 185.99 ± 18.99 ng mL−1 and AUC0–t 425.00 ± 17.53 ng h mL−1) compared with the hydrophilic S-SNEDDS (Cmax, 141.45 ± 9.72 ng mL−1 and AUC0–t 353.00 ± 0.01 ng h mL−1). The in vivo–in silico assessment by the GastroPlus software showed good prediction accuracy with the major regional absorption from the upper small intestine. The in vitro–in vivo correlation module presented the best-fit deconvolution model and correlation function for S-SNEDDS. The reconstructed absorption profile was sufficiently superimposable to the observed profiles after convolution. This study indicates the great potential of S-SNEDDS towards enhancement of oral absorption of such poorly soluble drugs, therefore suggesting it could serve as an alternate oral delivery, and presents GastroPlus™ as a efficient tool for in vivo–in silico predictions.
1. Introduction
Oral drug delivery systems, undeniably being the most favoured and preferred route of drug administration, still present a major challenge for poorly soluble drugs especially those belonging to Class II of the Biopharmaceutical Classification System (BCS). Such concerns are also faced by BCS Class IV drugs which possess both solubility and permeability constraints, thereby presenting an even bigger challenge for formulation development. The poor aqueous solubility, low and variable bioavailability and high intra- and inter-subject variability of such drugs lead to low plasma-drug concentrations, thereby rendering them unavailable at the receptor site to elicit the desired pharmacological response.1 Amongst the various formulation strategies employed for enhancement of solubility of such therapeutic agents, the application of lipids as drug carriers in lipid-based drug delivery systems (LBDDS) is an emerging field.2,3 The proposed mechanisms for bioavailability enhancement include enhanced solubilization of the drug present in a molecular dispersed state, inhibition of P-glycoprotein efflux and reduced metabolism by the cytochrome-P450 family of enzymes, promoting the lymphatic absorption and bypassing the hepatic portal route.4–7
With the firm entry of nanotechnology in the realm of drug delivery, constant efforts are being made to improve the therapeutic activity and to minimize undesirable side effects. One such widely accepted lipid-based nanotechnological approach is a solid-self nanoemulsifying drug delivery system (S-SNEDDS) formulated from the liquid-SNEDDS, which disperses in a colloidal size range to form nanoemulsions upon aqueous dilution by gastrointestinal fluids. These SNEDDS have been described as preconcentrates of homogeneous complex systems constituting oils, surfactants and/or co-solvents which are thermodynamically stable.8–10 S-SNEDDS combines the benefits associated with lipid-based drug delivery, nanometric size of nanoemulsion globules, SNEDDS and solid-dosage forms thereby achieving enhanced solubility, bioavailability and stability.11–14 To overcome the problems faced by conventional liquid SNEDDS, such as stability, capsule-leakage and incompatibility issues, and stringent processing requirements, S-SNEDDS are developed which incorporate liquid or semisolid ingredients into powders employing diverse solidification techniques like adsorption, spray drying, melt granulation, extrusion–spheronization and eutectic mixing.15,16 Other potential advantages include (i) dosing precision offered by solid filling, (ii) ease of transfer, portability and storage, (iii) better patient compliance (specifically among geriatric patients), and (iv) diversity in solid dosage form options. Amongst various solidification techniques, the adsorption to solid carrier technique was incorporated in the present study since this offers ease of solidification, simplicity and solvent-free processing without employing any sophisticated equipment and complex control parameters. Hydrophilic and hydrophobic grades of colloidal fumed silica (Aerosil® 200 and Aerosil® R972) were employed to prepare S-SNEDDS.
The primary objective of our present work was to develop S-SNEDDS using hydrophilic and hydrophobic solid carriers and investigate their powder flow properties, and physicochemical properties. Loratadine, a non-sedative H1-receptor antagonist (antihistaminic) was employed as the model drug owing to its low oral dose (10 mg), low and variable bioavailability (10–40%), suitable log
P (4.3) and belonging to BCS Class II.17,18 Furthermore, LTD have growth-inhibitory effects on neoplastic mast cells, lowest incidence of heart rhythm disorders and cardiac deaths per million over other non-sedating antihistaminics.19–21 Nano-based drug delivery via S-SNEDDS may therefore augment the antineoplastic activity of the drug. A newer perspective of determining the tableting potential of both types of S-SNEDDS was explored by investigating their compaction behaviour using Texture Analyzer-TA.XT.Plus (Stable Micro Systems, UK). The behaviour of both hydrophilic and hydrophobic S-SNEDDS when exposed to aqueous medium was explored by contact angle studies. S-SNEDDS were characterized for their solid-state properties using non-thermal (Fourier Transform Infrared spectroscopy (FTIR) and Powder X-ray Diffraction (PXRD)), and thermal tools (Differential Scanning Calorimetry (DSC) and Thermogravimetric Analysis (TGA)) to provide rapid, versatile and reliable information about the drug-excipient compatibility. This may avoid the time consuming step of the annealing of the mixtures under long-term stress conditions.23 Furthermore, the morphological characterization was carried out by advanced and sophisticated instrumental microscopic techniques like Scanning Electron Microscopy (SEM) and Transmission Electron Microscopy (TEM). The surface morphologies of both hydrophilic and hydrophobic S-SNEDDS before and after drug release were observed by SEM, in an attempt to study the mechanism and post-effect of release of adsorbed moieties.
The secondary objective of the present work was aimed at the pharmacokinetic evaluation and in vivo–in silico assessment of the developed hydrophilic and hydrophobic LTD loaded S-SNEDDS. LTD is a weak base (pKa, 4.33) having a permeability of 7.61 × 10⁻⁴ cm s−1 and solubility of 4.59 mg mL−1 at pH 1.2 where it is completely ionized. It is well absorbed from the GIT and reaches peak plasma levels within 1–1.5 h.17,18,21,22 Various formulation strategies have been explored to ferry LTD such as solid dispersions,24,25 cyclodextrin complexes,26,27 inclusion complexes,28 liquid–solid compacts,29 pellet-based tablets30 and self-emulsifying beads.31 Some efforts have been made by Li et al. to study the pharmacokinetics of pure drug (LTD) in rats. The Cmax and Tmax of LTD were reported to be ∼80.0 ng mL−1 and 1.0 h, respectively.32,33 In the present work, we employed the GastroPlus™ software (version 9.0, Simulations Plus Inc., Lancaster, CA, USA) to evaluate the pharmacokinetic parameters of S-SNEDDS and also to simulate their in vivo absorption profiles in order to assess the pharmacokinetic predictions based on compound parameters, physiological conditions, in vitro evaluations and in vivo absorption. It further presents the regional absorption distribution by the developed S-SNEDDS over nine physiological compartments of the gastrointestinal tract (GIT). Additionally, the IVIVCPlus module of the software was employed to evaluate the best-fit correlation function to describe the IVIVC model using various deconvolution approaches, and also to reconstruct the predicted absorption profiles in order to establish the relationship between in vitro dissolution and systemic availability.
2. Materials and methods
2.1 Materials
Loratadine (LTD) was provided ex gratia from Cipla (Mumbai, India). Capmul® MCM C8 (CMC8) was gifted from Abitec Corporation (Janesville, USA). Solutol® HS15 (SHS15) was procured from BASF (Ludwigshafen, Germany). Colloidal silicas i.e. Aerosil 200 (A200) and Aerosil R972 (AR972) were received as gifts from Degussa (Hanau, Germany). All other chemicals were of analaR grade. The optimized LTD loaded liquid SNEDDS (OF) constituting 80.0 mg of CMC8 and 163.95 mg of SHS15, with 3.94% of LTD were prepared and reported by us in our earlier publication.21 These liquid SNEDDS were then solidified using hydrophilic (A200) and hydrophobic (AR972) grades of Aerosil, as presented in the present study.
2.2 Methods
2.2.1 Preparation of LTD-loaded S-SNEDDS. The composition of optimized LTD loaded liquid SNEDDS (OF) was established by us following optimization by a design of experiment (DOE) approach, constituting CMC8 as oil and SHS15 as surfactant.21 The selection of excipients were based on phase solubility studies to obtain maximum solubility of the drug in 18 excipients viz. oils, surfactants and co-surfactants, and the existence of the self-nanoemulsifying region was evaluated by phase diagram studies. Thereafter, following optimization by two-factor three-level full factorial design employing desirability function, the validated optimized formulation (OF) was prepared. The liquid SNEDDS was briefly prepared by dissolving LTD into the isotropic concoction of oil and surfactant and was gently heated at 50 °C with continuous stirring to facilitate solubilization.21 The S-SNEDDS of LTD were prepared by an adsorption to solid carrier technique using highly porous colloidal silica. The liquid SNEDDS formulation was added sequentially to each adsorbent separately and thoroughly mixed in mortar and pestle. The ratios of adsorbate (SNEDDS)
:
adsorbent (solidifying agent) were optimized using hydrophilic (A200) and hydrophobic (AR972) adsorbents to obtain non-sticky free flowing S-SNEDDS powders viz. FFSA2 and FFSAR, respectively.
2.2.2 Physicochemical characterization of LTD-loaded S-SNEDDS.
2.2.2.1 Powder properties. The S-SNEDDS (FFSA2, FFSAR) were evaluated for powder properties viz. tapped density, angle of repose, Carr’s index and Hausner’s ratio using standard procedures.34 The tapped density providing the true density of the solid material is exclusive of the voids and intraparticle pores whereas the bulk density, which is inclusive of these voids and pores, is primarily dependent on particle-size distribution, shape and tendency of the particles to adhere to one another.35 The angle of repose, Carr’s index and the closely related Hausner’s ratio are simple, fast, and popular methods of predicting powder flow characteristics.
2.2.2.2 Texture analysis. Uniaxial compression tests were performed on the prepared S-SNEDDS to determine the tableting potential of such materials. The testing was performed on a Texture Analyzer-TA.XT.Plus (Stable Micro Systems, UK) equipped with Exponent Lite software (version 5,1,1,0 Lite). An HDP/GCR granule compaction rig was tightly secured on top of an HDP/90 heavy duty platform with flat insert, which was fixed on to the instrument. The sample was filled in the circular testing area of the compaction rig, with the excess being swiped away with a flat scale. A P/45 cylindrical probe with flat surface was used for compression of the granules. At first, the probe initially travelled with a pre-test speed of 2 mm s−1 until the surface of the granular powder bed was detected at 0.5 g trigger force. Thereafter, the probe was made to travel with TA settings comprising a test speed of 0.1 mm s−1 up to a distance of 2.5 mm (target mode) and finally relaxing back to the start position at a post-test speed of 10 mm s−1. This resulted in formation of a granular compact (Gr-Co) which was then further compacted with the same TA settings to form a firm compact (F-Co). This complete cycle of formation of granular compact and firm compact was performed four times, with the firm compacts being deaggregated manually to their powder forms after each cycle. The maximum force and area under curve (AUC), indicative of hardness and energy respectively, were calculated with the help of Exponent Lite software.
2.2.2.3 Drug loading efficiency. S-SNEDDS (FFSA2 and FFSAR) were weighed (100 mg) and dissolved in 10 mL distilled methanol to evaluate the loading efficiency. These were then vortexed for 10 min followed by centrifugation at 3000 rpm (Remi Equipments Pvt. Ltd., India) for 10 min. The supernatant was collected, filtered through Sartorius filter paper (8 μm), suitably diluted and analyzed at 247 nm using a UV spectrophotometer (UV-Vis Spectrophotometer, 1800, Shimadzu, Japan). The drug loading efficiency was determined by the following equation: |
 | (1) |
2.2.2.4 Reconstitution study. The reconstitution ability was observed by dispersing 100 mg of S-SNEDDS in 100 mL of Millipore water (Molsheim, France) for 1 h using a cyclomixer (Cyclo, Remi Equipments Pvt. Ltd.) to disperse samples completely, followed by centrifugation at 3000 rpm for 10 min.11,36 The supernatant was withdrawn and analyzed for optical clarity (percent transmittance) at 400 nm using a UV spectrophotometer. The reconstitution behaviour was evaluated for mean globule size (Z-avg), Polydispersity Index (PDI) and zeta potential by dynamic light scattering, with a Zetasizer Nano ZS (Malvern Instruments, Worcestershire, UK) at a wavelength of 633 nm at 25 °C. The samples were also analysed 24 h post dispersion to observe any signs of phase separation or any change in the size distribution. To check for reproducibility, the analysis was carried out in triplicate.
2.2.2.5 In vitro drug release study. S-SNEDDS equivalent to 10 mg of LTD were filled in hard gelatin capsules for the in vitro drug release study using USP dissolution apparatus 2. The capsules were immersed in 900 mL of 0.1 N HCl with the aid of sinkers. The study was performed at 50 rpm and maintained at 37 ± 0.5 °C. Aliquots (5 mL) were withdrawn at timed intervals up to 120 min and replenished with equal volumes of fresh media to maintain the sink condition. The experiment was performed in triplicate and all samples were analyzed by the in-house validated HPLC method.37
2.2.2.6 Contact angle studies. The wetting behaviour of S-SNEDDS (FFSA2, FFSAR) was studied by contact angle measurements using the Optical Contact Angle tester (OCAH230, Dataphysics, Germany) equipped with a high performance 6× zoom lens and high resolution CCD camera. Water drops (5 μL) were dispensed at the rate of 1.0 μL s−1 to the solidified formulations (compressed into a flat cake) using a Hamilton syringe DS 500/GT (O.D: 0.52 mm, I.D: 0.26 mm, and L: 51.0 mm) attached to the equipment. A series of images were captured from video sequences for measurement of contact angles formed on the dry and pre-wetted surfaces, using the software package SCA 20 version 2. The video was taken until all the liquid was imbibed, and the total time of spreading and drainage was noted.
2.2.3 Solid-state characterization.
2.2.3.1 Fourier transform infrared spectroscopy (FTIR). An IR Prestige-21 FTIR spectrophotometer (Shimadzu, Japan) equipped with an attenuated total reflectance (ATR) accessory was used to obtain the infrared spectrum of the drug in the isotropic mixtures of excipients. Analysis of pure drug (LTD), CMC8, SHS15 along with their physical mixtures (1
:
1) and co-melts (1
:
1) was carried out using KBr discs to investigate for possible drug–excipient interactions, if any. Optimized liquid SNEDDS (OF), solidifying agents (A200, AR972), S-SNEDDS (FFSA2, FFSAR) were also analyzed for interactions. All the samples were dried under vacuum prior to obtaining any spectra and scanned from a frequency range of 4000–600 cm−1.
2.2.3.2 Powder X-ray diffraction studies (PXRD). Diffraction patterns of pure drug (LTD), physical mixtures (PM1, PM2) and co-melts (CM1, CM2) of drug and excipient, solidifying agents (A200, AR972) and the S-SNEDDS (FFSA2, FFSAR) were obtained using a powder X-ray diffractometer (Bruker AXS D8 Advance, Rheinstetten, Germany) to assess their crystallinity. These were scanned over a 2θ range from 10° to 40° at a rate of 2° per minute at 0.02° 2θ step size.
2.2.3.3 Differential scanning calorimetry studies (DSC). Thermal analysis of the pure drug (LTD), individual excipients (CMC8, SHS15), physical mixtures (PM1, PM2) and co-melts (CM1, CM2) in 1
:
1 ratio, optimized liquid SNEDDS (OF), solidifying agents (A200, AR972), and S-SNEDDS (FFSA2, FFSAR) were carried out using a differential scanning calorimeter (DSC-50, Shimadzu) under a purge of dry nitrogen gas (50 cm3 min−1). Samples were placed in aluminium pans, adequately sealed by crimping with the lid, and heated from ambient temperature to 200 °C at a pre-programmed heating rate of 10 °C min−1.
2.2.3.4 Degradation studies (TGA-DTA). Simultaneous thermogravimetric analysis (TGA) and differential thermal analysis (DTA) techniques were used for characterization of thermal degradation of LTD, solidifying agents (A200, AR972) and S-SNEDDS (FFSA2, FFSAR). The samples were taken in aluminium pans and heated from ambient temperature to 600 °C at a heating rate of 10 °C min−1 under a purge of dry nitrogen gas (50 cm3 min−1) using a DTG 60 instrument (Shimadzu, Japan). The thermal stability of the sample was assessed by studying the degradation peaks and measuring the weight loss.
2.2.4 Morphological characterization.
2.2.4.1 Transmission electron microscopy (TEM). The globule shape and size of the S-SNEDDS were investigated by TEM (Tecnai 20, 200 kV, Philips, Holland). The aqueous dispersion for analysis was obtained by dispersing the formulation (100 mg) in Millipore water (100 mL), vortexing for 15 min and filtering it through Millipore filter paper (8 μm). A drop of nanoemulsion was placed over a Cu-grid coated with carbon film and negatively stained using 1% (w/v) phosphotungstic acid. The grid was air-dried at ambient temperature before loading in the microscope.
2.2.4.2 Scanning electron microscopy (SEM). The surface morphologies of drug (LTD), solidifying agents (A200, AR972), S-SNEDDS before drug release (FFSA2, FFSAR) and S-SNEDDS after drug release (FFSA2-D, FFSAR-D) were examined using SEM (JEOL JSM-6390LV, Tokyo, Japan) by mounting the samples onto a brass stub using double-sided tape and vacuum coating with platinum. The samples were imaged at 20 kV and at different resolutions to have better insight of the surfaces.
2.2.5 Pharmacokinetic study. Male Sprague-Dawley rats (body weight 180–200 g) were used for animal studies. Standard laboratory conditions with proper diet and water ad libitum were provided to animals for 5 days prior to the study. The experimental protocol was approved by the institutional animal ethical committee (no. BIT/PH/IAEC/12/2014) of the Department of Pharmaceutical Sciences and Technology, Birla Institute of Technology, Mesra, Ranchi, in accordance with National Institutes of Health Guide for Care and Use of Laboratory animals.38 Rats were fasted overnight prior to the experiment and divided randomly into two groups, each group consisting of six rats. Group I and Group II were administered with hydrophilic S-SNEDDS (FFSA2) and hydrophobic S-SNEDDS (FFSAR), respectively, each at 10 mg kg−1 oral dose. Blood samples were serially collected from the retro-orbital sinus at time points of pre-dose, 0.25, 0.5, 1, 2, 3, 4, 6, 8, 12 and 24 h after oral dosing.39 Blood samples were collected in K3-EDTA tubes followed by centrifugation (3000 rpm, 15 min) and the respective plasma samples were stored at −20 °C until analysis. The rat plasma samples were analyzed by the in-house validated liquid chromatography-electrospray ionization mass spectrometry (LC-ESI-MS/MS) method using LTD-d5 as internal standard and solid-phase extraction technique. The chromatographic separations were achieved on Gemini NX-Reverse Phase C18 (50 × 4.6 mm; 5 μm) column (Shimadzu, Japan) using a mobile phase consisting of 5 mM ammonium formate buffer in water (pH 3.5 ± 0.1 with formic acid), and acetonitrile (20
:
80 v/v), at a flow rate of 0.400 mL min−1 and injection volume of 10 μL. An API-3000 triple quadrupole mass spectrometer (MDS Sciex®; Toronto, Canada) employing positive ion-multiple reaction monitoring (+MRM) mode was used (unpublished data).
2.2.6 Pharmacokinetic analysis. The plasma pharmacokinetic parameters were calculated by non-compartmental analysis using the PKPlus™ module of GastroPlus™ software (version 9.0, Simulations Plus Inc., Lancaster, CA, USA). Peak plasma concentrations (Cmax), time to reach Cmax (Tmax) and area under the plasma concentration–time curve (AUC0–t) from time zero to the last measured concentration (Clast) were obtained from the plasma concentration–time curves. The elimination rate constant (Kel) was calculated from the slope of the terminal phase of the log plasma concentration–time points. AUC from time zero extrapolated to infinity (AUC0→∞) was calculated as AUC0–t + Clast/Kel. The elimination half-life (T1/2) was calculated by 0.693/Kel. Total plasma clearance (CL) was calculated by dose/AUC. Additionally, the area under the first moment curve (AUMC) was also determined by calculating the area under the product of time and concentration vs. time curve. The mean residence time (MRT) is calculated by the ratio of AUMC and AUC whereas the steady-state volume of distribution (Vss) is calculated as the product of MRT and CL.The compartmental analysis (one, two and three-compartment) was performed using the PKPlus™ module of GastroPlus™ software, where the model selection was based on the regression coefficient (r2) and statistical tests like Akaike Information Criterion (AIC) and Schwartz Criterion (SC). The compartmental analysis provided additional pharmacokinetic parameters like volume of the central compartment (Vc), clearance (CL), absorption rate constant (Ka), distribution rate constant (K12, K13), redistribution rate constant (K21, K31) and elimination rate constant (K10).
2.2.7 In silico assessment-GastroPlus™ simulation. The GastroPlus™ software, based on an advanced compartmental absorption and transit (ACAT) model, is a physiologically based oral absorption model consisting of nine compartments representing different segments of the GIT and was used to simulate the in vivo absorption profile of the developed hydrophilic and hydrophobic LTD-loaded S-SNEDDS i.e. FFSA2 and FFSAR. The program consists of three tabs for data input i.e. compound, physiology and pharmacokinetics tabs. The physicochemical parameters obtained experimentally or from the literature or from ADMET Predictor™ (Simulation Plus Inc.) were fed into the compound tab. The experimentally determined in vitro dissolution profiles of both S-SNEDDS were loaded into the software using the tabulated in vitro dissolution data input function. The GastroPlus™ default rat fasted physiology (Opt-logD model SA/V 6.1) along with the default values for transit time for each compartment was selected in the physiology tab. Absorption scale factors (ASF), calculated from these coefficients, scale the effective permeability to account for variations in surface-to-volume ratio, pH effects, influx or efflux transporter differences, differences in paracellular absorption and other absorption-rate-determining effects that differ from one compartment to another.40,41 The micro-constants and disposition parameters obtained from the concentration–time profiles for both S-SNEDDS (FFSA2, FFSAR) were then fed into the GastroPlus™ built-in compartmental PK model to simulate their oral absorption profiles. The predicted PK parameters i.e. Cmax, Tmax, AUC0–t, AUC0→∞, cumulative intestinal absorption (Fa) and oral bioavailability (F) were then compared with the observed experimental PK parameters obtained from the best-fit compartmental model by PKPlus™ module imported into the pharmacokinetic tab. The accuracy for prediction of the pharmacokinetic parameters was evaluated by the prediction fold error (eqn (2)) and the simulated model was considered to be of high prediction accuracy if the predicted values of the major pharmacokinetic parameters fell within twofold of the observed values (fold error, FE ≤ 2).42 |
 | (2) |
The GI absorption of the developed LTD loaded S-SNEDDS from the nine physiological compartments of GIT was also ascertained from the GastroPlus™ simulation software in order to interpret the likely regional GI absorption and also to assess the effectiveness of the delivery system.
2.2.8 In vitro–in vivo correlation. The relationship between in vitro dissolution and in vivo absorption profiles of the LTD-loaded S-SNEDDS (FFSA2 and FFSAR) was determined using the level A correlation by the IVIVCPlus module of GastroPlus™ software. This module uses deconvolution followed by convolution to carry out the predictions and to reconstruct the plasma concentration profiles. The correlation between the in vivo drug release fraction and in vitro drug release was achieved using various deconvolution models viz. the GastroPlus mechanistic absorption model, numerical deconvolution and Loo–Riegelman method (two-compartment model) and regression analysis was used to select the best-fit deconvolution model. The plasma concentration–time profile was predicted and reconstructed in the convolution tab based on the in vitro and in vivo profiles of the developed formulations.
3. Results and discussion
3.1 Preparation of LTD loaded S-SNEDDS
Amongst the various solidification techniques reviewed in the literature, the adsorption to solid carrier technique using colloidal silica as adsorbent was chosen to prepare LTD loaded S-SNEDDS owing to the advantages they hold. To explore the effect of solid carrier on the physicochemical behaviour of solidified SNEDDS, adsorption was performed with two different grades of colloidal silica i.e. hydrophilic (A200) and hydrophobic (AR972) to prepare solidified formulations designated as FFSA2 and FFSAR, respectively. In order to attain non-sticky, non-greasy and non-aggregated free flowing powders, the ratios of adsorbate (SNEDDS)
:
adsorbent (solidifying agent) were optimized and found to be 1
:
1 and 1
:
2 for FFSA2 and FFSAR, respectively. The adsorption of 1 part of liquid lipid formulation on 1 part of A200 was sufficient to produce fine powders whereas the same 1 part of AR972 was insufficient to adsorb 1 part of the liquid lipid formulation. This clearly indicated the high adsorbing potential of A200 owing to its higher specific surface area (175–225 m2 g−1) as compared to that of AR972 (90–130 m2 g−1).43,44 The composition of the final S-SNEDDS (FFSA2 and FFSAR) includes CMC8 (80 mg), SHS15 (163.95) and LTD (10 mg) with A200 (253.95 mg) or AR972 (507.90 mg).
3.2 Physicochemical characterization of LTD-loaded S-SNEDDS
3.2.1 Powder properties. The systems of particulate solids are said to be the most complex physical systems since no two particles are identical and the nature of momentum and energy exchange defies description except in the most ideal terms.45 The derived properties of the S-SNEDDS powder viz. densities (bulk and tapped), bulkiness and flow properties (angle of repose, Hausner ratio, Carr’s index) determined by standard procedures are tabulated in Table 1. However, the fundamental properties of the solid formulations viz. particle size and shape were later construed from the microscopic examination by SEM. Additionally, the compression and compaction behaviour of solidified formulations were assessed to evaluate their tableting capability.
Table 1 S-SNEDDS: powder flow properties, physicochemical characterization and dissolution parameters
Bulk properties and flow properties of S-SNEDDS |
Powder properties |
FFSA2 |
FFSAR |
Weight (g) |
3.26 (0.015) |
3.22 (0.025) |
Bulk volume |
8.13 (0.115) |
8.20 (0.20) |
Tapped volume |
6.53 (0.115) |
6.43 (0.153) |
Bulk density |
0.401 (0.004) |
0.393 (0.008) |
Tapped density |
0.499 (0.007) |
0.501 (0.016) |
Hausner’s ratio |
1.24 (0.004) |
1.28 (0.050) |
Carr’s index (%) |
19.67 (0.282) |
21.50 (3.037) |
Angle of repose (θ) |
15.61 (1.816) |
20.03 (1.709) |
Flow property |
Excellent/fair |
Good/passable |
Physicochemical characterization of S-SNEDDS |
|
FFSA2 |
FFSAR |
2 h |
24 h |
2 h |
24 h |
Per cent transmittance (400 nm) |
94.52 (0.15) |
92.89 (0.61) |
95.94 (0.312) |
94.63 (0.62) |
Globule size (nm) |
27.60 (0.523) |
29.2 (0.375) |
24.60 (0.566) |
26.84 (0.545) |
Poly Dispersity Index (PDI) |
0.178 (0.022) |
0.133 (0.016) |
0.171 (0.069) |
0.218 (0.033) |
Zeta potential (mV) |
−24.9 (0.15) |
−23.3 (0.495) |
−28.2 (0.283) |
−27.2 (0.141) |
Dissolution parameters |
Drug loading efficiency (%) |
83.086 (4.781) |
83.224 (4.140) |
Q(t) at t = 15 min (%) |
48.23 (8.10) |
59.33 (4.97) |
Dissolution efficiency (%) |
60.13 |
66.38 |
The solidified FFSA2 and FFSAR were found to be of lower bulk densities i.e. 0.40 g cm−3 and 0.39 g cm−3, respectively, signifying the existence of large gaps between the surfaces of the packed particles. The bulk densities are useful in the ground check for bulk uniformity during filling of capsules. Moreover, the bulkiness or the specific bulk volume for FFSA2 and FFSAR, calculated to be 2.49 and 2.54, respectively, is considered to be an important parameter during packaging. The tapped densities obtained after 100 taps, for both formulations, were found to be in the range of 0.5 g cm−3 ± 2%, indicating the condition of closest packing wherein the particles of smaller dimensions sift down to get placed between the relatively larger particles (Table 1). However, the smaller difference between the bulk and tapped densities indicative of the flow of particles was expressed by Hausner’s ratio and Carr’s index (Table 1). Hausner’s ratios for FFSA2 (1.24) and FFSAR (1.28) were found to lie between 1.19–1.25 and 1.26–1.34 indicating ‘fair’ and ‘passable’ flow characters, respectively. Carr’s index for FFSA2 (19.67) and FFSAR (21.50) categorized the powders to have ‘fair’ and ‘passable’ flow characteristics as per the standard ranges.34 However, the angle of repose (θ) formed between the horizontal surface and surface of pile is considered to be a direct and accurate reflection of the bulk and flow properties of powder. This angle was found to be 15.61° for FFSA2 and 20.03° for FFSAR indicating ‘excellent’ and ‘good’ powder flow, respectively. The angle of repose, which is also a measure of the coefficient of friction, implied the existence of sufficiently smooth and regular shaped particles. Conclusively, FFSA2 showed excellent and better flowability as compared to the good and passable flowability attained by FFSAR. However, for the purpose of tableting the S-SNEDDS, a greater excellence in flow characteristics can be achieved by additional use of glidants.
3.2.2 Compaction behaviour: texture analysis. With oral dosage forms being still preferred by patients, the ability of the powdered formulation to be compressed and compacted was also explored which would directly relate to the tableting performance of the solid formulations. The ability of the powder to decrease in volume under pressure defines the compressibility factor whereas its ability to be compressed into a tablet of a certain strength or hardness indicates the compactibility of the powders. The compressibility factor was indicated by Carr’s index and the compaction behaviour of the powder beds were studied using a Texture analyzer. The four cycles of compaction, each comprising formation of granular compact (Gr-Co) and subsequent firm compact (F-Co), are displayed by the force–displacement curves of both S-SNEDDS (FFSA2 and FFSAR) in Fig. 1. The first granular compact (Gr-Co-1) resulted in achievement of 504.38 g and 654.53 g of force with 2.628 kg s and 3.757 kg s of energy (AUC) for FFSA2 and FFSAR, respectively. The subsequent formation of first firm compacts (F-Co-1) of FFSA2 and FFSAR displayed nearly the same hardness of 22.554 kg and 22.563 kg, with nearly the same energy consumption indicated by the AUC values of 153.933 kg s and 153.252 kg s, respectively. However, the next consecutive cycle displayed a sudden and steep rise in the hardness of the S-SNEDDS compacts (F-Co-2) with the hydrophilic FFSA2 showing more hardness (29.99 kg) as compared to the hydrophobic FFSAR with hardness of 27.609 kg. The formation of granular compacts (Gr-Co-1 to Gr-Co-4) and firm compacts (F-Co-1 to F-Co-4) of both FFSA2 and FFSAR are represented by the formation of force–displacement curves, shown in Fig. 1A and B. The close inspection of these curves during compaction revealed the existence of a yield point in firm compacts (F-Co-1 to F-Co-4) at around 0.25 mm distance, where the curve deviated to a sudden exponential rise in the slope. This yield point achieved during compaction was found to exist at a yield force equivalent to the maximum force achieved during formation of granular compacts (Gr-Co-1 to Gr-Co-4). Thus, it may be inferred that during formation of granular compacts (Gr-Co-1 to Gr-Co-4) the particles initially sift down to fill up the interparticular spaces resulting in an interlocked arrangement of the particles, and thereafter when compacted further, the particles try to move past one another leading to deformation of the packed bed resulting in formation of firm compacts (F-Co-1 to F-Co-4). The next consecutive two cycles resulted in insignificant changes in hardness values of FFSAR as evident from the overlapping curves (Fig. 1B). However, a slight rise in the hardness values was observed with FFSA2. This may be because of the formation of stronger hydrogen bridge linkages between the primary particles of hydrophilic A200 and also with the entrapped moisture. This may be advantageous if the tablet stability is to be considered. Hence, the behaviour of the particles towards the compaction process is important in pharmaceutical tableting since changes in surface properties, crystallization, milling process etc. may affect the flow characteristics and compactibility significantly.
 |
| Fig. 1 Force–displacement curves of (A) FFSA2 and (B) FFSAR: pre-compaction behavior of granular powder bed (Gr-Co-1 to Gr-Co-4) and compaction behavior of compacts (F-Co-1 to F-Co-4). | |
3.2.3 Drug loading efficiency and reconstitution study. Both hydrophilic FFSA2 and hydrophobic FFSAR displayed more than 80% drug loading, irrespective of the carrier used (Table 1). The incomplete loading of the drug could be the result of the inevitable loss which must have been incurred during the transfer into/from the mortar or during the solidification process. Reconstitution is of utmost concern since the solidified SNEDDS must self emulsify into a nanoemulsion upon aqueous dilution and agitation in the GI fluid. The low absorbance values of S-SNEDDS resulted in greater than 90% per cent transmittance by the aqueous dispersion even after 24 h. A marginal difference was observed in the globule sizes of FFSA2 and FFSAR with relatively larger sizes obtained in S-SNEDDS prepared with the hydrophilic carrier (A200) i.e. FFSA2 (Table 1). An insignificant increase was noted in the mean globule size after 24 h of aqueous dispersion but without any sign of drug precipitation. Also, all the samples showed mono-disperse globules revealed by a low PDI (Table 1). Additionally, a slight increase in globule size of redispersed S-SNEDDS in 0.1 N HCl (FFSA2, 27.60 nm and FFSAR, 24.60 nm; 2 h) as compared to liquid SNEDDS21 (OF, 19.16 nm; 2 h) was noted. This perhaps is caused by a decrease in effective surfactant concentration in aqueous phase due to adsorption to the carrier. This is supported by our earlier report where a similar increase in globule size for dispersed liquid SNEDDS was obtained when the surfactant concentration was reduced.11,21,46 However, the absence of precipitation and any sign of coalescence of globules, affirmed by zeta potential values closer to ±30 mV, indicated the stability of the nanoemulsion formed upon reconstitution of S-SNEDDS (Table 1). The reconstitution into nanometric sizes confirms the suitability of the adsorption method and conversion of liquid SNEDDS into solid-SNEDDS.
3.2.4 In vitro drug release studies. The systemic absorption of the drug primarily depends on the dissolution and release of the drug in the dissolution medium. Since drug dissolution may be the rate-limiting factor for drug absorption in case of BCS Class II drugs, the in vitro dissolution may be relevant in prediction of the likely in vivo behaviour of the drug. The hydrophobic FFSAR displayed faster drug release initially (59.33%) in comparison to the hydrophilic FFSA2 (48.23%) as evident from the amount of drug released (Qt) in 15 min (Table 1). This is probably due to the fact that such carriers have a low specific surface area which improves the dissolution rate as compared to the carriers with high specific surface area as also reported by Krupa et al., 2014.47 On the contrary, porous carriers with high specific surface area may tend to be less dispersed in the GIT with a slower rate of adsorption and drug dissolution.47 Moreover, when dispersed in liquid, the isolated surface silanol groups imparting hydrophilic character to A200 have a tendency to form hydrogen bridge linkages with each other directly or indirectly via the molecules in the liquid, resulting in formation of a temporary three-dimensional lattice structure.48 Such a structure which breaks down under mechanical stress is here perhaps broken down again due to stirring/GI motility. These structural changes possibly could be responsible for the delayed release of the adsorbed drug from the surfaces of hydrophilic S-SNEDDS (FFSA2). The dissolution efficiency (% DE) achieved by hydrophilic and hydrophobic S-SNEDDS were found to be 60.13% and 66.38% respectively (Table 1). The dissolution profiles of FFSA2 and FFSAR were compared based on a model independent approach using a difference factor (f1) and similarity factor (f2), calculated as per the US-FDA guidelines for dissolution testing of immediate release solid oral dosage forms. The difference factor (f1), which measures the relative error between the two curves and is calculated by the percent (%) difference between the two curves at each time point, was found to be 9.66%. The similarity factor (f2) representing the measure of similarity in percent dissolution between two curves was found to be 59.37%. Since f1 lies within 0–15% and f2 is greater than 50%, the sameness or equivalence of the two curves can be ensured (as per the guidelines). Despite the fact that the dissolution profiles of both S-SNEDDS are somewhat similar to each other, faster drug release was observed with hydrophobic S-SNEDDS. Additionally, it is also said that Aerosil hydrophobic silica, which contains hydrophobic surface siloxane groups, offers distinct advantages over Aerosil hydrophilic silica with regard to dispersibility due to the lesser aggregation or agglomeration.48 Interestingly, the liquid LTD-SNEDDS which was successfully developed as reported in our previous publication (DE of 73.84% in 120 min),21 when formulated into S-SNEDDS produced a more sustained effect but still achieved DE of 60.13% and 66.38% by FFSA2 and FFSAR, respectively. Such observation of slower dissolution from solidified-SNEDDS has also been reported by other authors.49,50 It can thus be hypothesized that liquid-SNEDDS when adsorbed onto adsorbents would be retained within the pores of the carriers either partially, or completely fill the intraparticular pores, or adsorbed as a thin film on the adsorbent surface in case of carriers with low surface area. Such a hypothesis is based on the occurrence of lag phase by S-SNEDDS where 65% of LTD is released in 58.78 min and 45.18 min from FFSA2 and FFSAR, respectively, in contrast to liquid LTD-SNEDDS releasing the drug in mere 4.79 min.21 It is during this lag phase that the SNEDDS is embedded within the carrier and entrapped in the intraparticular pores, and the duration primarily depends on the adsorbing capacity, size, and specific surface area of the adsorbent. The drug dissolution and release are therefore dependent on the physical retention of the lipid formulation in the intraparticular pores and the area of contact, which are themselves dependent on the specific surface area and particle size of the adsorbent. The type of retention, as previously hypothesized, would determine the total contact area which acts as nucleation sites for the drug present in liquid-SNEDDS. A larger area of contact would lead to greater nucleation rate and thus may result in precipitation of the drug, as stated by Agarwal et al., 2009.49 Formulations like FFSA2 having a relatively larger specific surface area (175–225 m2 g−1) than FFSAR (90–130 m2 g−1) would provide a greater area of contact leading to a greater potential for nucleation which decreases the extent of drug release. The impact of contact area on nucleation is based on the fact that the surface silanol groups on FFSA2, a potential proton donor as well as acceptor, would significantly affect drug affinity to its surface, specifically the hydrophobic molecules like LTD by formation of low energy van der Waals and London forces.50,51
3.2.5 Contact angle studies. Wettability indicates the degree of wetting of a solid when in contact with a liquid and involves the measurement of contact angle as the primary data. The liquid penetration into both dry and pre-wetted surfaces of S-SNEDDS was studied by measurement of the contact angle and the total drainage time. The contact angles which the liquid forms on the dry and pre-wetted surfaces of FFSA2 and FFSAR over the course of liquid penetration are shown in Fig. 2. Since the granules of S-SNEDDS are prepared by porous carriers (A200 and AR972), the compressed powder cakes having an inherent porous structure resulted in spontaneous penetration of the liquid drop. Though the penetration was spontaneous, the difference in contact angles and total drainage time taken by the dry and pre-wetted hydrophilic and hydrophobic S-SNEDDS were quite explicit. The visual differences in contact angles between FFSA2-dry, FFSA2-wet, FFASR-dry and FFSAR-wet are shown in Fig. 2 at common time points of 0, 2.7 and 8.4 s. The FFSA2-dry and FFSAR-dry resulted in initial contact angles (0 s) of 26.7° and 19.0°, respectively, with total drainage times of 8.75 s and 10.07 s, respectively. The probable reason for the larger initial contact angle formed on hydrophilic FFSA2 is the high porosity of the A200 carrier as compared to AR972. This is said to be due to the established fact that porous compressed powders tend to have larger contact angles than their counterparts, as reported by Yuan and Lee.52 However, the undoubtedly longer drainage time taken by FFSAR-dry is due to the hydrophobic nature of its carrier leading to restricted motion of the liquid as it advances into the bed. These effects were more prominent when the contact angles were measured on pre-wetted powders. The presence of moisture on the pre-wetted surface of FFSA2 (FFSA2-wet) enhanced the wettability of the surface as evidenced by the lower contact angle of 26.0° (0 s). The drop spreads readily with a low drainage time of 7.75 s due to the reduced friction by the presence of liquid on the top layer of the surface as well as in the pores. The initial contact angle (0 s) formed on the surface of pre-wetted FFSAR (FFSAR-wet) was found to be higher (24.3°) than that formed on FFSAR-dry (19.0°). Moreover, the total drainage time attained by FFSAR-wet was found to be quite high i.e. 23.85 s, perhaps owing to its hydrophobicity. In spite of the differences, the contact angles were still lower than 90° which reveals good wettability of both the S-SNEDDS. The good wettability is plausibly due to the reduced interfacial tension between the solid particles and the liquid, provided by the non-ionic surfactant present in the SNEDDS, which is adsorbed on to these solid carriers. This might be advantageous to keep the particles dispersed in the aqueous medium. The observed phenomenon of wetting would provide a direct insight into the behaviour of S-SNEDDS when exposed to aqueous medium or its behaviour towards the presence of moisture during lubrication and tableting.
 |
| Fig. 2 Contact angle studies: wetting behaviour of dry and pre-wet S-SNEDDS. | |
3.3 Solid-state characterization
3.3.1 Fourier transform infrared spectroscopy (FTIR). The interaction between the drug and the excipients often leads to identifiable changes in the infrared profile of the pure drug. IR spectra of loratadine (LTD), individual excipients (CMC8 and SHS15) and physical mixtures (PM) and co-melts (CM) of the drug with individual excipients are given in ESI Fig. S1A.† LTD showed characteristic absorptions at 1701 cm−1 (C
O ester stretch); 1222 cm−1 (C–O stretch); 1643 cm−1 (C
N stretch); 2985 cm−1 (
CH stretch); 1566 cm−1 and 1469 cm−1 (benzene ring stretch).53 The spectral data showed the retention of the characteristic absorption of LTD in 1
:
1 physical mixtures (PMs) and co-melts (CMs) with each individual excipient, indicating retention of the chemical identity of loratadine. However, a slight reduction in peak intensities and broadening of the peaks were observed in the PMs and CMs, possibly due to the mixing or the loss of crystallinity. The FTIR of optimized liquid SNEDDS (OF), the solidifying agents (A200 and AR972) and the respective solid-SNEDDS (FFSA2 and FFSAR) are shown in ESI Fig. S1B.† The characteristic peaks of LTD were found to be retained but slightly broadened in OF, FFSA2 and FFSAR. Thus, the FTIR spectral data confirms that all the excipients do not alter the performance characteristic of the drug, indicating their compatibility.
3.3.2 Powder X-ray diffraction studies (PXRD). The high temperatures achieved by thermal analysis could result in potential drug/excipient degradation, which may significantly influence the performance characteristics of the drug and formulation. To overcome this limitation, PXRD analysis was also conducted. Crystallinity of the particles, determined through powder PXRD, is an important quality attribute to identify changes in polymorphism, stability, solubility and dissolution rate etc. The X-ray diffractogram confirmed the crystallinity of LTD, with sharp and distinctive peaks at 2θ angles of 15.106, 16.253, 16.471, 19.482, 21.056, 22.823, 23.548, 23.787 and 30.424 (Fig. 3A). All the major characteristic crystalline peaks for LTD were retained in the physical mixtures and co-melts of the drug and excipients, though at reduced intensities (Fig. 3A). The adsorbents (A200, AR972) showed no intrinsic peaks (Fig. 3B). PXRD analysis demonstrated diffused spectra of S-SNEDDS, without any characteristic peaks of LTD owing to amorphization of LTD during formulation (Fig. 3B). Thus, in addition to the advantages of self-emulsifying formulations, amorphization of the drug is expected to show better dissolution behavior owing to nanometric sizes and absence of crystallinity. The study also indicates the absence of any sign of precipitation of LTD when formulated into S-SNEDDS. This was also supported by SEM images wherein no drug precipitation or crystallization was observed on the surface of S-SNEDDS.
 |
| Fig. 3 PXRD plots of (A) loratadine (LTD); physical mixtures: PM1 (LTD + CMC8), PM2 (LTD + SHS15); co-melts: CM1 (LTD + CMC8), CM2 (LTD + SHS15) and (B) solidifying agents (A200, AR972) and S-SNEDDS (FFSA2, FFSAR). | |
3.3.3 Differential scanning calorimetry studies (DSC). Thermal analysis of the drug (LTD), pure excipients (CMC8, SHS15), solidifying agents (A200, AR972) physical mixtures (PM1, PM2) and co-melts (CM1, CM2), optimized liquid SNEDDS (OF), solidifying agents (A200, AR) and S-SNEDDS (FFSA2, FFSAR) are presented in Fig. 4. DSC monitors the endothermic and/or exothermic peaks in a system, occurring as a result of heat gained and/or lost due to changes within the sample as a function of temperature. A sharp endothermic peak of LTD at 134.61 °C corresponding to the melting point of the drug indicates its crystalline nature. No distinct endothermic peak was observed in pure excipients (CMC8, SHS15, A200, AR972). The PMs and CMs showed the absence of a LTD peak suggesting complete solubility of LTD in the excipients indicating good solubility. No new endothermic and exothermic peaks were observed in the PMs and CMs, indicating no incompatibilities. The optimized liquid SNEDDS formulation (OF) revealed an endothermic broadening in the range of 125–135 °C. So, it is probable that during DSC measurement the solid drug (when present) dissolves in the molten carrier and is no longer present in its undissolved form in the system, when the melting temperature of LTD is reached. Moreover, the solidifying agents too did not display any endothermic peak over the entire range tested. However, slight exothermic behaviour was observed in the solidifying agents and S-SNEDD formulations, in the range of 70–80 °C but with the absence of any thermal degradation being observed as explicit from the DTA/TGA curves. As shown in Fig. 4B, the S-SNEDDS (FFSA2 and FFSAR) did not show any definite melting endothermic peak due to molecular dispersion of the drug in the lipidic excipients, which was also supported by PXRD analysis where the diffused spectra of S-SNEDDS indicated amorphization of the drug. Conclusively, the physical nature of LTD converted from its erstwhile crystalline state to the amorphous state may be stated when formulated in SNEDDS and S-SNEDDS.
 |
| Fig. 4 DSC thermograms of (A) loratadine (LTD); pure excipients (CMC8, SHS15); physical mixtures: PM1 (LTD + CMC8), PM2 (LTD + SHS15); co-melts: CM1 (LTD + CMC8), CM2 (LTD + SHS15) and (B) optimized formulation (OF); solidifying agents (A200, AR972) and S-SNEDDS (FFSA2, FFSAR). | |
3.3.4 Degradation studies (TGA-DTA). DSC in conjunction with DTA analysis provides a complete picture of endothermic and/or exothermic peak(s) since either alone does not provide conclusive results about the thermally induced incompatibilities.54 Additionally, a change in the thermal event is measured by the change in mass of the sample as a function of controlled temperature, obtained by TGA curves. The endothermic peak of LTD at 134.61 °C corresponding to the melting point of the drug in atmospheric nitrogen obtained from its DTA curve (Fig. 5A) was found to be in agreement with the DSC results. However, a broader endothermic peak of LTD observed at 305.73 °C (DTA/TGA curves) indicated the evaporation of the drug sample. The thermogravimetric analysis (TGA) confirmed the thermal stability of LTD up to 200 °C. However, a single stage thermal decomposition led to nearly 100% (98.55%) weight loss between 200 and 400 °C (LTD, Fig. 5B), consistent with the results reported by Ramos and Cavalheiro, 2007.55 The solidifying agents A200 and AR972 showed an absence of any endothermic and/or exothermic peaks in the DTA curves (Fig. 5A). A smooth decline in the TGA curves of the solidifying agents, A200 and AR972 was observed up to 600 °C with a total weight loss of 16.11% and 15.41% respectively (Fig. 5B). This insignificant loss of mass is probably the result of desorption/drying. The thermal analyses of solid-SNEDDS (FFSA2 and FFSAR) presented a multi-stage (two-stage) slow decomposition over the temperature range of 200–400 °C without formation of any intermediates, evident from the smooth decline of the curves. The first stage decomposition occurred in the range of 170–320 °C with weight loss of 22.23% in FFSA2 and 15.81% in FFSAR as evident from the TGA curves of S-SNEDDS (Fig. 5B). However, the second stage decomposition in the range of 320–405 °C showed a steeper decline in the TGA curves with a weight loss of 26.95% in FFSA2 and 20.62% in FFSAR (Fig. 5B). A relatively greater weight loss was observed with FFSA2 probably due to splitting off of silanol groups present on the surface of its hydrophilic carrier (A200) due to the thermal treatment. The DTA curves of FFSA2 and FFSAR presented in Fig. 5A showed an absence of any endothermic/exothermic peak in the region of melting point of the drug, thereby confirming the amorphous state of LTD when formulated in S-SNEDDS. The presumption of amorphization was well supported by the results of DSC and PXRD. However, a slight shift in the broader endothermic peak of LTD in FFSA2 (376.44 °C) and in FFSAR (372.80 °C) (Fig. 5B) clearly indicates that the evaporation of LTD was shifted to higher temperatures resulting in better thermal stability when formulated in S-SNEDDS. In conclusion, the thermoanalytical curves of S-SNEDDS and their components did not report the presence of any additional peak or drastic weight loss, thereby ruling out any sign of thermally induced incompatibilities over the temperature ranges mentioned.
 |
| Fig. 5 Thermoanalytical (A) DTA curves and (B) TGA curves of loratadine (LTD); Aerosil 200 (A200); Aerosil R972 (AR972) and S-SNEDDS (FFSA2, FFSAR). | |
3.4 Morphological characterization
3.4.1 Transmission electron microscopy (TEM). TEM images of S-SNEDDS (FFSA2, FFSAR) post aqueous dilution in Millipore water are shown in Fig. 6. It could be seen that spherical nanoemulsions were formed with no signs of coalescence. Furthermore, no signs of drug precipitation were observed implying the stability of formed nanoemulsions. A large proportion of the globules were found to be in the size range less than 50 nm in the S-SNEDDS prepared by both hydrophilic and hydrophobic carriers. However, the sizes of nanoemulsion globules of FFSAR (Fig. 6B) were observed to be slightly smaller than those of FFSA2 (Fig. 6A). Closer analysis of TEM image in Fig. 6C reveals that each globule is surrounded by a thick layer which can be hypothesized to be that of the surfactant (SHS15). This layer provides a mechanical barrier to prevent the coalescence of formed nanoemulsions and precipitation of drug, thereby providing stability to the dispersed system. This hypothesis was well established by us earlier.56 Moreover, the nanometric sizes of the nanoemulsion globules were consistent with the results obtained from DLS.
 |
| Fig. 6 Transmission Electron Microscopy (TEM) images of S-SNEDDS (A) FFSA2 and (B) FFSAR. (C) Displays a closer view of the nanoemulsion globules of FFSAR revealing the structural shape of globules. | |
3.4.2 Scanning electron microscopy (SEM). The surface morphology of the pure LTD appeared to be crystalline in nature, clearly visible at magnifications of ×2500 and ×5000 (Fig. 7A and B). The surface morphologies of solidifying agents viz. A200 and AR972 (×2500) appeared to be amorphous, smooth and porous surface (Fig. 7C and D). In contrast to the presence of mesopores on the surface of A200, the surface of formulation FFSA2 particles appear to be smooth due to the fact that the pores on the surface are completely filled with liquid SNEDDS (Fig. 7E). The formulations prepared from AR972 (FFSAR) appeared to have relatively rough surfaced particles as compared to that of FFSA2. This is perhaps due to the low specific area of AR972 where the pores are overfilled by the liquid lipid formulation and the liquid is adsorbed on the external surface of the particles. Such possibilities of adsorption of SNEDDS on the surface of adsorbents have been diagrammatically explained earlier by Agarwal et al., 2009.49 However, both S-SNEDDS (FFSA2 and FFSAR) appeared to have nearly spherical shapes, indicating that the liquid SNEDDS containing amorphous LTD are either adsorbed, coated on the surface or inside the pores of the adsorbent.11,57 Furthermore, the post-effect of drug release on surface morphology was observed in a manner established by us previously.11 The SEM images of FFSA2 and FFSAR before release and the dried residues of the same (FFSA2-D and FFSAR-D) obtained after drug release are displayed at ×5000 magnification in Fig. 7(G–J). The images revealed the existence of particles with numerous pores, undeniably different from any of the SEM images of LTD, A200, AR972, FFSA2 or FFSAR. A closer look into these pores (×5000) reveals the presence of larger pores on the dried residues of FFSA2 (FFSA2-D) in comparison to those of FFSAR-D, apparently due to larger porosity of A200. These images thus present a clear picture of the probable release of SNEDDS from these pores, which were initially adsorbed on these carriers. Moreover, the absence of crystalline LTD particles on the surface of S-SNEDDS supports the results of DSC and PXRD confirming the presence of an amorphous state of the drug as a dried emulsion on the surface of the solidifying agent. Furthermore, the unaltered performance characteristics of LTD in terms of non-recrystallization in S-SNEDDS, affirm the efficiency of the adopted solidification technique.
 |
| Fig. 7 Scanning Electron Microscopy (SEM) images: LTD at magnification of ×2500 (A) and at ×5000 (B); solidifying agents at ×2500 viz. A200 (C) and AR972 (D); solid-SNEDD formulations (×2500) viz. FFSA2 (E) and FFSAR (F); S-SNEDDS before release (×5000) (G) FFSA2, (H) FFSAR; S-SNEDDS after release (×5000) (I) FFSA2-D and (J) FFSAR-D. | |
3.5 Pharmacokinetic analysis
The pharmacokinetic analysis was performed by the validated LC-MS/MS method after oral administration of LTD loaded S-SNEDDS. The mean concentration–time profiles of the hydrophilic and hydrophobic S-SNEDDS i.e. FFSA2 and FFSAR are presented in Fig. 8. The PK parameters calculated by non-compartmental and compartmental analysis using PKPlus™ module of GastroPlus™ software are tabulated in Table 2. The compartmental analysis performed to obtain a visual representation of rate processes and micro-constants involved in drug disposition, showed the best-fit 2 compartment modelling for FFSA2 and FFSAR based on low AIC and SC values with high R2 values (Table 2). Significant differences in some PK parameters like MRT, T1/2 and CL were observed between different compartmental models since they possess central and multiple peripheral hypothetical compartments where the body is not considered homogenous and the distribution is not instantaneous. The non-compartmental analysis revealed that FFSA2 and FFSAR presented mean areas under the curve (AUC0–t) of 353.00 ± 0.01 ng h mL−1 and 425.00 ± 17.53 ng h mL−1, respectively, with the mean Cmax values of 141.45 ± 9.72 ng mL−1 and 185.99 ± 18.99 ng mL−1, respectively. The PK parameters of liquid LTD-SNEDDS and LTD-suspension established by us previously displayed an AUC0–t value of 633.00 ± 12.44 ng h mL−1 and 287.00 ± 9.11 ng h mL−1, respectively, with the mean Cmax values of 466.65 ± 18.94 ng mL−1 and 104.75 ± 2.87 ng mL−1, respectively (unpublished data). Thus, in the present work, the developed LTD loaded S-SNEDDS i.e. FFSA2 and FFSAR explicitly demonstrate a 1.23-fold and 1.48-fold enhancement of oral absorption, respectively, with a 1.35-fold and 1.78-fold increase in maximum drug concentration, as compared to the LTD suspension. However, the developed S-SNEDDS shows lower AUC0–t and Cmax values than the liquid SNEDDS. The outcomes of in vivo studies are consistent with the in vitro drug release studies where the order of LTD release and plasma drug concentration is FFSAR > FFSA2. Such in vivo and in vitro observations have also been reported earlier with exploration of SNEDDS potential.46,50 The low in vitro cumulative drug release and low in vivo plasma concentration of S-SNEDDS is likely caused by the incomplete desorption indicated by incomplete recovery of LTD in aqueous medium as compared to its liquid-SNEDDS form. The in vitro data suggesting reduced ability of FFSA2 compared to FFSAR to present LTD in the solubilized state (Table 1), were also reflected in the in vivo studies (Table 3). Lower values of AUC and Cmax were achieved when formulated using hydrophilic A200 (FFSA2) as compared to that formulated using hydrophobic AR972 (FFSAR). A plausible explanation for such an effect has been previously explained in the in vitro studies, where the presence of isolated silanol groups on the surface of A200 tends to form hydrogen bridge linkages, and/or low energy van der Waals and London forces which facilitate nucleation and entrapment of the drug in the intraparticular pores thereby delaying and/or reducing the extent of drug release and hence absorption. On the other hand, FFSAR does not contain isolated silanol groups and instead the largely non-reactive siloxane groups are present on the surface of AR972 which accounts for their hydrophobicity.48,49,51 It therefore shows lesser hindrance towards desorption and release of the drug as compared to its hydrophilic counterpart. Additionally, since one of the excipients of liquid SNEDDS i.e. SHS15 contains nearly 30% of polyethylene glycol, its adsorption on to the hydrophilic A200 to form FFSA2 would primarily take place via hydrogen bonds between isolated silanol groups and the ether oxygen atoms of the polyethylene glycol, which would ultimately facilitate nucleation and entrapment in the pores.48 However, the time taken to achieve maximum drug plasma concentration (Tmax) by both S-SNEDDS was 0.5 h. This clearly demonstrates the spontaneity of self-emulsification of the developed formulations despite lower drug release from the solidified SNEDDS. The bioavailability enhancement by LTD loaded S-SNEDDS compared to drug suspension is due to the specific combination of selected excipients being meticulously optimized through a design of experiment (DOE) approach. The optimized blend of CMC8 and SHS15, upon aqueous dilution, resulted in formation of nanosized globules due to a decrease in surface tension by SHS15 that undeniably favors faster emulsification. Also, CMC8 showing high lipid loading capacity and SHS15 causing disruption of intestinal lipid bilayers assist the enhancement of intestinal absorption. The nanosizing being facilitated by gastric motility results in increased surface area leading to increased contact of the nanosized globules with the apical membrane, thereby providing better access to biological membranes and transfer across the intestinal gut wall.57–59 The mechanism behind the improved drug absorption by these lipidic formulations is attributed to the transport of the drug via a lymphatic route, bypassing the P-gp mediated GI efflux cytochrome P450 mediated metabolism. The enhanced absorption is facilitated by the careful selection and combination of oil and surfactants which play vital roles as absorption enhancers and P-glycoprotein inhibitors. Thus, the use of porous carriers in development of solidified SNEDDS can be employed as a formulation alternative owing to the advantages they hold while preserving the physicochemical and biopharmaceutical integrity of liquid SNEDDS.
 |
| Fig. 8 Pharmacokinetic studies: plot of observed plasma concentration–time profile of hydrophilic S-SNEDDS (FFSA2) and hydrophobic S-SNEDDS (FFSAR) with clear depiction of the difference in profiles up to 4 h provided in the inset. | |
Table 2 Pharmacokinetic parameters obtained by non-compartmental and compartmental analysis of LTD loaded S-SNEDDS by PKPlus module of GastroPlus™ softwarea
Pharmacokinetic parameters |
FFSA2 |
FFSAR |
NC |
1 C |
2 C |
3 C |
NC |
1 C |
2 C |
3 C |
Values marked * represents ±SD; values in parentheses without * indicate % CV; NC = non-compartmental; 1 C = one-compartmental; 2 C = two-compartmental; 3 C = three-compartmental; AUC = area under curve; AUMC = area under moment curve; CL = clearance; AIC = Akaike information criterion; SC = Schwartz criterion. |
Cmax (ng mL−1) |
141.45 (9.72*) |
|
|
|
185.99 (18.99*) |
|
|
|
Tmax (h) |
0.5 (0.0*) |
|
|
|
0.5 (0.0*) |
|
|
|
AUC0–t (ng h mL−1) |
353.00 (0.01*) |
407.00 (99.00) |
— |
— |
425.00 (17.53*) |
513.00 (107.38) |
— |
— |
AUC0→∞ (ng h mL−1) |
407.00 (8.80*) |
— |
— |
— |
513.00 (24.45*) |
— |
— |
— |
AUMC (ng h2 mL−1) |
4013.00 (367.72*) |
3830.00 (99.00) |
— |
— |
6415.00 (356.57*) |
4984.00 (107.38) |
— |
— |
MRT (h) |
9.86 (0.81*) |
6.27 (84.84) |
— |
— |
12.5 (0.44*) |
6.01 (92.03) |
— |
— |
Kel (h−1) |
0.05 (0.02*) |
— |
— |
— |
0.036 (0.01*) |
— |
— |
— |
T1/2 (h) |
14.14 (1.33*) |
4.35 (84.84) |
7.57 (0.00) |
265.2 |
19.25 (0.42*) |
4.16 (92.03) |
8.164 (0.00) |
182.8 |
CL (L h−1) |
4.92 (0.61*) |
3.28 (51.02) |
5.13 (14.18) |
1.66 (64.62) |
3.51 (1.17*) |
2.17 (55.33) |
3.74 (17.81) |
1.57 (62.65) |
Vss (L) |
48.49 |
— |
— |
— |
43.82 |
— |
— |
— |
Vd (L) |
— |
20.55 (67.79) |
— |
— |
— |
13.03 (73.54) |
— |
— |
Vc (L) |
— |
— |
7.92 (123.77) |
6.15 (44.47) |
— |
— |
7.13 (43.7) |
6.68 (47.45) |
Ka (h−1) |
— |
1.96 × 10⁴ (0.00) |
2.76 (171.64) |
2.21 (48.29) |
— |
— |
7.58 (58.61) |
6.66 (60.42) |
K10 (h−1) |
— |
0.16 (84.84) |
0.65 (124.58) |
0.27 (78.44) |
— |
0.17 (92.03) |
0.52 (47.19) |
0.24 (78.59) |
K12 (h−1) |
— |
— |
0.73 (134.14) |
0.96 (62.4) |
— |
— |
0.46 (69.89) |
0.44 (86.92) |
K21 (h−1) |
— |
— |
0.21 (61.88) |
0.39 (57.32) |
— |
— |
0.17 (71.96) |
0.36 (111.41) |
K13 (h−1) |
— |
— |
— |
0.77 (58.18) |
— |
— |
— |
0.47 (70.02) |
K31 (h−1) |
— |
— |
— |
0.01 (37.53) |
— |
— |
— |
0.01 (51.5) |
R2 |
— |
0.582 |
0.985 |
0.985 |
— |
0.568 |
0.986 |
0.988 |
AIC |
— |
−9.863 |
−36.059 |
−38.442 |
— |
−8.069 |
−30.873 |
−29.297 |
SC |
— |
−8.669 |
−34.069 |
−35.657 |
— |
−6.876 |
−28.883 |
−26.512 |
Table 3 Observed and simulated pharmacokinetic parameters of LTD loaded S-SNEDDS obtained by in silico gastrointestinal compartmental simulation by GastroPlus™ softwarea
Parameter |
FFSA2 |
FFSAR |
Observed |
Simulated |
Fold error (FE) |
Observed |
Simulated |
Fold error (FE) |
AUC = area under curve; Fa = cumulative intestinal absorption; F = oral bioavailability. |
Cmax (ng mL−1) |
141.45 |
102.24 |
1.38 |
186.00 |
103.74 |
1.79 |
AUC0–t (ng h mL−1) |
353.1 |
584.78 |
1.66 |
424.52 |
584.88 |
1.38 |
AUC0–∞ (ng h mL−1) |
406.81 |
637.85 |
1.57 |
512.44 |
640.92 |
1.25 |
Fa (%) |
— |
100.2 |
— |
— |
100.00 |
— |
F (%) |
— |
100.04 |
— |
— |
93.18 |
— |
3.6 In silico assessment—GastroPlus™ simulation
The evaluation of the hydrophilic FFSA2 and hydrophobic FFSAR were further made by in silico prediction of their plasma concentration–time profile and simulation of the pharmacokinetic parameters. Such assessments were performed using the GastroPlus™ built-in compartmental PK model based on the ACAT model to predict the absorption profiles of the developed LTD loaded S-SNEDDS. The input parameters for in silico assessment like pKa (4.33) and solubility (4.59 mg mL−1, pH 1.2) were obtained from the literature22 while particle size (Table 1) and PK parameters (Table 2) were determined experimentally. The rest of the parameters like log
P (4.54), permeability (7.61 cm s−1 × 10⁻⁴), mean precipitation time (900 s), diffusion coefficient (0.65 cm2 s−1 × 10⁵) and drug particle density (1.2 g mL−1) were obtained from the ADMET Predictor™ module of the GastroPlus™ software. The simulated plasma concentration–time profiles of S-SNEDDS viz. FFSA2 and FFSAR are displayed in Fig. 9(A and B) and the observed and predicted PK parameters are tabulated in Table 3. The observed and simulated profiles were found to be non-superimposable but the prediction accuracy of PK parameters exhibited by fold error (FE) were found to be <2 signifying good prediction. Comparatively, the systemic availability of the drug was found to be better simulated by FFSAR than FFSA2.
 |
| Fig. 9 Experimental and simulated plasma concentration–time profiles of S-SNEDDS viz. (A) FFSA2 and (B) FFSAR obtained from GastroPlus™ software. | |
The regional absorption of LTD when formulated into S-SNEDDS (FFSA2, FFSAR) presented significantly higher absorption from upper small intestine. FFSA2 showed absorption of 86.6% and 13.5% from the duodenum and jejunum (1, 2), respectively, with FFSAR showing similar absorption of 86.5% and 13.5%, respectively. The regional absorption profiles of these solidified SNEDDS were found to be identical to the liquid SNEDDS (duodenum, 86.5% and jejunum, 13.5%), but considerably higher absorption from the upper GIT when compared to LTD suspension (duodenum, 9.6% and jejunum, 35.3%) (unpublished data). The similarity in regional absorption between liquid and solid SNEDDS is plausibly the result of lipidic nanoemulsion being ultimately absorbed and the underlying mechanism involved in absorption through various compartments of the GIT. The majority of LTD absorption from S-SNEDDS taking place from the duodenum is the outcome of faster dissolution of developed S-SNEDDS, as also established by Wu et al., 2015.60 The lipidic nanoemulsion is exposed to local secretions of bile salts and pancreatic juice in the duodenum, thereby facilitating lipid digestion and hence absorption. LTD is known to be a substrate of P-gp which is co-localized and works in tandem with CYP3A4, the enzyme mostly responsible for extensive pre-systemic metabolism of the drug. Since high levels of CYP3A levels are reported to be present in duodenal tissue, an increased hindrance towards absorption from conventional dosage forms are expected in such areas. However, interestingly S-SNEDDS have shown maximum absorption through the duodenum, clearly indicating inhibition of the metabolism–efflux interplay and thus favouring systemic absorption.
3.7 In vitro–in vivo correlation (IVIVC)
IVIVC was established to obtain the relationship between the in vitro dissolution and the in vivo input rate, described by a mathematical model. The predictability of the IVIVC model was evaluated by internal validation where PK parameters (Cmax and AUC0–t) were predicted using the in vitro dissolution data based on the correlation model. Deconvolution, which is basically a calculation of cumulative in vivo absorption rate from plasma concentration–time data, was performed by various deconvolution models for both FFSA2 and FFSAR formulations (Table 4). The Loo–Riegelman method (2-compartment) and the 3rd order polynomial function were the best fit deconvolution model and the best fit correlation function, respectively, obtained for both FFSA2 and FFSAR formulations. The best fit models were selected on the basis of high R2 value and low values of Standard Error of Prediction (SEP), Mean Absolute Error (MAE), and Akaike Information Criterion (AIC). The plots of fraction of absolute bioavailability versus fraction of in vitro release, obtained after deconvolution, are displayed in the insets of Fig. 10(A) for FFSA2 and Fig. 10(B) for FFSAR. A non-zero y-intercept may represent a lag-time in the systemic absorption. Although the data do not present a linear relationship, a non-linear function with higher order polynomial equations may be used to describe the data with curvature as also observed by others.61–63 Thereafter, following convolution in the convolution tab, the observed and predicted plasma concentration–time profiles using the best correlation function were generated for FFSA2 and FFSAR, as depicted in Fig. 10(A and B). The observed and predicted plots were found to be overlapping indicating a good relationship. A higher degree of overlapping, as indicated by high R2, was observed for the hydrophobic FFSAR (0.936) as compared to the hydrophilic FFSA2 (0.910). However, since the immediate-release formulations do not provide longer time-frames to characterize the dissolution or absorption profile, perfect correlation may not be observed.63 Nevertheless, it still may provide an in vitro profile as a surrogate for in vivo bioavailability.
Table 4 Best-fit correlation function, its validation statistics and statistics of reconstructed predicted plasma concentration–time profile of LTD loaded S-SNEDDS (FFSA2 and FFSAR) by various deconvolution modelsa
Methods |
Corr. function |
Validation statistics |
Statistics for reconstructed Cp–time profile |
Cmax (ng mL−1) |
AUC0–t (ng h mL−1) |
R2 |
SEP |
MAE |
AIC |
Obs. |
Pred. |
% error |
Obs. |
Pred. |
% error |
AUC = area under curve; SEP = standard error of prediction; MAE = mean absolute error; AIC = akaike information criterion. |
S-SNEDDS (FFSA2) |
GastroPlus mechanistic absorption model |
Power |
141.50 |
102.1 |
27.81 |
345.50 |
583.50 |
−68.90 |
0.356 |
42.97 |
30.40 |
111.10 |
Numerical deconvolution |
Power |
141.00 |
60.00 |
57.45 |
345.00 |
229.00 |
33.62 |
0.271 |
46.28 |
28.12 |
112.70 |
Loo–Riegelman method (2-compartment) |
3rd order polynomial |
141.00 |
105.00 |
25.53 |
345.00 |
357.00 |
−3.478 |
0.910 |
12.07 |
5.245 |
83.17 |
![[thin space (1/6-em)]](https://www.rsc.org/images/entities/char_2009.gif) |
S-SNEDDS (FFSAR) |
GastroPlus mechanistic absorption model |
Power |
186.00 |
105.00 |
43.53 |
420.80 |
585.60 |
−39.17 |
0.220 |
68.24 |
41.53 |
121.3 |
Numerical deconvolution |
2nd order polynomial |
186.00 |
84.00 |
54.84 |
421.00 |
158.00 |
62.47 |
0.455 |
46.83 |
28.60 |
113.00 |
Loo–Riegelman method (2-compartment) |
3rd order polynomial |
186.00 |
155.00 |
16.67 |
421.00 |
440.00 |
−4.513 |
0.936 |
14.45 |
8.799 |
87.12 |
 |
| Fig. 10 In vitro–in vivo correlation of LTD S-SNEDDS (A) FFSA2 and (B) FFSAR: plots of observed and simulated plasma concentration–time profile using dissolution data. Inset: fraction of in vivo drug release and in vitro drug release. | |
4. Conclusion
Loratadine (LTD) loaded S-SNEDDS was successfully developed employing hydrophilic and hydrophobic solidifying carriers. The hydrophilic S-SNEDDS (FFSA2) showed excellent and better flowability as compared to the good and passable flowability attained by FFSAR, and also displayed formation of harder compacts revealed by the texture analyzer. An insight into the likely behaviour of these S-SNEDDS upon compaction was also made to investigate their tableting potential. Both the S-SNEDDS displayed the reconstitution ability to form stable nanoemulsions, evident from the results of percent transmittance, DLS and zeta potential. Though the S-SNEDDS formulated by hydrophilic and hydrophobic Aerosil® resulted in similar drug-release profiles (apparent from acceptable similarity factors), the hydrophobic FFSAR displayed faster release, marked by Qt(15) probably due to the fact that such carriers have a low specific surface area which improves the dissolution rate as compared to the carriers with high specific surface area. The estimation of contact angle and the drainage time taken by the dry and pre-wetted S-SNEDDS may be advantageous during lubrication and tableting. The S-SNEDDS attained sufficient wettability manifested by contact angles lower than 90°, which disregard the use of additional organic solvent to impregnate the solid carrier with the liquid formulation. The solid-state properties of S-SNEDDS characterized by FTIR, PXRD, DSC and TGA-DTA revealed compatibility between the drug and excipients and also confirmed the presence of the drug in its solubilized and amorphous state. TEM images confirmed the non-aggregated spherical shape of nanoemulsion globules of S-SNEDDS with size range concordant with the globule sizes analyzed by DLS (less than 50 nm). Also, it displayed the interfacial presence of surfactant over the nanoemulsion globules of redispersed S-SNEDDS. The surface morphology of LTD, A200, AR972 and S-SNEDDS (FFSA2, FFSAR) indicated that the SNEDDS containing LTD in amorphous form was adsorbed on the pores of adsorbent. FFSAR displayed slightly rough-surfaced particles as compared to its smoother counterpart (FFSA2) indicating the surface adsorption of SNEDDS apart from being filled into the pores. The post-effect of drug release disclosed the presence of numerous pores on the surfaces of dried residues of S-SNEDDS, giving a clear picture of the release of the previously adsorbed liquid SNEDDS from these pores. The in vitro data suggesting a reduced ability of FFSA2 compared to FFSAR was also reflected by the in vivo studies, affirming the facilitated nucleation and entrapment of the drug in the intraparticular pores of FFSA2. The in vivo studies on rats demonstrated the high potential of the developed S-SNEDDS viz. FFSA2 and FFSAR to enhance systemic absorption. Additionally, when the plasma-concentration profiles were simulated by the GastroPlus™ simulation software, it revealed good prediction accuracy with fold error < 2. Remarkably high absorption of S-SNEDDS from the upper small intestine warranted the inhibition of intestinal metabolism and drug efflux. The IVIVC™ module of the software exposed good correlation by the best-fit correlation function obtained upon deconvolution. The observed and the reconstructed plasma concentration profiles were found to be superimposable on to each other. The study presented here thus supports the promising development of solidified lipid based SNEDDS, while retaining the physicochemical and biopharmaceutical features of SNEDDS in order to explore their potential as viable dosage forms to facilitate oral absorption of poorly soluble drugs.
Declaration of interest
The authors report no conflicts of interest. The authors alone are responsible for the content and writing of this article.
Acknowledgements
The authors thank the Vice-Chancellor, Birla Institute of Technology for providing the facilities. One of the authors (Samridhi) acknowledges the Department of Science and Technology, Government of India for financial support as INSPIRE-JRF (IF120784) (Ref. No. DST/INSPIRE fellowship/2012 dated 25 February 2013). The authors are thankful to Sun Pharmaceuticals Pvt. Ltd, Clinical Pharmacology and Pharmacokinetics, Gurgaon, India for providing the necessary facilities with sincere gratitude to Dr Tausif Monif, Vice President and his research team. The authors acknowledge SICART-CVM, Vallabh Vidyanagar, Gujarat, India and SAIF KOCHI, Cochin, India for extending the necessary facilities required for the present work. The constructive comments and suggestions of the anonymous reviewers are deeply acknowledged.
References
- P. Fasinu, V. Pillay, V. M. Ndesendo, L. C. DuToit and Y. E. Choonara, Biopharm. Drug Dispos., 2011, 32, 185–209 CrossRef CAS PubMed.
- H. Mu, R. Holm and A. Mullertz, Int. J. Pharm., 2013, 453, 215–224 CrossRef CAS PubMed.
- C. W. Pouton, Eur. J. Pharm. Sci., 2000, 11, S93–S98 CrossRef CAS PubMed.
- C. M. O. Driscoll, Eur. J. Pharm. Sci., 2002, 15, 405–415 CrossRef.
- S. D. Maio and R. L. Carrier, J. Controlled Release, 2011, 151, 110–122 CrossRef PubMed.
- X. Q. Chen, O. S. Gudmundsson and M. J. Hageman, J. Med. Chem., 2012, 55, 7945–7956 CrossRef CAS PubMed.
- C. J. H. Porter, C. W. Pouton, J. F. Cuine and W. N. Charman, Adv. Drug Delivery Rev., 2008, 60, 673–691 CrossRef CAS PubMed.
- D. Sakloetsakun, S. Dunnhaupt, J. Barthelmes, G. Perera and A. B. Schnurch, Int. J. Biol. Macromol., 2013, 61, 363–372 CrossRef CAS PubMed.
- D. J. Hauss, Adv. Drug Delivery Rev., 2007, 59, 667–676 CrossRef CAS PubMed.
- R. N. Gursoy and S. Benita, Biomed. Pharmacother., 2004, 58, 173–182 CrossRef PubMed.
- S. Verma, S. K. Singh, P. R. P. Verma and M. N. Ahsan, Drug Dev. Ind. Pharm., 2014, 40, 1358–1370 CrossRef CAS PubMed.
- S. Chakraborty, D. Shukla, B. Mishra and S. Singh, Eur. J. Pharm. Biopharm., 2009, 73, 1–15 CrossRef CAS PubMed.
- T. Gershanik and S. Benita, Eur. J. Pharm. Biopharm., 2000, 50, 179–188 CrossRef CAS PubMed.
- K. Kohli, S. Chopra, D. Dhar, S. Arora and R. K. Khar, Drug Discovery Today, 2010, 15, 958–965 CrossRef CAS PubMed.
- S. Beg, S. S. Jena, C. N. Patra, M. Rizwan, S. Swain, J. Sruti, M. E. B. Rao and B. Singh, Colloids Surf., B, 2013, 101, 414–423 CrossRef CAS PubMed.
- B. Tang, G. Cheng, J. Gu and J. Xu, Drug Discovery Today, 2008, 13, 606–612 CrossRef CAS PubMed.
- Therapeutic drugs, ed. C. Dollery, Churchill Livingstone, Edinburgh, 2nd edn, 1999, vol. 2, pp. L96–L97 Search PubMed.
- United States Pharmacopoeia-National Formulary, The official compendia of standards, USP-NF, Rockville, MD, 2008, pp. 2547–2549 Search PubMed.
- E. Hadzijusufovic, P. Barbara and V. K. Gleixner, et al., Exp. Hematol., 2010, 38, 896–907 CrossRef CAS PubMed.
- M. V. Soldovieri, F. Miceli and M. Taglialatela, Chem. Res. Toxicol., 2008, 21, 997–1004 CrossRef CAS PubMed.
- S. Verma, S. K. Singh and P. R. P. Verma, Drug Dev. Ind. Pharm., 2015 DOI:10.3109/03639045.2015.1052078.
- http://www.drugbank.ca/drugs/db00455; assessed on 05-10-2015.
- G. Bruni, L. Amici, V. Berbenni, A. Marini and A. Orlandi, J. Therm. Anal. Calorim., 2002, 68, 561–573 CrossRef CAS.
- F. Frizon, J. O. Eloy and C. M. Donaduzzi, Powder Technol., 2013, 235, 532–539 CrossRef CAS.
- S. Bandari, S. Jadav, B. B. Eedara, R. Dhurke and R. Jukanti, Journal of Pharmaceutical Innovation, 2014, 9, 141–149 CrossRef.
- R. M. P. Singh, A. Kumar and K. Pathak, AAPS PharmSciTech, 2013, 14, 412–424 CrossRef CAS PubMed.
- A. Nasca, O. Berkesi, P. Szabo-Revesz and A. Aigner, J. Inclusion Phenom. Macrocyclic Chem., 2009, 64, 249–254 CrossRef.
- A. Nacsa, R. Ambrus, O. Berkesi, P. Szabo-Revesz, Z. Aigner, Á. Nacsa, R. Ambrus, O. Berkesi, P. Szabó-Révész and Z. Aigner, J. Pharm. Biomed. Anal., 2008, 48, 1020–1023 CrossRef CAS PubMed.
- M. El-Hammadi and N. Awad, AAPS PharmSciTech, 2012, 13, 53–58 CrossRef CAS PubMed.
- F. Zeeshan and N. I. Bukhari, AAPS PharmSciTech, 2010, 11, 910–916 CrossRef CAS PubMed.
- P. Patil and A. Paradkar, AAPS PharmSciTech, 2006, 7, E1–E7 CrossRef PubMed.
- C. Li, M. Y. Lee and J. S. Choi, Pharmazie, 2010, 65, 510–514 CAS.
- C. Li, M. Kim and J. S. Choi, Arch. Pharmacal Res., 2010, 33, 1395–1400 CrossRef CAS PubMed.
- Pharmaceutics: The Science of Dosage Form Design, ed. M. E. Aulton and T. I. Wells, Churchill Livingston, London, 2nd edn, 2002 Search PubMed.
- A. Martin, P. Bustamante and A. H. C. Chun, Physical Pharmacy, B.I. Waverly Pvt Ltd, New Delhi, 4th edn Indian rep., 1994, p. 457 Search PubMed.
- X. Qi, J. Qin, N. Ma, X. Chou and Z. Wu, Int. J. Pharm., 2014, 472, 40–47 CrossRef CAS PubMed.
- S. Verma and S. K. Singh, Res. J. Pharm. Technol., 2015, 8, 452–461 CrossRef.
- National Research Council, Guide for care and use of laboratory animals, The National Academic Press, Washington, DC, 8th edn, 2011 Search PubMed.
- G. Sharma, S. Beg, K. Thanki, O. P. Katare, S. Jain, K. Kohli and B. Singh, RSC Adv., 2015, 5, 71500–71513 RSC.
- S. Grbic, J. Parojcic, S. Ibric and Z. Djuric, AAPS PharmSciTech, 2011, 12, 165–171 CrossRef CAS PubMed.
- GastroPlus™, Simulation software for drug discovery and development, Version 9.0, Simulations Plus Inc., Lancaster, CA, USA, 2015 Search PubMed.
- F. Sun, L. Lee, Z. Zhang, X. Wang, Q. Yu, X. Q. Duan and E. Chan, Eur. J. Pharm. Sci., 2015, 77, 290–302 CrossRef CAS PubMed.
- Evonik technical data sheet-a; https://www.aerosil.com/www2/uploads/productfinder/AEROSIL-200-EN.pdf.
- Evonik technical data sheet-b; https://www.aerosil.com/www2/uploads/productfinder/AEROSIL-R-972-Pharma-EN.pdf.
- Remington: The science and practice of pharmacy, ed. A. R. Gennaro, Lippincott Williams and Wilkins, 20th edn, 2000, vol. 1, p. 691 Search PubMed.
- M. V. Speybroeck, H. D. Williams, T. H. Nguyen, M. U. Anby, C. J. H. Porter and P. Augustijns, Mol. Pharmaceutics, 2012, 9, 2750–2760 CrossRef PubMed.
- A. Krupa, J. Szlek, B. R. Jany and R. Jachowicz, AAPS PharmSciTech, 2014, 16, 623–635 CrossRef PubMed.
- Basic characteristics of Aerosil® fumed silica, Technical bulletin fine particles 11, http://www.aerosil.com/sites/lists/IM/Documents/TB-11-Basic-Characteristics-of-AEROSIL-Fumed-Silica-EN.pdf.
- V. Agarwal, A. Siddiqui, H. Ali and S. Nazzal, Int. J. Pharm., 2009, 366, 44–52 CrossRef CAS PubMed.
- A. Tan, S. Rao and C. A. Prestidge, Pharm. Res., 2013, 30, 2993–3017 CrossRef CAS PubMed.
- M. K. Gupta, Y. C. Tseng, D. Goldman and R. H. Bogner, Pharm. Res., 2002, 19, 1663–1672 CrossRef CAS.
- Y. Yuan and T. R. Lee, Science Technologies, Chapter- Contact angle and wetting properties, ed. G. Bracco and B. Holst, Springer-Verlag, Berlin, Heidelberg, 1st edn, 2013, vol. 51, p. 15, http://www.springer.com/978-3-642-34242-4 Search PubMed.
- R. M. P. Singh, A. Kumar and K. Pathak, AAPS PharmSciTech, 2013, 14, 412–424 CrossRef CAS PubMed.
- E. P. Lavor, M. V. M. Navarro, F. D. Freire, C. F. S. Aragão, F. N. Raffin, E. G. Barbosa and T. F. A. de Lima e Moura, J. Therm. Anal. Calorim., 2014, 115, 2303 CrossRef CAS.
- L. A. Ramos and É. T. G. Cavalheiro, J. Therm. Anal. Calorim., 2007, 87, 831–834 CrossRef CAS.
- S. K. Singh, P. R. P. Verma and B. Razdan, Pharm. Dev. Technol., 2010, 15, 469–483 CrossRef CAS PubMed.
- P. Balakrishnan, B. J. Lee, D. H. Oh, J. O. Kim, M. J. Hong, J. P. Jee, J. A. Kim, B. K. Yoo, J. S. Woo, C. S. Yong and H. G. Choi, Eur. J. Pharm. Biopharm., 2009, 72, 539–545 CrossRef CAS PubMed.
- S. Beg, S. Swain, H. P. Singh, C. N. Patra and M. E. B. Rao, AAPS PharmSciTech, 2012, 13, 1416–1427 CrossRef CAS PubMed.
- N. Sermkaew, W. Ketjinda, P. Boonme, N. Padoongsombat and R. Wiwattanapatapee, Eur. J. Pharm. Sci., 2013, 50, 459–466 CrossRef CAS PubMed.
- C. Wu, L. Kou, P. Ma, L. Gao, B. Li, R. Li, C. Luo, J. Shentu, Z. He and J. Sun, RSC Adv., 2015, 5, 19844 RSC.
- T. D. S. Honorio, E. C. Pinto, H. V. A. Rocha, V. S. A. D. Esteves, T. C. dos Santos, H. C. R. Castro, C. R. Rodrigues, V. P. de Sousa and L. M. Cabral, AAPS PharmSciTech, 2013, 14, 1244–1253 CrossRef CAS PubMed.
- E. Jantratid, S. Prakongpan, G. L. Amidon and J. B. Dressman, Clin. Pharmacokinet., 2006, 45, 385–399 CrossRef CAS PubMed.
- D. Young, J. G. Devane and J. Butler, In vitro–in vivo correlations, Plenum Press, New York, 1997 Search PubMed.
Footnote |
† Electronic supplementary information (ESI) available. See DOI: 10.1039/c5ra21796b |
|
This journal is © The Royal Society of Chemistry 2016 |
Click here to see how this site uses Cookies. View our privacy policy here.