DOI:
10.1039/C5RA21634F
(Paper)
RSC Adv., 2016,
6, 11099-11108
2,3,4-Trihydroxy benzophenone as a novel reducing agent for one-step synthesis of size-optimized gold nanoparticles and their application in colorimetric sensing of adenine at nanomolar concentration†
Received
16th October 2015
, Accepted 18th January 2016
First published on 21st January 2016
Abstract
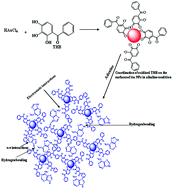
In this work, we report the use of 2,3,4-trihydroxy benzophenone (THB) as a novel reducing and stabilizing agent for the one-step synthesis of size-optimized gold nanoparticles (Au NPs). We have optimized various parameters such as reducing agent concentration, time and temperature for the controlling of Au NPs size and surface plasmon resonance (SPR) peak. The size and morphology of THB-Au NPs were confirmed by transmission electron microscopy (TEM) and dynamic light scattering (DLS) techniques. The average hydrodynamic diameter of THB-Au NPs was found to be ∼12 nm. The absorption ratio at A658/A525 for THB-Au NPs could be correlated quantitatively with the concentrations of adenine in the range of 0.005–100 μM. The detection limit of adenine was estimated to be as low as 1.4 nM based on the absorbance measurements of THB induced aggregated Au NPs at 658 nm. In addition, this probe was successfully applied to detect adenine in biological samples such as urine and serum samples with reduced sample volumes.
1. Introduction
Adenine is an important component that has shown enormous biological significance in synthesizing various biomolecules including proteins, adenosine triphosphate (ATP), nicotinamide adenosine dinucleotide (NAD), and flavin adenosine dinucleotide (FAD). Among the purine nucleobases, adenine plays key roles in biochemistry including cellular respiration, in the form of the energy-rich adenosine triphosphate and protein synethesis.1 It stabilizes the deoxyribo nucleic acid and ribo nucleic acid molecules by forming hydrogen-bonding with thymine and uracil. Furthermore, adenine nucleotides play essential roles in cerebral blood flow control, with some comparisons to coronary blood flow.2 Importantly, it was noticed that any erratic change in concentration of adenine can cause defect in structure of nucleic acids, which may lead to genetic mutation, and causes various diseases.3 Because adenine containing nucleoside (adenosine) modulates several physiological effects by stimulating specific cell surface receptors.4 It was noticed that the extracellular concentration of adenosine was estimated in between 10−8 to 10−9 mol L−1 (ref. 5) and the intracellular free adenosine and adenine concentrations were found to be 10−8 and 10−6 mol L−1.6,7 Therefore, adenine is one of the most essential biological molecule that needs to be quantified at trace level intended for research in fields of medicine and biochemistry.
The quantitative analysis of the purine bases is important in the investigation of their roles and functions in various cellular systems. In this connection, various analytical tools such as cyclic voltammetry, differential pulse voltammetry, laser induced fluorescence, high-performance liquid chromatography (HPLC), liquid chromatography-mass spectrometric (LC-MS) techniques for the analysis of adenine in various biological samples. Ensafi's group developed voltammetric method for the quantification of adenine in single strand DNA.8 Goyal et al. illustrated the use of single-walled carbon nanotube modified edge plane pyrolytic graphite electrode in voltammetric method for identification of adenine.9 Li and co-workers demonstrated the use of modified electrode in voltammetric method for the quantification of adenine in calf thymus DNA.10 The Ag NPs were functionalized with polydopamine and graphene nanocomposites and used as an electrochemical sensor for the detection of adenine.11 Wang's group developed HPLC method with fluorescence detector for the detection of adenine.12 Furthermore, Shi's and Hines's groups developed LC-MS methods independently for the quantification and identification of adenine in synthetic RNA substrate by ricin A chain.13,14 Al though these techniques are typically used for the analysis of adenine, these are plagued by interferences and required tedious steps for preparation of electrodes and the sensitivity is limited to the micromolar to nanomolar range. Therefore, the development of novel specific techniques is essentially required for the trace identification of adenine in various biological samples with reduced sample preparations at minimal volume of samples.
Recent years, metallic NPs-based colorimetric sensors are very promising due to their simplicity, sensitivity, rapidity and cost effectiveness. The concentration of target analytes can be easily monitored with the naked eye or by using a UV-visible spectrophotometer at minimal volume of samples, without needing any complicated sample preparations or instruments.15 In particular, colorimetric sensors of metal (Au and Ag NPs) have attracted extensive attention in sensing of wide variety chemical and biochemical species due to their size- and shape-dependent optical properties and large absorption coefficients.16 Among them, Au NPs are increasingly used as colorimetric probes for a wide spectrum of analytical applications in biological and biomedical fields.17 These Au NPs integrated analytical approaches have exhibited excellent selectivity and high sensitivities due to the strong SPR those driven by the various analytes-NPs interactions including electrostatic, hydrogen bonding as well as donor–acceptor chemical reactions.18 As a result, various Au NPs formulations have been fabricated for targeting biological targets, such as RNA, cells, DNA, inorganic species, drugs, organic compounds and proteins, respectively.17 The colorimetric sensing ability of Au NPs is strongly influenced by the size and surface chemistry of Au NPs. In order to make them as target specific, various organic molecules including carboxymethyl cellulose,19 ssDNA,20 p-sulfonatocalix[4]arene thiol,21 Tween-20,22 4-aminoantipyrine,23 quercetin,24 dithiocarbamate derivatives,25,26 dicoumarol27 and 4-amino nicotinic acid28 have been used as reducing and capping agents for the synthesis of Au NPs with controlled size and their potential applications in colorimetric sensing of wide variety analytes with high selectivity and sensitivity. Inspired by the above reports that Au NPs could be stabilized by various organic ligands and shown ability to interact ultra-trace analytes with high selectivity via electrostatic, covalent and non-covalent interactions.
In this work, we demonstrated a simple, selective and sensitive colorimetric detection of adenine using THB-Au NPs as a probe. The THB acts as a reducing and capping agent for the synthesis and functionalization of Au NPs. The method does not need any chemical modification and complicated operations for synthesis of size-optimized Au NPs, and it possesses good selectivity and sensitivity. The THB-Au NPs are prone to aggregate in the presence of adenine because electrostatic interactions and hydrogen bonding between THB-Au NPs and adenine (Scheme 1). We find that adenine induces the aggregation of THB-Au NPs, observing a color change from red to blue, which results a red-shift in the SPR band from 525 to 658 nm. This probe was successfully applied to detect adenine in plasma and urine samples.
 |
| Scheme 1 Schematic representation for the preparation of THB-Au NPs using THB as a reducing and capping agent and their applications for colorimetric sensing of adenine via the aggregation of THB-Au NPs induced by adenine through electrostatic interactions and hydrogen bonding. | |
2. Experiments
2.1. Chemicals and reagents
All reagents used were of analytical grade and were used without any further purification. Chloroauric acid (HAuCl4·xH2O), HCl, tris(hydroxymethyl) aminomethane (Tris buffer), phosphate buffered saline (PBS), 2,3,4-trihydroxy benzophenone were purchased from Sigma Aldrich, (St. Louis, MO). Ammonium acetate was procured from Labort Ltd., India. Milli-Q-pure water was used throughout all the experiments. All solutions were used freshly prepared. Urine samples were collected from healthy volunteers and the serum sample from Iyer's pathological laboratories, Surat, Gujarat, India.
2.2. Instrumentation
UV-visible spectra were measured by using Maya Pro 2000 spectrophotometer (Ocean Optics, USA) at room temperature. TEM images of Au NPs were taken using Tecnai 20 (Philips, Holland) at an acceleration voltage of 100 kV. DLS measurements were performed by using Zetasizer Nano ZS90 (Malvern, UK). Elemental analysis was done by SEM/EDX analysis using Scanning Electron Microscope, Hitachi S-3400N.
2.3. Synthesis of Au NPs using THB as a reagent
The ∼12 ± 3.95 nm Au NPs were prepared using THB as a reducing and capping agent. To this, 5.75 mg of THB was dissolved in 100 μL of 1.0 mM NaOH, and then 9.9 mL of deionized water is added. The solution was vortexed for 2.0 min and 9.0 mL of 1.0 mM HAuCl4 was taken into a 50 mL round-bottom flask. To this, 1.0 mL of THB was added in single purge under constant stirring and the resulting solution was continuously stirred for 30 min until a cherry red solution was obtained. The solution was cooled to room temperature and then filtrated through a filter membrane (0.45 μm) to remove the precipitate, and the filtrate was stored in a refrigerator at 4 °C for use. The THB-Au NPs show the characteristic SPR peak at ∼525 nm. The size and morphology of THB-Au NPs were studied using DLS and TEM.
2.4. Detection of adenine by THB-Au NPs as a colorimetric probe
For colorimetric detection of adenine, the solutions of adenine with different concentrations (0.001 to 100 μM) were prepared by diluting fresh standard solutions with deionized water. From these, 100 μL of adenine each concentration was added separately into 1.0 mL of THB-Au NPs. The color changes were photographed with a digital camera and recorded by the UV-visible absorption spectroscopy. The sensor responses (A658/A525) were calculated by dividing the absorption of the THB-Au NP suspension at 658 nm by that at 525 nm. The DLS and TEM were used to measure the hydrodynamic diameters and morphological changes of THB-Au NPs in the presence of adenine.
2.5. Analysis of adenine in biological fluids
To explore the potential application of THB-Au NPs as a probe, we applied this method for the identification of adenine in serum and urine samples. Serum samples were collected from Iyer's pathological laboratories, Surat, Gujarat, India. Similarly, urine samples were collected from healthy volunteers (age range 24–28 years), not involved in any strenuous activity, and not taking any other medication. The collected samples were diluted 50-folds using distilled water. Then, the above samples were spiked with different concentrations of adenine (10, 50 and 100 μM) and then concentration of adenine was estimated by the aforesaid procedure.
3. Results and discussion
The formation of Au NPs with controlled size using THB as a novel reagent display several levels of complexity, implying that the experimental conditions must be very carefully studied for the synthesis of Au NPs with controlled size and SPR peak. Therefore, we studied the effect of THB concentration, temperature and time for the synthesis of size-optimized Au NPs.
3.1. Effect of THB concentration
In order to control the size, color and SPR band, we studied the influence of THB reagent concentrations (0.5–3.0 mM) for the reduction of 1.0 mM HAuCl4. To this, different concentrations of THB ranging from 0.5 to 3.0 mM were added separately to aqueous chloroauric acid solutions (9.0 mL, 1.0 mM), followed by continuously stirring for 30 min to get cherry red color. The optical photos of the obtained samples, as well as the corresponding UV-visible spectra, are shown in Fig. 1a. It can be observed that the color and the SPR peaks of Au NPs at different concentrations of THB show obvious differences, indicating that the color, the SPR peak and size remarkably vary with the THB concentration. Importantly, the color, SPR peak and large size distribution of Au NPs at high THB reagent concentration will limit further applications such as size-related bioassays and well-defined nanoassembly. Based on the color and the SPR peak, we selected 2.0 mM of THB as an optimum concentration for the synthesis of size-optimized Au NPs with well-defined THB molecular assembly.
 |
| Fig. 1 (a) UV-visible absorption spectra of Au NPs using THB as a reducing and capping agent at different concentrations 0.5–3.0 mM. (b) UV-visible absorption spectra of Au NPs using THB as a reagent (2.0 mM) at different reaction temperatures from 0 °C to 100 °C. Inset image is the corresponding THB-Au NPs solutions. | |
3.2. Effect of temperature
The synthesis of Au NPs was carried out at different temperatures using 1.0 mM of HAuCl4 and 2.0 mM of THB as a reactant and reagent, and their formation was studied by UV-visible spectroscopy. Briefly, 9.0 mL of HAuCl4 solutions were taken separately into reaction flasks and stirred for 20 min at different temperatures ranging from 0 to 100 °C. To these flasks, 1.0 mL of 2.0 mM THB solution was added to the above solutions under constant stirring. As shown in Fig. 1b, the SPR peak of THB-Au NPs was observed with broaden shape and low color intensity at 0 °C, indicating the incomplete reduction of Au3+ ion whereas reaction temperature at 50, 75 and 100 °C, the SPR peak was slightly moved towards longer wavelength and the color was also not in cherry red. The results were correlated either to the increasing number of Au NPs or to the increasing size of Au NPs. However, the color intensity and the SPR peak with high intensity at 525 nm were observed at 25 °C, indicating that the complete reduction of Au3+ ion to Au0 NPs with THB molecular assembly. Furthermore, the increase of the SPR intensity should be directly connected to the formation of Au NPs. Based on the above result, we selected 25 °C as the best temperature for the preparation of Au NPs using THB as a reagent.
3.3. Effect of time
Time is also the influencing parameter for synthesis of size-optimized Au NPs using THB as a reagent. The as-synthesized Au NPs were characterized by UV-visible absorption spectroscopy as a function of time (0 to 30 min) to understand the formation of size-optimized Au NPs using 1.0 mM of HAuCl4 (9.0 mL) as a reactant and 2.0 mM of THB (1.0 mL) as a reagent. As shown in ESI of Fig. S1,† the color and the SPR peak at 525 nm do not show any obvious changes with increasing time. However, the absorption spectra clearly showed a well-defined surface plasmon at 525 nm, which is in very good agreement with the reported SPR band of Au NPs using various organic molecules as reagents.24,27,29 The reduction of precursor salt starts at 0 min and was completed at 20 min, this reaction can be visually assessed by turning from a light yellow color (the initial color of HAuCl4 solution) to a light red and then dark red color, indicating that the formation of Au NPs. Based on the above results, we chosen 20 min as an optimum reaction time for the synthesis of size-optimized Au NPs.
3.4. Characterization of THB-Au NPs
To confirm the role of phenolic groups (–OH) of THB for reduction of Au3+ to Au0 NPs, we studied the FT-IR spectra of pure THB and THB-Au NPs (ESI of Fig. S2†). The FT-IR spectrum of THB exhibited absorption band at 3065 for sp3 C–H stretches. The aromatic C
C stretching of benzene moiety was appeared in the region of 1567–1621 cm−1 in the THB and THB-Au NPs. The broad bands in the range 3312–3496 cm−1 correspond to –OH stretching. The –OH group originates from the phenolic hydroxyl groups of THB. These bands would have been largely due to the presence of hydroxyl groups. The strong band of –C
O around 1629 cm−1 and weak band of –OH at 2716 cm−1 indicate an intramolecular hydrogen bond.30 Owing to the character absorption bands of THB superimpose onto that of THB-Au NPs, the characteristic bands of THB are slightly shifted in position and the appeared bands for –OH and C
C aromatic stretchings are less intensity and become relatively broad. These changes can be tentatively attributed to the oxidation of phenolic –OH groups of THB and reduction of Au3+ to Au0, facilitating strong THB coordination on the surfaces of Au NPs just like as oxidized citric acid on the surfaces of Au NPs.31 The absorption band at 1659 cm−1 corresponds to the oxidized phenolic groups of THB into quinone structure of THB (Scheme 1). Therefore, the phenolic groups of THB play key role in the coordination of THB molecules on the surfaces of Au NPs. Based on the above results, we believe that two phenolic (–OH) groups of THB are oxidized and coordination on the surface of Au NPs whereas the carbonyl keto and one phenolic hydroxy groups available in THB are free from chemisorption, which enhances the stabilization of Au NPs by lone pair electrons in phenolic –OH and keto groups.
The average hydrodynamic diameter of THB-Au NPs was measured by DLS and found to be ∼12 nm. The size and the morphology of Au NPs were studied by TEM. These results indicate that the synthesized THB-Au NPs are well dispersed in aqueous phase with spherical shape and sizes to be 12.5 ± 3.95, which is in good agreement with DLS data (Fig. 2a–c). Scanning electron microscopy/energy dispersive X-ray spectroscopy (SEM/EDX) was used to determine the elemental composition of synthesized THB-Au NPs and the results shows Au-79.9%, Cl-8.7%, Na-4.6%, O-3.9% and C-2.7% (ESI of Fig. S3†). Furthermore, the number of capping ligand molecules on the surfaces of Au NPs can be calculated by the reported methods using TEM and UV-visible spectroscopy.32–34 The calculation part was shown in ESI† and it was found that ∼206 THB molecules were assembled on the surfaces of single Au NPs.
 |
| Fig. 2 (a) DLS and (b) TEM image and (c) corresponding histogram of THB-Au NPs (average size 12.5 ± 3.95 nm). (d) DLS and (e) TEM image of THB-Au NPs in the presence of adenine. | |
3.5. THB-Au NPs as a colorimetric probe for identification of adenine
To evaluate the sensing ability of THB-Au NPs, we first tested the colorimetric response of different nucleosides and nucleotides such as adenine, cytidine, cytosine, guanine, guanosine, inosine, uracil, thymine, adenosine monophospahte (AMP) and adenosine triphosphate (100 μL, 1.0 mM) with 1.0 mL of THB-Au NPs solutions. Among all, only adenine undergoes molecular interaction with THB-Au NPs, ensuing color change from red to blue, which yields a red-shift in the SPR peak from 525 to 658 nm (Fig. 3). It can be noticed that the as-synthesized THB-Au NPs dispersion does not result in the color change and the spectral change of THB-Au NPs, suggesting that the addition of other nucleosides and nucleotides avoids the aggregation of THB-Au NPs, but adenine triggers the aggregation of THB-Au NPs. Thus, THB-Au NPs act as a selective colorimetric probe for the detection of adenine.
 |
| Fig. 3 UV-visible absorption spectra of THB-Au NPs upon addition of different biomolecules (cytidine, cytosine, guanine, guanosine, inosine, thymine, uracil, AMP, ATP and adenine, 100 μL, 100 μM). Inset: visual color changes corresponding to THB-Au NPs with addition of various molecular species. | |
In order to confirm the aggregation of THB-Au NPs induced by adenine, we studied the DLS and TEM of THB-Au NPs in the presence of adenine (Fig. 2). These results revealed that the sizes of THB-Au NPs were greatly increased from ∼12 nm to ∼777 nm (DLS) by the addition of adenine, which is well supported with TEM data. It is known that as Au NPs increase in size, the characteristic SPR peak in the UV-visible absorption spectra shift toward longer wavelengths. Therefore, the absorption maximum for THB-Au NPs was found to be 525 nm, where as the absorption maximum for the aggregation of THB-Au NPs induced by adenine was shown at 658 nm, confirming that the THB-Au NPs undergo aggregation upon the addition of adenine.
3.6. Effect of pH
The pH of media is most prominent parameter to justify the interaction ability of adenine with THB-Au NPs. In this connection, we studied the effect of pH on the color intensity and the absorption ratio (A658/A525) of THB-Au NPs in the presence of adenine using different buffers in the pH range of 2.0–12.0 using PBS, ammonium acetate, sodium acetate and Tris–HCl, respectively (Fig. 4a and ESI of Fig. S4 and S5a†). It was found that, the color changes and the spectral changes of THB-Au NPs in the presence of adenine were dependent on pH. Furthermore, the UV-visible absorption spectra of THB-Au NPs with adenine did not show any obvious changes using ammonium acetate, sodium acetate and Tris–HCl at pH in the range of 3.0–12.0, indicating that the adenine did not induce the aggregation of THB-Au NPs in the above buffer pHs (ESI of Fig. S4 and S5a†). At the same time, it can be seen that the absorption ratio A658/A525 is remain almost unchanged at PBS pH between 6.0–12.0 and the absorption ratio is zero. However, the absorption ratio at A658/A525 was very high at PBS pH 4.0 than pH 5.0. This indicates that adenine gets positive (protonation of amino group) due to its pKa1 value is 4.2.35 Therefore, the high degree of the aggregation of THB-Au NPs induced by adenine was observed at PBS pH 4.0 (Fig. 4a). To obtain high sensitivity, the PBS pH 4.0 was selected as an optimum pH for the following experiments.
 |
| Fig. 4 (a) UV-visible absorption spectra of THB-Au NPs with adenine (0.1 mM) at various PBS pH ranging from 2.0 to 12.0. (b) UV-visible absorption spectra of THB-Au NPs upon addition of different concentrations of adenine ranging from 0.005–100 μM at PBS pH 4. Inset image shows the corresponding color change. | |
3.7. Sensing mechanism
The prepared Au NPs using THB as a reducing and stabilizing agent are cherry red color and shown the SPR peak at 525 nm. To accomplish the direct colorimetric sensing of adenine through the aggregation-induced changes in the color and absorption spectrum of THB-Au NPs dispersion, the influence of buffer pH on the dispersion/aggregation state of THB-Au NPs is already investigated. It was observed that the maximum absorption ratio at A658/A525 was observed at PBS pH 4.0, indicating the high degree of aggregation of THB-Au NPs induced by adenine (Fig. 4a). This sensing mechanism is understood by the fact that adenine molecule bears amino (–NH2) and imino (–NH) groups and has pK values (pKa1 = 4.2 and pKa2 = 9.8),35,36 suggesting the positive (protonated) and neutral charges on adenine, which results strong electrostatic interactions and hydrogen bonding with the phenolic and keto groups of THB-Au NPs (Scheme 1). Meanwhile, phenolic group of di- or tri-hydroxyl benzophenones can be easily deprotonated in the presence of base.37 As a result, strong electrostatic interactions are generated between adenine and oxidized THB-Au NPs, where adenine acts as the trigger and crosslinker for THB-Au NPs to evoke the aggregation of THB-Au NPs. The SPR peak at 525 nm decreases and a new SPR peak appears at 658 nm, along with the color change triggered by the addition of adenine, strongly illustrates that adenine induces the aggregation of THB-Au NPs through the strong electrostatic interactions and hydrogen bonding between adenine (amino and imino groups) and THB (phenolic and keto groups)-Au NPs, which facilitates interparticle crosslinking via various interactions (electrostatic, hydrogen bonding and π–π interactions), forming a straightforward basis for quantitative sensing of adenine at minimal volumes.
3.8. Effect of purification of THB-Au NPs on sensing ability
In order to see the effect of unreacted THB molecules in THB-Au NPs for colorimetric sensing of adenine, we studied the UV-visible spectra of purified and unpurified THB-Au NPs in the presence of adenine (ESI of Fig. S5b†). To this, as-synthesized THB-Au NPs were purified by centrifugation and micro-filtration methods. The THB-Au NPs solution was filtered using syringe filter (0.45 μm) and then centrifuged at 9400 rpm for 45 min. The obtained upper layer was separated and again centrifuged at same conditions. The collected THB-Au NPs were dispersed in deionized water and studied their sensing ability for adenine at PBS pH 4.0. As shown in ESI of Fig. S5b,† the absorption ratio at A658/A525 is almost same using both purified and unpurified THB-Au NPs with adenine, indicating that the ultra-fine impurities that are present in the THB-Au NPs did not interfere with the sensing system. It was noticed that the absorption maximum of THB-Au NPs was slightly low using purified THB-Au NPs solution due to the loss of THB-Au NPs during the purification process. Therefore, we carried out all the quantification studied without purification.
3.9. Colorimetric detection of adenine
To further optimize the sensitivity of THB-Au NPs for colorimetric assay of adenine, the color and the absorption spectra of THB-Au NPs were measured in the presence of different concentrations of adenine in the range of 0.005–100 μM at PBS pH 4.0. Fig. 4b shows the UV-visible spectra of THB-Au NPs in the presence of different concentrations of adenine. They show the SPR band at 525 nm, while increasing the concentration of adenine from 0.005 to 100 μM, the cherry red color was completely changed into blue. The absorbance intensity was dramatically decreased and a new SPR band was appeared at 658 nm. These results indicate that the absorption ratio of A658/A525 was considered as an indicator for the degree of dispersion/aggregation state of THB-Au NPs, which is related to the responsive sensitivity towards adenine. Herein, we use the absorption ratio at A658/A525 to quantitatively demonstrate the sensitivity of THB-Au NPs towards adenine. The linear equation was fitted as A658/A525 = 0.298 + 0.943
log
C (adenine, nM) with correlation coefficient R2 = 0.995 (ESI of Fig. S6†). The detection limit was found to be 1.4 nM, as calculated from S/N = 3. The detection sensitivity of the present method is higher or comparable than the previous reports.7–13 These results indicating that the spherical structure of THB-Au NPs is changed, a new absorption peak appears at higher wavelength. Thus, both the changes in the color from cherry red to blue and in the absorption spectra towards higher wavelength, suggesting the morphological changes of THB-Au NPs in the presence of adenine.
In order to confirm the degree of aggregation of THB-Au NPs with increasing concentration of adenine, we studied the DLS of THB-Au NPs in the presence of different concentrations of adenine (0.001, 0.01, 0.1, 1.0 and 10 μM) (Fig. 5). Interestingly, it was found that the average hydrodynamic diameter of THB-Au NPs was gradually increased with increasing concentration of adenine from 0.001 to 10 μM, suggesting that the average size of THB-Au NPs is gradually increased with increasing concentration. As a result, the average hydrodynamic diameter of THB-Au NPs was increased from 12 to 26, 47, 79, 159 and 542 nm upon the addition of adenine concentration from 0.001 to 10 μM, confirming that the degree of aggregation of THB-Au NPs was steadily increased with increasing concentration of adenine.
 |
| Fig. 5 DLS data of THB-Au NPs upon the addition of adenine (a) 0.001, (b) 0.01, (c) 0.1, (d) 1.0 and (e) 10.0 μM at PBS pH 4.0. | |
3.10. Interference study
The selectivity of an analytical method for direct detection of adenine in biological samples is one of most important task and remains a great challenge to the analytical scientists because of the complexity of the biological systems. The interference from similar molecular species that commonly coexist in the serum and urine samples system such as cytidine, cytosine, guanine, guanosine, inosine, thymine, uracil, AMP and ATP (1.0 mM) are investigated by measuring the ratio (A658/A525) from the UV-visible spectra with the addition of mixture of above molecules in the absence and in the presence of adenine (0.1 mM) (Fig. 6a). It was observed that the addition of mixture of similar molecular species did not show any effect on either the UV-visible absorption spectrum or the color of THB-Au NPs solution, confirming that the THB-Au NPs did not undergo non-specific aggregation, and that amongst the species investigated the detection was selective for adenine.
 |
| Fig. 6 (a) UV-visible absorption spectra of THB-Au NPs in the presence of adenine (0.1 mM) along with the other molecular species (cytidine, cytosine, guanine, guanosine, inosine, thymine, uracil, AMP and ATP, 1.0 mM) at PBS pH 4.0. (b) UV-visible absorption spectra of THB-Au NPs in the presence of adenine (0.1 mM) along with increasing concentration of other molecular species (cytidine, cytosine, guanine, guanosine, inosine, thymine, uracil, AMP and ATP) from 1.0 to 10.0 mM at PBS pH 4.0. Inset image shows the corresponding color change. | |
To evaluate the selectivity of the probe for the detection of adenine at higher concentration of interfering species, we studied the UV-visible absorption spectra of THB-Au NPs upon the addition of different concentration ratios of adenine and interfering agents (1
:
10 to 1
:
100, μM : μM). As shown in Fig. 6b, the color and the absorption ratio at A658/A525 were observed even at the concentration of 1.0 mM interfering species, which is 10 time higher than adenine concentration. At the same time, the color and the absorption spectra did not show any changes at higher concentration of interfering species from 1.0 to 6.0 mM in the presence of adenine (0.1 mM). These results indicate that no interference for adenine detection during the co-existence of similar molecular species (even at concentration ratios, adenine
:
other species, 0.1
:
6.0, mM
:
mM) was observed, essentially demonstrating that the present method for adenine assay bears a high selectivity and could thus be potentially used for the sensing of adenine in biological samples.
3.11. Detection of adenine in serum and urine samples
The practical application of the present method was evaluated by determining adenine in serum and urine samples. The collected serum and urine samples were 50-folds diluted with deionized water and then spiked with different concentration of adenine (10, 50 and 100 μM). The amount of adenine was estimated by the standard addition method. In the recovery, precision and accuracy tests with serum and urine samples (Table 1), recoveries of the added adenine were found to be 86–98.2% and 95.0–101.4% for serum and urine samples. ESI of Fig. S7† shows the UV-visible absorption spectra of THB-Au NPs in the presence of adenine (100 μM) at intra- and inter-day. The obtained good recovery and RSD values indicated that the present method can be successfully applied for the detection of adenine in real samples. Importantly, there were no inhibitory or interfering substances in the serum and urine samples.
Table 1 Detection of adenine in spiked serum and urine samples using THB-Au NPs as a probe
Sample |
Known conc. (μM) |
Intra-day |
Inter-day |
Found conc.a (μM) |
% recoveryb |
Precisionc (%) |
Accuracyd (%) |
Found conc.a (μM) |
% recoveryb |
Precisionc (%) |
Accuracyd (%) |
Mean ± standard deviation (n = 5). % recovery = (found concentration/known concentration) × 100. Precision (RSD, %) = standard deviation/mean × 100. Accuracy = (found concentration − known concentration)/known concentration × 100. |
Spiked serum |
10 |
8.6 ± 0.23 |
86.0 |
2.6 |
−1.4 |
9.0 ± 0.18 |
90.0 |
2.0 |
−0.2 |
50 |
48.8 ± 0.62 |
97.6 |
1.2 |
−2.4 |
49.1 ± 0.19 |
98.2 |
0.4 |
−1.8 |
100 |
97.7 ± 0.91 |
97.7 |
0.9 |
−2.3 |
96.9 ± 0.56 |
96.9 |
0.5 |
−3.1 |
Spiked urine |
10 |
9.8 ± 0.12 |
98.0 |
1.2 |
−2.0 |
9.5 ± 0.09 |
95.0 |
0.9 |
−0.8 |
50 |
50.7 ± 0.11 |
101.4 |
0.2 |
+1.4 |
49.8 ± 0.26 |
99.6 |
0.5 |
−0.4 |
100 |
99.6 ± 0.08 |
99.6 |
0.4 |
−0.4 |
100.4 ± 0.36 |
100.4 |
0.3 |
+0.4 |
4. Conclusions
In summary, we demonstrate a simple one-step approach for the synthesis of size-optimized Au NPs using THB as a novel reducing and capping agent. The synthesized THB-Au NPs act as a selective and sensitive probe for the detection of adenine in biological samples. The characteristic SPR peak of THB-Au NPs was red-shifted from 525 to 658 nm and the color was changed from cherry red to blue in the presence of adenine that can be easily observed by the naked eye or measured by UV-visible spectroscopy. Moreover, the selective colorimetric sensing of 100 μM adenine was accomplished in the presence of 10 fold higher concentration of other similar molecular species. More importantly, the proposed method is successfully applied to the detection of adenine in serum and urine samples without any sample preparations. Therefore, this method may offer a new platform for developing miniaturized colorimetric sensors for selective and sensitive detection of adenine in biological samples.
Acknowledgements
This research was supported by the DST, India under the DST-Inspire Fellowship for Ph.D. Programme. Special thanks are given to Prof. Z. V. P. Murthy, Head, Chemical Engineering Department, S. V. National Institute of Technology, Surat for providing DLS instrument facilities to this work. We also thank the Department of Science and Technology for providing the Maya Pro 2000 spectrophotometer (Ocean Optics, USA) under the Fast-Track Young Scientist Scheme (2011–2014).
References
- H. P. Schultheiss, K. Schulze and A. Dörner, Mol. Cell. Biochem., 1996, 163/164, 319–327 CrossRef CAS.
- J. W. Phillis, Crit. Rev. Neurobiol., 2004, 16, 237–270 CrossRef CAS PubMed.
- Q. Shen and X. Wang, J. Electroanal. Chem., 2009, 632, 149–153 CrossRef CAS.
- C. E. Muller and T. Scior, Pharm. Acta Helv., 1993, 68, 77–111 CrossRef CAS PubMed.
- S. Angielski, Z. Jakubowski, T. Pawelczyk, G. Piec and M. Redlak, Renal handling and metabolism of adenosine in diabetic rats, Diabetes and the kidney, ed. A. Heidland, K. M. Koch and E. Heidbreder, Karger, Basel, Switzerland, 1989, vol. 73, pp. 52–57 Search PubMed.
- A. Deussen, M. Borst and J. Schrader, Circ. Res., 1988, 63, 240–249 CrossRef CAS PubMed.
- D. Kloor, K. Yao, U. Delabar and H. Osswald, Clin. Chem., 2000, 46, 537–542 CAS.
- A. A. Ensafi, M. M. Abarghoui and B. Rezaei, Sens. Actuators, B, 2014, 204, 528–535 CrossRef CAS.
- R. N. Goyal, S. Chatterjee, A. R. S. Rana and H. Chasta, Sens. Actuators, B, 2011, 156, 198–203 CrossRef CAS.
- C. Li, X. Qiu and Y. Ling, J. Electroanal. Chem., 2013, 704, 44–49 CrossRef CAS.
- K. Huang, L. Wang, H. Wang, T. Gan, Y. Wu, J. Li and Y. Liu, Talanta, 2013, 114, 43–48 CrossRef CAS PubMed.
- W. Wang, L. Zhou, S. Wang, Z. Luo and Z. Hu, Talanta, 2008, 74, 1050–1055 CrossRef CAS PubMed.
- J. Shi, H. Liu, J. M. Wong, R. N. Huang, E. Jones and T. J. Carlson, J. Pharm. Biomed. Anal., 2011, 56, 778–784 CrossRef CAS PubMed.
- H. B. Hines, E. E. Brueggemann and M. L. Hale, Anal. Biochem., 2004, 330, 119–122 CrossRef CAS PubMed.
- Y. W. Lin, C. C. Huang and H. T. Chang, Analyst, 2011, 136, 863–871 RSC.
- B. Sepúlveda, P. C. Angelomé, L. M. Lechuga and L. M. Liz-Marzán, Nano Today, 2009, 4, 244–251 CrossRef.
- D. Vilela, M. C. González and A. Escarpa, Anal. Chim. Acta, 2012, 751, 24–43 CrossRef CAS PubMed.
- S. Zeng, K. T. Yong, I. Roy, X. Q. Dinh, X. Yu and F. Luan, Plasmonics, 2011, 6, 491–506 CrossRef CAS.
- X. Wei, L. Qi, J. Tan, R. Liu and F. Wang, Anal. Chim. Acta, 2010, 671, 80–84 CrossRef CAS PubMed.
- Z. Chen, S. Luo, C. Liu and Q. Cai, Anal. Bioanal. Chem., 2009, 395, 489–494 CrossRef CAS PubMed.
- G. Patel and S. Menon, Chem. Commun., 2009, 3563–3565 RSC.
- C. W. Chang and W. L. Tseng, Anal. Chem., 2010, 82, 2696–2702 CrossRef CAS PubMed.
- K. A. Rawat, K. R. Surati and S. K. Kailasa, Anal. Methods, 2014, 6, 5972–5980 RSC.
- K. A. Rawat and S. K. Kailasa, Microchim. Acta, 2014, 181, 1917–1929 CrossRef CAS.
- V. N. Mehta, S. K. Kailasa and H. Wu, New J. Chem., 2014, 38, 1503–1511 RSC.
- V. N. Mehta, J. N. Solanki and S. K. Kailasa, Microchim. Acta, 2014, 181, 1905–1915 CrossRef CAS.
- B. S. B. Kasibabu, J. R. Bhamore, S. L. D'souza and S. K. Kailasa, RSC Adv., 2015, 5, 39182–39191 RSC.
- K. A. Rawat and S. K. Kailasa, Sens. Actuators, B, 2016, 222, 780–789 CrossRef CAS.
- J. Turkevich, P. C. Stevenson and J. Hillier, Discuss. Faraday Soc., 1951, 11, 55–75 RSC.
- J. D. Joshi, N. B. Patel and S. D. Patel, Iran. Polym. J., 2006, 15, 219–226 CAS.
- J. W. Park and J. S. Shumaker-Parry, J. Am. Chem. Soc., 2014, 136, 1907–1921 CrossRef CAS PubMed.
- D. V. Leff, P. C. Ohara, J. R. Heath and W. M. Gelbart, J. Phys. Chem., 1995, 99, 7036–7041 CrossRef CAS.
- S. Shankar and S. A. John, Sens. Actuators, B, 2015, 221, 1202–1208 CrossRef CAS.
- R. T. Tom, V. Suryanarayanan, P. G. Reddy, S. Baskaran and T. Pradeep, Langmuir, 2004, 20, 1909–1914 CrossRef CAS PubMed.
- L. E. Kapinos, B. P. Operschall, E. Larsen and H. Sigel, Chem.–Eur. J., 2011, 17, 8156–8164 CrossRef CAS PubMed.
- J. C. Cameselle, J. M. Ribeiro and A. Sillero, Biochem. Educ., 1986, 14, 131–136 CrossRef CAS.
- G. T. Castro, O. S. Giordano and S. E. Blanco, J. Mol. Struct., 2003, 626, 167–178 CrossRef CAS.
Footnote |
† Electronic supplementary information (ESI) available. See DOI: 10.1039/c5ra21634f |
|
This journal is © The Royal Society of Chemistry 2016 |
Click here to see how this site uses Cookies. View our privacy policy here.