
Preparation of porous graphene oxide/hydrogel nanocomposites and their ability for efficient adsorption of methylene blue†
Ali Pourjavadi*a,
Mojtaba Nazaria,
Bahareh Kabiria,
Seyed Hassan Hosseinia and
Craig Bennettb
aPolymer Research Laboratory, Department of Chemistry, Sharif University of Technology, Tehran, Iran. E-mail: purjavad@sharif.edu; Fax: +98 2 166165311; Tel: +98 2 166165311
bDepartment of Physics, Acadia University, Wolfville, Nova Scotia, Canada
First published on 20th January 2016
Abstract
Porous nanocomposite hydrogels were prepared using CaCO3 particles as solid porogens. The hydrogels were prepared by polymerization and grafting of acrylamide and 2-acrylamido-2-methylpropane sulfonic acid onto the starch in the presence of CaCO3 and graphene oxide. CaCO3 solid porogens were then removed by washing with acid and porous structures were obtained. The prepared hydrogels were used as adsorbents for methylene blue as a model cationic dye; and a very high adsorption capacity, up to 714.29 mg g−1, was obtained. Kinetics and isotherms of adsorption and the effect of porosity of hydrogel as well as other experimental conditions were also investigated. The prepared adsorbents were recovered and reused for several cycles, and high removal efficiency was observed even after five cycles of adsorption.
Introduction
Removal of pollutants from industrial wastewater has become an important problem attracting much attention in recent years.1,2 Extensive use of dyestuffs in different industries such as textile, paper, leather, cosmetics and plastic, has made dyes one of the main pollutants of water.3–5 Discharge of these wastewaters without treatment can cause serious environmental and health problems. Methylene blue (MB) is a very common cationic dye that is generally used as colorant for cotton, wool, and silk. MB can cause problems for eyes, skin and respiratory system.6 Different methods such as adsorption,7 coagulation/flocculation,8 ion exchange,9 membrane filtration,10 and photodegradation11 have been used for removal of dyes from water; among which, however, adsorption is the most attractive because of its simplicity, cost effectiveness and high efficiency.A variety of materials have been prepared and used as dye adsorbent such as activated carbon,12 carbon nanotubes (CNT),13 zeolites14 magnetic nanoparticles.15 Polymeric materials are also very interesting since they can possess a wide range of functional groups and their properties can be tailor-made. Polymeric dye adsorbents with different compositions, structures and sizes have been synthesized. Depending on the functional groups present in the structure of polymers, they can be able to adsorb specific cationic, anionic or both cationic and anionic dyes.16–18 Natural polymers are also very interesting for dye adsorption since they are inexpensive, nontoxic, and biodegradable and contain many functional groups on their chains.19–21
Polymeric hydrogels have been shown to be very effective in dye adsorption.22,23 Porous structure of hydrogels let the dye solution to diffuse rapidly into the polymeric network and interact with its functional groups. Although polymeric hydrogels have porous structure, there are other methods to increase their porosity. One method is to use solid porogens that are temporarily incorporated into the structure of hydrogel. By removing the solid porogens, void spaces will result in the positions that already were occupied with solid particles and as a consequence a more porous structure will be obtained.24
Recently, graphene has attracted much attention in different fields of applications such as electronics, sensors and biomedicine.25,26 The specific two-dimensional and sheet like structure of graphene and its high specific surface area make it appropriate for adsorption applications as well.27 However, because of strong π–π interactions and their hydrophobicity, the graphene sheets tend to agglomerate in aqueous media. Graphene oxide (GO) is the oxidized form of graphene which contains many different functional groups such as hydroxyl, carboxyl and epoxy on its surface.28 Due to the presence of these polar groups, GO can be readily dispersed in water.
Since GO possesses many polar functional groups in its structure, incorporation of GO in the polymeric network of hydrogels can increase efficiency of dye adsorption, as we found in our previous work.29 Adsorption can be promoted by attractive interactions between functional groups present in the structure of dye molecules and GO, including electrostatic attractive forces, hydrogen bonds and π–π interactions. GO can also act as a reinforcing filler for polymeric matrix of hydrogels and enhance its physical and mechanical properties.30
Herein we report synthesis of porous GO–hydrogel nanocomposites and investigate their ability for adsorption of dyes. The nanocomposite is composed of starch, polyacrylamide (PAAm) and poly(2-acrylamido-2-methylpropane sulfonic acid) (PAMPS) in which GO sheets are incorporated. In order to increase the porosity of hydrogels, calcium carbonate particles were also used as solid porogens in the structure of nanocomposites. After washing with HCl, the solid porogens were removed and a porous structure was obtained. The effect of the amount of solid porogens on porosity of nanocomposite and adsorption capacity is also studied.
Experimental
Reagents and analysis
Graphite flakes were obtained from Aldrich. 2-Acrylamido-2-methylpropane sulfonic acid (AMPS) and acrylamide (AAm) were purchased from Merck and used as received. Hydrochloric acid (HCl, 37 wt%), ammonium persulfate (APS), N,N′-methylenebisacrylamide (MBA), calcium carbonate and starch all were obtained from Merck and used without further purification.Fourier transform infrared (FTIR) spectra were collected on an ABB Bomem MB 100 spectrophotometer. The samples were pressed into KBr discs and the spectra were recorded in the range of 4000 to 400 cm−1. The morphology and surface structure of the particles were examined with Philips, XL30 scanning electron microscope (SEM). X-ray diffraction (XRD) patterns were recorded on a Siemens D5000 (Germany) diffractometer with monochromatized Cu Kα radiation. Thermogravimetric analysis (TGA) was conducted using a Perkin Elmer Pyris1 instrument from 30 to 600 °C with heating rate of 10 °C min−1 under nitrogen atmosphere. Absorption studies were performed using Perkin Elmer lambda 25 UV-Vis spectrophotometer. BET specific surface area was measured by Belsorp mini II instrument at 77 K.
Synthesis of GO
GO was synthesized using an improved Hummers method.31 Typically 1 g graphite, 120 mL H2SO4 and 13 mL H3PO4 were added to a round bottom flask and 6 g KMnO4 was gradually added while stirring at 50 °C. After 12 hours, the flask was cooled to 0 °C and 200 mL water and 3 mL H2O2 were added, respectively. The flask content was centrifuged and washed three times with HCl (5% wt) and five times with water and then dried at 50 °C.Synthesis of GO–hydrogel porous nanocomposites
0.04 g GO was added to a flask containing 10 mL water and sonicated for 20 min. Then, 0.3 g starch, 1.5 g AMPS (neutralized with NaOH), 0.5 g AAm, 0.05 g MBA and a known amount of CaCO3 were added and the mixture was stirred vigorously using a mechanical stirrer. The flask was placed in an oil bath at 70 °C and 0.05 g APS was added to it. After 1 h polymerization, hydrogels were formed and the flask was cooled to room temperature.In order to remove calcium carbonate particles, the prepared hydrogels were exposed to a solution of HCl (0.1 M) for 2 h. The excess HCl was removed by repeated washing using water. Then, the hydrogels were deswelled in acetone, dried in an oven at 50 °C and sieved through a 50-mesh sieve.
Dye adsorption
Adsorption of MB from aqueous solution was performed by a batch process. For this purpose, 10 mg of the sieved nanocomposites was added to 40 mL dye solution (100 mg L−1) and the mixture was stirred. The concentration of dye at different time intervals was determined by UV-Vis spectroscopy at λmax of MB (664 nm).Adsorption capacity (qe) and removal efficiency (R) were calculated using following equations:
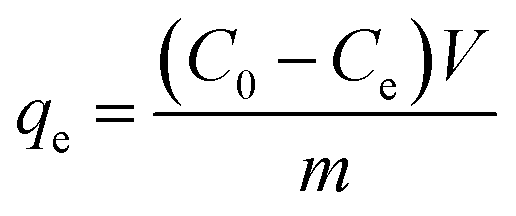 | (1) |
 | (2) |
Results and discussion
Synthesis of adsorbent
Nanocomposite hydrogels were synthesized by free radical polymerization of AMPS and AAm in the presence of starch and GO and using MBA as a crosslinking agent. The monomers used here, AMPS and AAm, contain sulfunate and amide groups, respectively, which can interact with dye molecules. PAMPS and PAAm were grafted onto the starch and crosslinked to form a 3D network. As an inexpensive non-toxic natural polymer, the presence of starch not only makes the hydrogels more biodegradable and environmentally friendly but also provides more functional groups in the structure of hydrogels and facilitates dye adsorption. The polymeric matrix of the resulting nanocomposites contains many functional groups such as sulfunate, amide and hydroxyl groups which are able to interact with dyes through electrostatic interactions and hydrogen bonds. GO was also used in the structure of hydrogels to increase adsorption efficiency and improve its physical properties. Dye adsorption should be increased by using GO because of its high specific surface area and presence of a large number of functional groups such as carboxyl, hydroxyl and epoxy groups.29 In order to obtain porous nanocomposites, calcium carbonate particles as solid porogens were first incorporated in the structure of hydrogels and then removed by dissolving in HCl solution. Three different hydrogel nanocomposites containing 0, 4 and 12 wt% calcium carbonate were prepared and named as HCC0, HCC4 and HCC12, respectively. Acid treated HCC4 and HCC12 samples were also named as ATH4 and ATH12, respectively. The schematic illustration of the synthetic rout is depicted in Fig. 1. | ||
| Fig. 1 Preparation of porous nancomposite hydrogel. | ||
Characterization
FTIR spectra of GO, CaCO3, and the synthesized hydrogels are shown in Fig. 2. The spectrum of GO shows peaks at 3400, 1730, 1250 and 1050 cm−1 which are related to O–H, C![[double bond, length as m-dash]](https://www.rsc.org/images/entities/char_e001.gif) O, C–O–C and C–O stretching vibrations, respectively. The peaks appeared in the spectrum of the synthesized nanocomposites (HCC0, Fig. 2b) are related to numerous functional groups such as hydroxyl, carboxyl and amide groups present in the structure of the nanocomposites. The peak appeared at 871 cm−1 in the spectrum of HCC4 (Fig. 2d) is characteristic peak of carbonate bending vibration. This peak which is also present in the spectrum of neat calcium carbonate (Fig. 2c) indicates that CaCO3 particles are entrapped in the structure of nanocomposite. It is observed that the peak at 871 cm−1 disappeared after treatment of nanocomposites with HCl (Fig. 2e) which confirms CaCO3 was completely removed from the nanocomposites.
O, C–O–C and C–O stretching vibrations, respectively. The peaks appeared in the spectrum of the synthesized nanocomposites (HCC0, Fig. 2b) are related to numerous functional groups such as hydroxyl, carboxyl and amide groups present in the structure of the nanocomposites. The peak appeared at 871 cm−1 in the spectrum of HCC4 (Fig. 2d) is characteristic peak of carbonate bending vibration. This peak which is also present in the spectrum of neat calcium carbonate (Fig. 2c) indicates that CaCO3 particles are entrapped in the structure of nanocomposite. It is observed that the peak at 871 cm−1 disappeared after treatment of nanocomposites with HCl (Fig. 2e) which confirms CaCO3 was completely removed from the nanocomposites.
 | ||
| Fig. 2 FTIR spectra of GO (a) HCC0 (b) CaCO3 (c) HCC4 (d) ATH4 (e). | ||
XRD patterns of CaCO3 and nanocomposites are shown in Fig. 3. XRD pattern of CaCO3 (Fig. 3a) shows peaks appeared at 2 theta values about 23, 29, 34, 36, 39.5, 43, 48, 49, 58, 61, and 65° which are related to calcite phase.32 These characteristic peaks are also appeared in the XRD pattern of HCC12 (Fig. 3b) confirming the presence of CaCO3 in the prepared hydrogels. XRD pattern of GO (Fig. 5c) shows one peak at 2 theta value of 12° which is related to interlayer d-spacing of 8 Å. However, this peak is not observed in the XRD pattern of neither HCC0 (Fig. 3b) nor HCC12 (Fig. 3d) because of exfoliation and intercalation of GO nanosheets by polymeric networks. The characteristic peaks of CaCO3 are also disappeared in the pattern of ATH12 indicating CaCO3 was completely removed from hydrogel after washing with HCl (Fig. 3d). The hydrogel nanocomposite is amorphous and no peak is observed in its XRD pattern.
 | ||
| Fig. 3 XRD patterns of neat CaCO3 (a), HCC12 (b), GO (c) and ATH12 (d). | ||
TGA curves of CaCO3, HCC0 and HCC12 are shown in Fig. 4. Thermal degradation of calcium carbonate starts at 600 °C and about 45 wt% of the sample is lost up to 675 °C. The weight loss of samples at 100–150 °C is due to the removal of adsorbed water. HCC0 undergoes a two-step degradation which occurs at 200 and 300 °C and about 80 wt% is lost up to 800 °C. TGA curve of HCC12 shows one more degradation step occurs at 600 °C which is due to the thermal decomposition of CaCO3 present in the structure of the nanocomposite. It is also observed that about 68 wt% of the sample is lost after heating up to 600 °C indicating about 12 wt% of the HCC12 is composed of calcium carbonate. The overall weight loss of HCC12 after heating up to 800 °C is 75 wt%.
 | ||
| Fig. 4 TGA curves of CaCO3 (a), HCC12 (b) and HCC0 (c). | ||
SEM and TEM images of GO (Fig. S1†) show a sheet-like, wrinkled and folded structure. The prepared GO sheets have large lateral dimensions and their thickness is just a few nanometer. The results indicate that well-exfoliated GO nanosheets were successfully synthesized.
SEM image of the hydrogel without calcium carbonate (HCC0) is shown in Fig. 5a. It is observed that the surface of the hydrogel is smooth and no pores are present in its structure. SEM image of HCC4 (Fig. 5b) shows angular, coarse particles of calcium particles present the structure of the prepared hydrogel nanocomposites. SEM image of ATH12 (Fig. 5c) shows that more porous and rough structure was obtained in comparison with the nanocomposites represented in Fig. 5a. These results indicate that the porosity of the hydrogels increases after removal of calcium carbonate. CaCO3 particles are first entrapped into the polymer matrix and by removing them in the next step, a porous structure will result in. The porosity of adsorbent is a very important parameter in adsorption process since it increases surface area and facilitates diffusion of dyes into the adsorbent.
 | ||
| Fig. 5 SEM images of HCC0 (a) HCC12 (b) ATH12 (c). | ||
BET analysis of ATH12 was performed and the obtained N2 adsorption–desorption isotherm is depicted in Fig. S2.† Specific surface area of the adsorbent is 33 m2 g−1 which is relatively high in comparison with many other typical polymer composites.33,34
As is represented in Fig. S3a,† EDX analysis of the HCC12 confirms the presence of calcium into the nanocomposite which is due to the entrapment of calcium carbonate particles in the structure of the hydrogel. Ca mapping of the prepared nanocomposites (Fig. S3b†) also indicates that calcium carbonate particles are dispersed and distributed in the matrix of the hydrogel. On the basis of the results obtained by EDX analysis, about 12 wt% of the prepared nanocomposite is composed of calcium carbonate.
Dye adsorption
The prepared hydrogels were used as adsorbents for a cationic dye, MB which its structure is shown in Fig. S4.† Dynamic equilibrium adsorption of MB on HCC0 is shown in Fig. 6. Due to the presence of different functional groups such as sulfunate, amide and hydroxyl groups in the structure of polymeric network, the prepared adsorbents could adsorb MB. Adsorption takes place through physical interactions between dye molecules and adsorbent surface. So, any attractive interaction between dye and adsorbent can facilitate and increase dye adsorption. Electrostatic interaction is the most prominent interaction that strongly affects adsorption of dyes on the adsorbents. The charge of the adsorbent was determined by zeta potential measurement. It was found that the zeta potential of the adsorbent is −52 eV confirming the adsorbents are highly negatively charged. This high value of negative charge mainly originating from sulfonate groups of polymer chains provides a strong attractive interaction with positive charges of MB molecules. The amide and hydroxyl groups present in the structure of polymer matrix can form hydrogen bonds with amine groups of MB. There are also aromatic rings in the structure of MB which are able to interact with aromatic rings of GO through π–π interactions. The whole of these attractive forces makes high adsorption capacity of dye molecules possible. The effect of such functional groups and attractive interactions are also discussed in other reports in the literature.35,36 | ||
| Fig. 6 Adsorption capacity of MB on HCC0, ATH4, ATH12 and HCC0 without GO with time. | ||
Dye removal was performed rapidly at the initial stages of adsorption and then its rate decreases and finally reaches to a constant value. The equilibrium adsorption capacity of MB on HCC0 is 331.6 mg g−1. Dye adsorption was also performed using hydrogels without GO and it was found that in this case the adsorption capacity decreases to 322 mg g−1. This result which is in accordance with our previous finding can be due to the interaction of dyes with functional groups present in the structure of GO and adsorption on its surface.29
The effect of porosity of the hydrogel on dye adsorption was then investigated. Porous structures were prepared by temporary incorporation of calcium carbonate particles into the hydrogel and subsequent removal of it. Therefore, hydrogels with different porosities were obtained by varying the initial amount of CaCO3. The results of dye adsorption for two different hydrogels are also shown in Fig. 6. Adsorption capacity for HCC4 and HCC12 are 375.08 and 396.16 mg g−1, respectively, which are more than that of HCC0. The results show that dye adsorption increases by using CaCO3 in the hydrogel and then dissolving it. Adsorption capacity also increases by increasing the initial amount of CaCO3, which is due to the formation of a more porous structure. Increasing the porosity of hydrogels causes an increase in adsorption capacity, since dyes can diffuse through the polymeric matrix more easily and interact with functional groups of hydrogel. Porosity also increases adsorbent surface area which is an important parameter affecting dye adsorption. However, we found that further increasing of the porosity of the polymer decreases mechanical strength of hydrogel significantly so that the adsorbents collapse in the water. Considering the results obtained here, we used ATH12 for all further experiments in the next sections.
Effect of pH
Since pH of the solution has a strong effect on dye adsorption, experiments were conducted in solutions with different pH adjusted by the addition of HCl or NaOH solutions (0.01 N). Adsorption of MB in solutions with pH range from 3 to 11 was investigated and the results are shown in Fig. 7. There are many functional groups such as hydroxyl, sulfunate and amide groups in the structure of the prepared adsorbent. In neutral or basic pH values, adsorption capacity is very high due to strong electrostatic interactions between adsorbent and dye molecules. However by decreasing pH to acidic ranges, functional groups of adsorbent become protonated which leads to a repulsion between adsorbent and positively charged dye molecules. As a consequence, adsorption capacity decreases in lower pH values. | ||
| Fig. 7 The effect of pH on equilibrium adsorption capacity. | ||
Effect of initial dye concentration
In order to investigate the effect of initial dye concentration on adsorption capacity, measurements were performed in solutions with different initial dye concentrations. As is shown in Fig. 8a, by increasing initial dye concentration in the range of 30 to 250 mg L−1, adsorption capacity increases continuously from 118.86 to 641.22 mg g−1. This is because higher dye concentrations provide greater driving force to overcome the mass transfer resistance of dye molecules from aqueous phase to solid phase.37 However, the rate of increasing in adsorption capacity decreases and finally reaches to a constant value.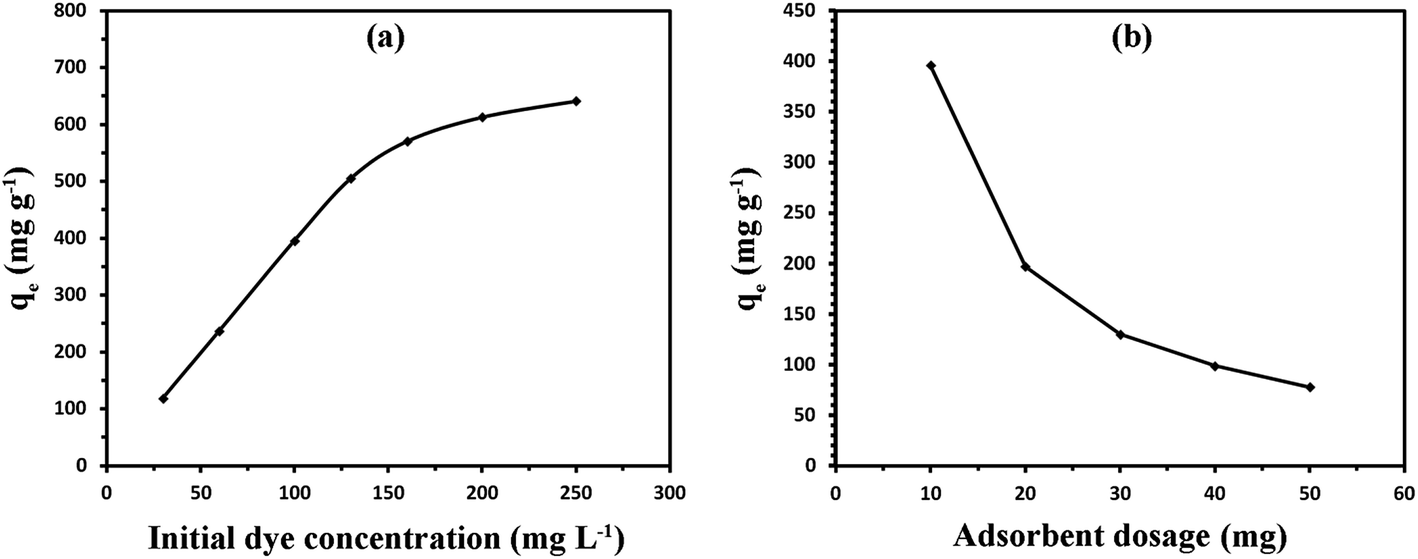 | ||
| Fig. 8 The effect of initial dye concentration (a) and adsorbent dosage (b) on equilibrium adsorption capacity. | ||
Effect of adsorbent dosage
The influence of adsorbent dosage on dye adsorption was also investigated and the results are shown in Fig. 8b. It is observed that adsorption capacity decreases significantly by increasing adsorption dosage from 10 to 50 mg, which may be attributed to the splitting effect of flux or concentration gradient between dye molecules and adsorbent.38Adsorption kinetic
Adsorption kinetic describes the rate of uptake of dye on the adsorbent. We used pseudo-first-order and pseudo-second-order kinetic models to analyze experimental data. Pseudo-first-order39 and pseudo-second-order40 kinetic models are generally given as eqn (3) and (4), respectively:
 | (3) |
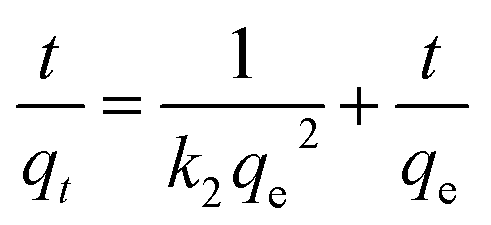 | (4) |
The plots of pseudo-first-order and pseudo-second-order kinetic models are shown in Fig. S5.† The kinetic parameters for the two models were calculated from the slops and intercepts of the plots and are listed in Table 1. The results show that the coefficient factor for pseudo-first-order kinetic model is very high (R2 = 0.999) and calculated adsorption capacity (qcalc = 396.16 mg g−1) is in good agreement with experimental value (qexp = 400 mg g−1), indicating experimental data are better fitted with pseudo-second-order kinetic model.
| Kinetic model | Parameters | qexp mg g−1 | |||
|---|---|---|---|---|---|
| k1 min−1 | k2 g mg−1 min−1 | qe mg g−1 | R2 | ||
| Pseudo-first-order | 0.0507 | 429.93 | 0.958 | 396.16 | |
| Pseudo-second-order | 0.0023 | 400.00 | 0.999 | 396.16 | |
Adsorption isotherm
Langmuir and Freundlich models are two common isotherm models that are widely used to describe adsorption isotherms. In Langmuir isotherm, expressed by eqn (5), adsorption occurs as monolayer coverage of adsorbate on homogeneous energetically equivalent adsorbent surface.
 | (5) |
Freundlich isotherm model considers adsorption as multilayer coverage of adsorbate on heterogeneous adsorbent surface and is expressed as follows:
 | (6) |
The plot of Langmuir and Freundlich isotherm models are shown in Fig. S6† and the parameters related to each model are listed in Table 2. Coefficient factor (R2) for Langmuir and Freundlich isotherm models is 0.980 and 0.754, respectively, indicating adsorption of MB on the prepared adsorbent is best fitted to the Langmuir isotherm model. According to this model, a high maximum adsorption capacity (qm) up to 714.29 mg g−1 was obtained for the prepared adsorbents.
| Isotherm model | Parameters | n | R2 | ||
|---|---|---|---|---|---|
| KF mg g−1 (L mg−1)1/n | KL L mg−1 | qm mg g−1 | |||
| Langmuir | 0.737 | 156.25 | 0.980 | ||
| Freundlich | 265.09 | 4.127 | 0.754 | ||
RL is an essential factor of Langmuir isotherm model that indicates whether adsorption is unfavorable (RL > 1), linear (RL = 1), favorable (0 < RL < 1), or irreversible (RL = 0). This dimensionless factor is expressed as follows:
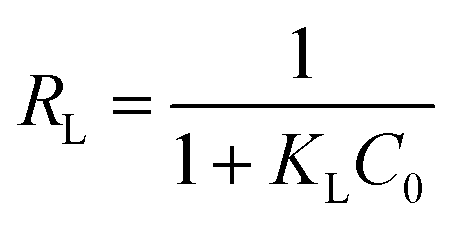 | (7) |
Recycling study
The ability of recycling and reusing of an adsorbent is an important feature that should be considered in adsorption process. The photographs of dye solution before and after adsorption process are shown in Fig. S8.† It can be seen that the supernatant solution is almost colorless after adsorption and the adsorbent can be readily separated from solution by simple filtration. In order to study the reusability of the adsorbents, the particles were separated from the solution, dispersed in 10 mL HCl solution (0.5 M) and stirred for 2 h to desorb dyes. Then, the adsorbents were separated and dried at 50 °C. The recycled adsorbents were used for next runs and their ability for dye adsorption was investigated. Recycling experiment was performed for five cycles of adsorption–desorption and the results are depicted in Fig. 9. In the first run, a very high removal efficiency of MB up to 99% was obtained. As is shown in Fig. 9, removal efficiency does not change significantly and is still very high, even after five cycles of adsorption–desorption. The results indicated that the prepared adsorbents can be easily recovered and reused for several cycles of adsorption without any significant loss of dye removal efficiency. | ||
| Fig. 9 Reusability of the adsorbents. | ||
Comparison with other adsorbents
Many adsorbents with different structures and compositions have been prepared and used for removal of different dyes. Thus, it is worth comparing the adsorbent prepared here with some other adsorbents recently used for adsorption of MB. Maximum adsorption capacity (qm) for some adsorbents are listed in Table 3. The results show that the adsorbent prepared in this study has a very high adsorption capacity which is much higher than the other adsorbents. The results indicate that the prepared adsorbent is very effective for removal of MB from aqueous solution. Moreover, about 13 wt% the prepared hydrogels are composed of starch which makes them more environmentally friendly and economically cost-effective.| Adsorbent | qm mg g−1 | Reference |
|---|---|---|
| Graphene oxide/calcium alginate composite | 181.81 | 41 |
| Modified mesoporous clay | 100 | 42 |
| Polyacrylamide/cellulose nanocrystals | 326 | 43 |
| Starch–humic acid composite hydrogel | 110 | 44 |
| Xylan/poly(acrylic acid) magnetic nanocomposite | 438.60 | 45 |
| Polymethacrylic acid grafted cellulose/bentonite composite | 371.67 | 46 |
| Graphene-modified magnetic polypyrrole nanocomposite | 270.3 | 47 |
| Porous GO/hydrogel nanocomposite | 769.23 | This study |
Conclusion
Porous GO–hydrogel nanocomposites were prepared and used as dye adsorbents. The hydrogels were prepared by graft copolymerization of AMPS and AAm onto the starch using MBA as crosslinking agent and in the presence of GO nanosheets and calcium carbonate particles. The entrapped calcium carbonate particles were then removed from the hydrogel by dissolving in HCl solution and a porous hydrogel was obtained. The prepared hydrogels were used as adsorbent for MB. The results showed that equilibrium adsorption capacity of MB increased by increasing porosity of the hydrogel. Kinetic and isotherm of adsorption as well as the effect of other experimental conditions such as pH, adsorption dosage and initial dye concentration on dye adsorption was also studied. Adsorption of dyes were well-described by pseudo-second-order kinetic model and Langmuir isotherm model. The recycling study revealed that the adsorbent can be used for several cycles of adsorption without any significant loss of activity.References
- A. Ahmad, S. H. Mohd-Setapar, C. S. Chuong, A. Khatoon, W. A. Wani, R. Kumar and M. Rafatullah, RSC Adv., 2015, 5, 30801–30818 RSC.
- F. Fu, W. Han, B. Tang, M. Hu and Z. Cheng, Chem. Eng. J., 2013, 232, 534–540 CrossRef CAS.
- F. Torrades and J. García-Montaño, Dyes Pigm., 2014, 100, 184–189 CrossRef CAS.
- S. Karthikeyan, R. B. Ahamed, M. Velan and G. Sekaran, RSC Adv., 2014, 4, 63354–63366 RSC.
- V. Janaki, B.-T. Oh, K. Shanthi, K.-J. Lee, A. Ramasamy and S. Kamala-Kannan, Synth. Met., 2012, 162, 974–980 CrossRef CAS.
- K. A. G. Gusmão, L. V. A. Gurgel, T. M. S. Melo and L. F. Gil, Dyes Pigm., 2012, 92, 967–974 CrossRef.
- M. T. Yagub, T. K. Sen, S. Afroze and H. M. Ang, Adv. Colloid Interface Sci., 2014, 209, 172–184 CrossRef CAS PubMed.
- Y.-Y. Lau, Y.-S. Wong, T.-T. Teng, N. Morad, M. Rafatullah and S.-A. Ong, Chem. Eng. J., 2014, 246, 383–390 CrossRef CAS.
- M. Greluk and Z. Hubicki, Chem. Eng. Res. Des., 2013, 91, 1343–1351 CrossRef CAS.
- S. Cheng, D. L. Oatley, P. M. Williams and C. J. Wright, Water Res., 2012, 46, 33–42 CrossRef CAS PubMed.
- C. Tian, Q. Zhang, A. Wu, M. Jiang, Z. Liang, B. Jiang and H. Fu, Chem. Commun., 2012, 48, 2858–2860 RSC.
- G. Mezohegyi, F. P. van der Zee, J. Font, A. Fortuny and A. Fabregat, J. Environ. Manage., 2012, 102, 148–164 CrossRef CAS PubMed.
- S. Wang, C. W. Ng, W. Wang, Q. Li and L. Li, J. Chem. Eng. Data, 2012, 57, 1563–1569 CrossRef CAS.
- V. Hernández-Montoya, M. A. Pérez-Cruz, D. I. Mendoza-Castillo, M. Moreno-Virgen and A. Bonilla-Petriciolet, J. Environ. Manage., 2013, 116, 213–221 CrossRef PubMed.
- B. Saha, S. Das, J. Saikia and G. Das, J. Phys. Chem. C, 2011, 115, 8024–8033 CAS.
- K. Zhang, J. Wang, Y. Wang, L. Zhao and Q. Xu, Chem. Eng. J., 2014, 247, 50–58 CrossRef CAS.
- H. Gao, T. Kan, S. Zhao, Y. Qian, X. Cheng, W. Wu, X. Wang and L. Zheng, J. Hazard. Mater., 2013, 261, 83–90 CrossRef CAS PubMed.
- N. B. Shukla, S. Rattan and G. Madras, Ind. Eng. Chem. Res., 2012, 51, 14941–14948 CrossRef CAS.
- Y. Zhou, M. Zhang, X. Hu, X. Wang, J. Niu and T. Ma, J. Chem. Eng. Data, 2013, 58, 413–421 CrossRef CAS.
- V. Esquerdo, T. Cadaval, G. Dotto and L. Pinto, J. Colloid Interface Sci., 2014, 424, 7–15 CrossRef CAS PubMed.
- S. Ghorai, A. K. Sarkar, A. B. Panda and S. Pal, Bioresour. Technol., 2013, 144, 485–491 CrossRef CAS PubMed.
- V. V. Panic and S. J. Velickovic, Sep. Purif. Technol., 2014, 122, 384–394 CrossRef CAS.
- G. R. Mahdavinia, H. Aghaie, H. Sheykhloie, M. T. Vardini and H. Etemadi, Carbohydr. Polym., 2013, 98, 358–365 CrossRef CAS PubMed.
- M. V. Dinu, M. Přádný, E. S. Drăgan and J. Michálek, Carbohydr. Polym., 2013, 94, 170–178 CrossRef CAS PubMed.
- S. Guo and S. Dong, Chem. Soc. Rev., 2011, 40, 2644–2672 RSC.
- J. Yao, Y. Sun, M. Yang and Y. Duan, J. Mater. Chem., 2012, 22, 14313–14329 RSC.
- P. Lazar, F. e. Karlickyý, P. Jurečka, M. s. Kocman, E. Otyepkovaá, K. r. Šafaářovaá and M. Otyepka, J. Am. Chem. Soc., 2013, 135, 6372–6377 CrossRef CAS PubMed.
- D. R. Dreyer, S. Park, C. W. Bielawski and R. S. Ruoff, Chem. Soc. Rev., 2010, 39, 228–240 RSC.
- A. Pourjavadi, M. Nazari and S. H. Hosseini, RSC Adv., 2015, 5, 32263–32271 RSC.
- J. Fan, Z. Shi, M. Lian, H. Li and J. Yin, J. Mater. Chem. A, 2013, 1, 7433–7443 CAS.
- D. C. Marcano, D. V. Kosynkin, J. M. Berlin, A. Sinitskii, Z. Sun, A. Slesarev, L. B. Alemany, W. Lu and J. M. Tour, ACS Nano, 2010, 4, 4806–4814 CrossRef CAS PubMed.
- S. Shirsath, S. Sonawane, D. Saini and A. Pandit, Ultrason. Sonochem., 2015, 24, 132–139 CrossRef CAS PubMed.
- R. Akkaya and U. Ulusoy, J. Hazard. Mater., 2008, 151, 380–388 CrossRef CAS PubMed.
- W. Wang and A. Wang, Carbohydr. Polym., 2009, 77, 891–897 CrossRef CAS.
- I. Moreno-Villoslada, C. Torres, F. González, T. Shibue and H. Nishide, Macromol. Chem. Phys., 2009, 210, 1167–1175 CrossRef CAS.
- Y. Hu, T. Guo, X. Ye, Q. Li, M. Guo, H. Liu and Z. Wu, Chem. Eng. J., 2013, 228, 392–397 CrossRef CAS.
- B. Tanhaei, A. Ayati, M. Lahtinen and M. Sillanpää, Chem. Eng. J., 2015, 259, 1–10 CrossRef CAS.
- S. Dawood and T. K. Sen, Water Res., 2012, 46, 1933–1946 CrossRef CAS PubMed.
- S. Lagergren, K. Sven. Vetenskapsakad. Handl., 1898, 24, 1–39 Search PubMed.
- Y.-S. Ho and G. McKay, Chem. Eng. J., 1998, 70, 115–124 CrossRef CAS.
- Y. Li, Q. Du, T. Liu, J. Sun, Y. Wang, S. Wu, Z. Wang, Y. Xia and L. Xia, Carbohydr. Polym., 2013, 95, 501–507 CrossRef CAS PubMed.
- M. Auta and B. Hameed, Chem. Eng. J., 2012, 198, 219–227 CrossRef.
- C. Zhou, Q. Wu, T. Lei and I. I. Negulescu, Chem. Eng. J., 2014, 251, 17–24 CrossRef CAS.
- R. Chen, Y. Zhang, L. Shen, X. Wang, J. Chen, A. Ma and W. Jiang, Chem. Eng. J., 2015, 268, 348–355 CrossRef CAS.
- X.-F. Sun, B. Liu, Z. Jing and H. Wang, Carbohydr. Polym., 2015, 118, 16–23 CrossRef CAS PubMed.
- T. Anirudhan and A. Tharun, Chem. Eng. J., 2012, 181, 761–769 CrossRef.
- L. Bai, Z. Li, Y. Zhang, T. Wang, R. Lu, W. Zhou, H. Gao and S. Zhang, Chem. Eng. J., 2015, 279, 757–766 CrossRef CAS.
Footnote |
| † Electronic supplementary information (ESI) available. See DOI: 10.1039/c5ra21629j |
| This journal is © The Royal Society of Chemistry 2016 |