
Multi-functionalized graphene oxide complex as a plasmid delivery system for targeting hepatocellular carcinoma therapy
Chunyang Wanga,
Xiaoqin Wangb,
Tong Lua,
Fangshi Liuc,
Baofeng Guob,
Naiyan Wenb,
Yanwei Dub,
Hang Lina,
Jun Tang*a and
Ling Zhang*b
aDepartment of Polymer Science, Chemistry College, Jilin University, Changchun 130012, People’s Republic of China. E-mail: chemjtang@jlu.edu.cn
bDepartment of Pathophysiology, Norman Bethune Medical School, Jilin University, Changchun 130021, People’s Republic of China. E-mail: zhangling3@jlu.edu.cn
cPediatrics, First Clinical College, Changchun University of Chinese Medicine, Changchun 130012, People’s Republic of China
First published on 15th February 2016
Abstract
A novel efficient graphene-based gene delivery vector was synthesized by continuous covalent functionalization of graphene oxide (GO) with polyethylenimine (PEI), polyethylene glycol (PEG) and folic acid (FA), followed by loading si-Stat3 via electrostatic adsorption (GO–PEI–PEG–FA/si-Stat3). We investigated the effect of changing the content of PEI in the complex on the effective diameter and transfection efficiency. It was found that as the PEI content in the complex increased, the effective diameter was reduced until a point where it remained almost unchanged and the transfection efficiency of complex became higher. The results also showed that the transfection efficiency is relatively high with the content of PEI in the complex at 61 wt% without any obvious cytotoxicity. At the same time, the stability of the complex in physiological conditions was improved. The GO–PEI–PEG–FA/si-Stat3 complex exhibited an excellent ability to silence Stat3 expression for targeting tumor hepatocellular carcinoma in vitro.
1. Introduction
Gene therapy is a hot research field for treating gene related diseases, especially cancer, over the past two decades. One of the key issues in gene therapy is to develop a suitable gene and drug delivery carrier which involves research into both viral and non-viral vectors.1–3 Non-viral vectors have attracted considerable attention owing to their high safety and efficiency, such as polymers,4–7 cationic lipids,8,9 nanoparticles10–15 and others.16–18 In recent years, the study of non-viral vectors has shown great progress. However, problems such as non-specificity to tumor sites, cytotoxicity and biocompatibility in physiological environments have not been properly addressed. Therefore, the development of an effective nanocarrier is still a significant challenge for gene therapy.19Recently, graphene, atom-thick sheets of carbon packed in a two-dimensional layered structure with remarkable properties has been widely used in many applications, such as electrochemical devices, biomedicine and so on.20–23 Graphene oxide (GO), graphene’s water-soluble derivative has already attracted enormous interest due to its ease of manufacture, good dispersibility in water and physiological environments, good colloidal stability. It has shown potential applications in biological fields including biosensors, gene and drug delivery, as well as biological imaging in vitro and in vivo.24–34 Liu et al. first reported that GO was bound with polyethylenimine (PEI) (1.2 kDa and 10 kDa), then bound with plasmid DNA (pDNA) for intercellular transfection of the EGFP gene in HeLa cells.35 At the same time, Zhang et al. prepared PEI-grafted GO (GO–PEI) via covalent functionalization as an excellent nanocarrier for sequential delivery of siRNA and chemical drugs in vitro.36
Polyethylene glycol (PEG) is an amphiphilic polymer that could improve the solubility of nanomaterials in serum, phosphate buffer solution (PBS) and physiological solutions with high aqueous stability.25,26 Feng et al. synthesized GO–PEI–PEG with an excellent solubility in physiological environments and low toxicity for delivering small interfering RNA (siRNA) into cells under the control of NIR light.37 Meanwhile, Zhang et al. used GO–PEI–PEG for treating Drosophila S2 cells with plasmid DNA as a transfection agent.38 Subsequently, Zhang et al. utilized a MMP2-cleavable PLGLAG peptide linkage method to combine GO–PEI–PEG with the anti-tumor drug doxorubicin (DOX) for tumor induced imaging and potential combinational tumor therapy.39 Recently, Qu et al. demonstrated that the intracellular transportation of nanocarriers (GO–PEG–PEI) was enhanced using a photo-thermal source for light-controllable cytosine–phosphate–guanine CpG delivery for the first time.40 Signal transducer and activator of transcription 3 (Stat3) has often been regarded as an oncogene. High expression of Stat3 has been found in hepatocellular carcinoma, malignant melanoma, breast carcinoma and prostate cancer.41,42 Our previous work also reported that plasmid Stat3 siRNA effectively inhibited Stat3 gene expression in vivo delivered by GO–PEI–PEG, resulted in the induction of apoptosis in mouse malignant melanoma and suppressed tumor growth.43 In order to target deep-seated malignant tumors, we used an FA-based complex in our study. A FA-based complex is important for plasmid delivery of gene vectors as it can directly and accurately reach the tumor site to maximize the effectiveness of the tumor treatment.44,45 Zhang et al. successfully functionalized sulfonic GO with FA via conjugation to load two mixed anticancer drugs DOX and CPT to target MCF-7 cells.46 Chen et al. reported that GO was conjugated with PEG-co-FA and PyNH2 for targeting intracellular delivery of hTERT siRNA to efficiently knockdown the protein expression level and mRNA level.47 These results indicated that the multi-functionalized GO-based gene delivery carriers could be applied in gene therapy. However, the efficient and controllable gene delivery nanocarriers should be further researched in the corresponding gene therapy field to establish the structure–property relationship.
In this paper, a novel multi-functionalized GO-based gene vector was prepared for targeted therapy of hepatocellular carcinoma successfully. The GO–PEI–PEG–FA/si-Stat3 gene vector was prepared by covalent modification of GO with PEI, PEG and folic acid (FA) in turn, whereafter loading of si-Stat3 via electrostatic interactions. In this gene vector, PEI was used for controlling the transfection efficiency, PEG for improving the solubility in physiological solutions, FA for targeting tumor therapy and si-Stat3 was used for silencing of Stat3 expression. The controllable structure of the complex was studied by adjusting the reaction conditions and the effect of different structure on transfection efficiency of gene vector was investigated. The as-prepared GO–PEI–PEG–FA/si-Stat3 gene vector possessed not only lower toxicity and higher transfection efficiency, as well as better aqueous stability, but also achieved the goal of targeting therapy for tumor mouse hepatocellular carcinoma in vitro.
2. Experimental section
2.1. Materials
Natural graphite powder was supplied from Guangfu Fine Chemical Research Institute (Tianjin, China). Branched polyethylenimine (PEI 25 kDa) was purchased from Sigma (St. Louis, MO, USA). N-Hydroxysuccinimide (NHS) was purchased from Aladdin Chemistry Co., Ltd. N-Ethyl-N′-(3-dimethylaminopropyl)carbodiimide hydrochloride (EDC), triethylamine (TEA), folic acid (FA), the molecular mass cutoff dialysis membrane (10 kDa) were purchased from Sinopharm Chemical Reagent Beijing Co., Ltd (Beijing, China). NH2–PEG–COOH (5 kDa) was purchased from Beijing JenKem Technology Co., Ltd (Beijing, China). Dulbecco’s modified Eagle’s medium (DMEM) was supplied from GIBCO (Carlsbad, CA, USA). SMMC-7721 human hepatoma cell lines were purchased from Bogoo Biological Technology Co., Ltd. (Shanghai, China). Plasmids and strains PGC silencer-si-Stat3 (si-Stat3) preserved as mentioned before. Goat anti rabbit polyclonal IgG-HRP antibody and beta-actin antibody were purchased from Bioss Inc. (Beijing, China). Stat3 antibody was purchased from Signaling Company American Cell (USA). Enhanced chemiluminescence (ECL) was purchased from Amersham ECL Buckinghamshire Company (UK).2.2. Preparation of GO–PEI
GO–PEI was synthesized using our previously reported method.42 The crude GO–PEI was subjected to dialysis in deionized water for 3 days to completely remove unreacted PEI.2.3. Preparation of GO–PEI–PEG
The as-prepared GO–PEI (1 mg mL−1, 0.5 mL) complex was mixed with NH2–PEG–COOH (2.5 mg, 0.5 mmol) using EDC/NHS (0.5/0.5 mmol) as coupling agent in the 10 mL flask. The conjugation reaction was stirred at room temperature for 24 h. The resulting GO–PEI–PEG solution was dialyzed in deionized water for 3 days to remove unreacted NH2–PEG–COOH. The product GO–PEI–PEG was obtained.2.4. Preparation of GO–PEI–PEG–FA
FA (0.2 mmol), EDC (0.5 mmol) and NHS (0.5 mmol) were put into 1 mL PBS (pH ∼ 7.4) solution, then the solution was stirred at room temperature for 6 h. Subsequently, the reaction mixture was added to GO–PEI–PEG suspension (1 mg mL−1, 1 mL) and it was stirred overnight at room temperature. The final product GO–PEI–PEG–FA was dialyzed in the deionized water for 3 days.2.5. GO–PEI–PEG–FA delivering si-Stat3
To observe si-Stat3 plasmid loading onto the GO–PEI–PEG–FA complexes, a gel electrophoresis assay was performed to assess the efficiency of transfection between the complex and the plasmid at different mass ratios (in Fig. 8). We added 1 μg plasmid to the different nanocomposite mixes, 20 μL in total and incubated them for 30 min at room temperature. The si-Stat3 plasmid loaded onto GO–PEI–PEG–FA complexes of different PEI weight ratios (1![[thin space (1/6-em)]](https://www.rsc.org/images/entities/char_2009.gif) :10, 1:20, 1:40, 1:60, 1:80 and 1:100) at various N/P ratios (1:0, 1:0.5, 1:1, 1:2, 1:3, 1:4, 1:5, 1:6, 1:8, 1:12, 1:16, 1:20 and 1:24). Then we observed the binding rate by 1% agarose gel electrophoresis with TAE buffer for 20 min at 120 V. Finally, the gel was analysed by atomic force automated imaging system (Tanon 2500R, Shanghai). SMMC-7721 cells were cultured in 6-well plates at a density of 5 × 10⁵ incubation of plasmid and GO–PEI–PEG–FA at ratios of 2:1 at room temperature after 30 min. We observed the transfection efficiency by fluorescence.
:10, 1:20, 1:40, 1:60, 1:80 and 1:100) at various N/P ratios (1:0, 1:0.5, 1:1, 1:2, 1:3, 1:4, 1:5, 1:6, 1:8, 1:12, 1:16, 1:20 and 1:24). Then we observed the binding rate by 1% agarose gel electrophoresis with TAE buffer for 20 min at 120 V. Finally, the gel was analysed by atomic force automated imaging system (Tanon 2500R, Shanghai). SMMC-7721 cells were cultured in 6-well plates at a density of 5 × 10⁵ incubation of plasmid and GO–PEI–PEG–FA at ratios of 2:1 at room temperature after 30 min. We observed the transfection efficiency by fluorescence.
2.6. Cell culture
The cells were cultured with Dulbecco’s modified Eagle medium (DMEM) containing 10% fetal bovine serum at conditions of 37 °C and 5% CO2.2.7. In vitro cytotoxicity assay
To detect cytotoxicity effect of GO–PEI–PEG–FA on SMMC-7721 cells, we performed 3-(4,5-dimethyl-2-thiazolyl)-2,5-diphenyl-2H-tetrazolium bromide (MTT) by microplate reader at 490 nm. SMMC-7721 cells were cultured in 96-well plates at a density of 1 × 10³ for 24 h. Cells were grown in different concentrations of gradient GO–PEI–PEG–FA (final concentration of 0, 20, 40, 80 and 160 mg L−1). MTT was added into each well in a 20 μL solution (5 mg mL−1, i.e. 0.5% MTT) 24 h later. MTT was incubated for 4 h and 100 μL DMSO was added to each well. Finally, we measured the absorbance of each well in the enzyme immunoassay analyzer at OD 490 nm.2.8. Western blot assay
The expression of the Stat3 protein was detected by western blot through collected tumor tissues from different groups. Stat3 nuclear protein was prepared for a western blot assay. Total protein (30 μg) was separated by 12% SDS-PAGE and transferred to PVDF membrane, which was incubated with rabbit anti-Stat3 antibody (1:2000) for 1 h. Then the PVDF membrane was incubated by goat anti-rabbit IgG-HRP (1:2000) for 1 h.
2.9. Instrumentation
UV-vis spectra was recorded on a Shimadzu UV-2550 spectrophotometer and Fourier transform infrared (FTIR) spectroscopy (VERTEX 70 FT-IR spectrophotometer, Bruker Optics) was performed by using powder-pressed KBr pellets for confirming the chemical conjugation of all complexes. The effective diameters and zeta potentials were measured using a Zeta sizer 3000 (Malvern, UK). Thermal gravimetric analysis (TGA) was performed on DSC/TGA 1600LF, METTLER TOLEDO instrument with a heating rate of 10 °C min−1 under nitrogen flow rate of 60 mL−1. The gel was analyzed by atomic force automated imaging system (Tanon 2500R, Shanghai). MTT assay was performed by microplate reader (BIO-RAD Model 550).3. Results and discussion
3.1. Preparation and characterization of the GO–PEI–PEG–FA complex
A novel GO–PEI–PEG–FA/si-Stat3 complex gene vector with a targeting function was synthesized successfully. The synthesis route consists of six steps (Scheme 1). (1) GO was prepared by modified Hummer’s method from natural graphite powder. (2) GO was converted to carboxylate GO (GO–COOH) using NaOH and ClCH2COONa. (3) GO–PEI was synthesized at different weight ratios i.e. 1:10, 1:20, 1:40, 1:60, 1:80 and 1:100 by forming an amide linkage using EDC/NHS coupling agent. (4) NH2–PEG–COOH was covalently linked with GO–PEI to obtain GO–PEI–PEG. (5) The amino end of GO–PEI–PEG was connected to FA to produce the final composite GO–PEI–PEG–FA. (6) The negatively charged si-Stat3 was loaded on the positively charged GO–PEI–PEG–FA via electrostatic interaction.
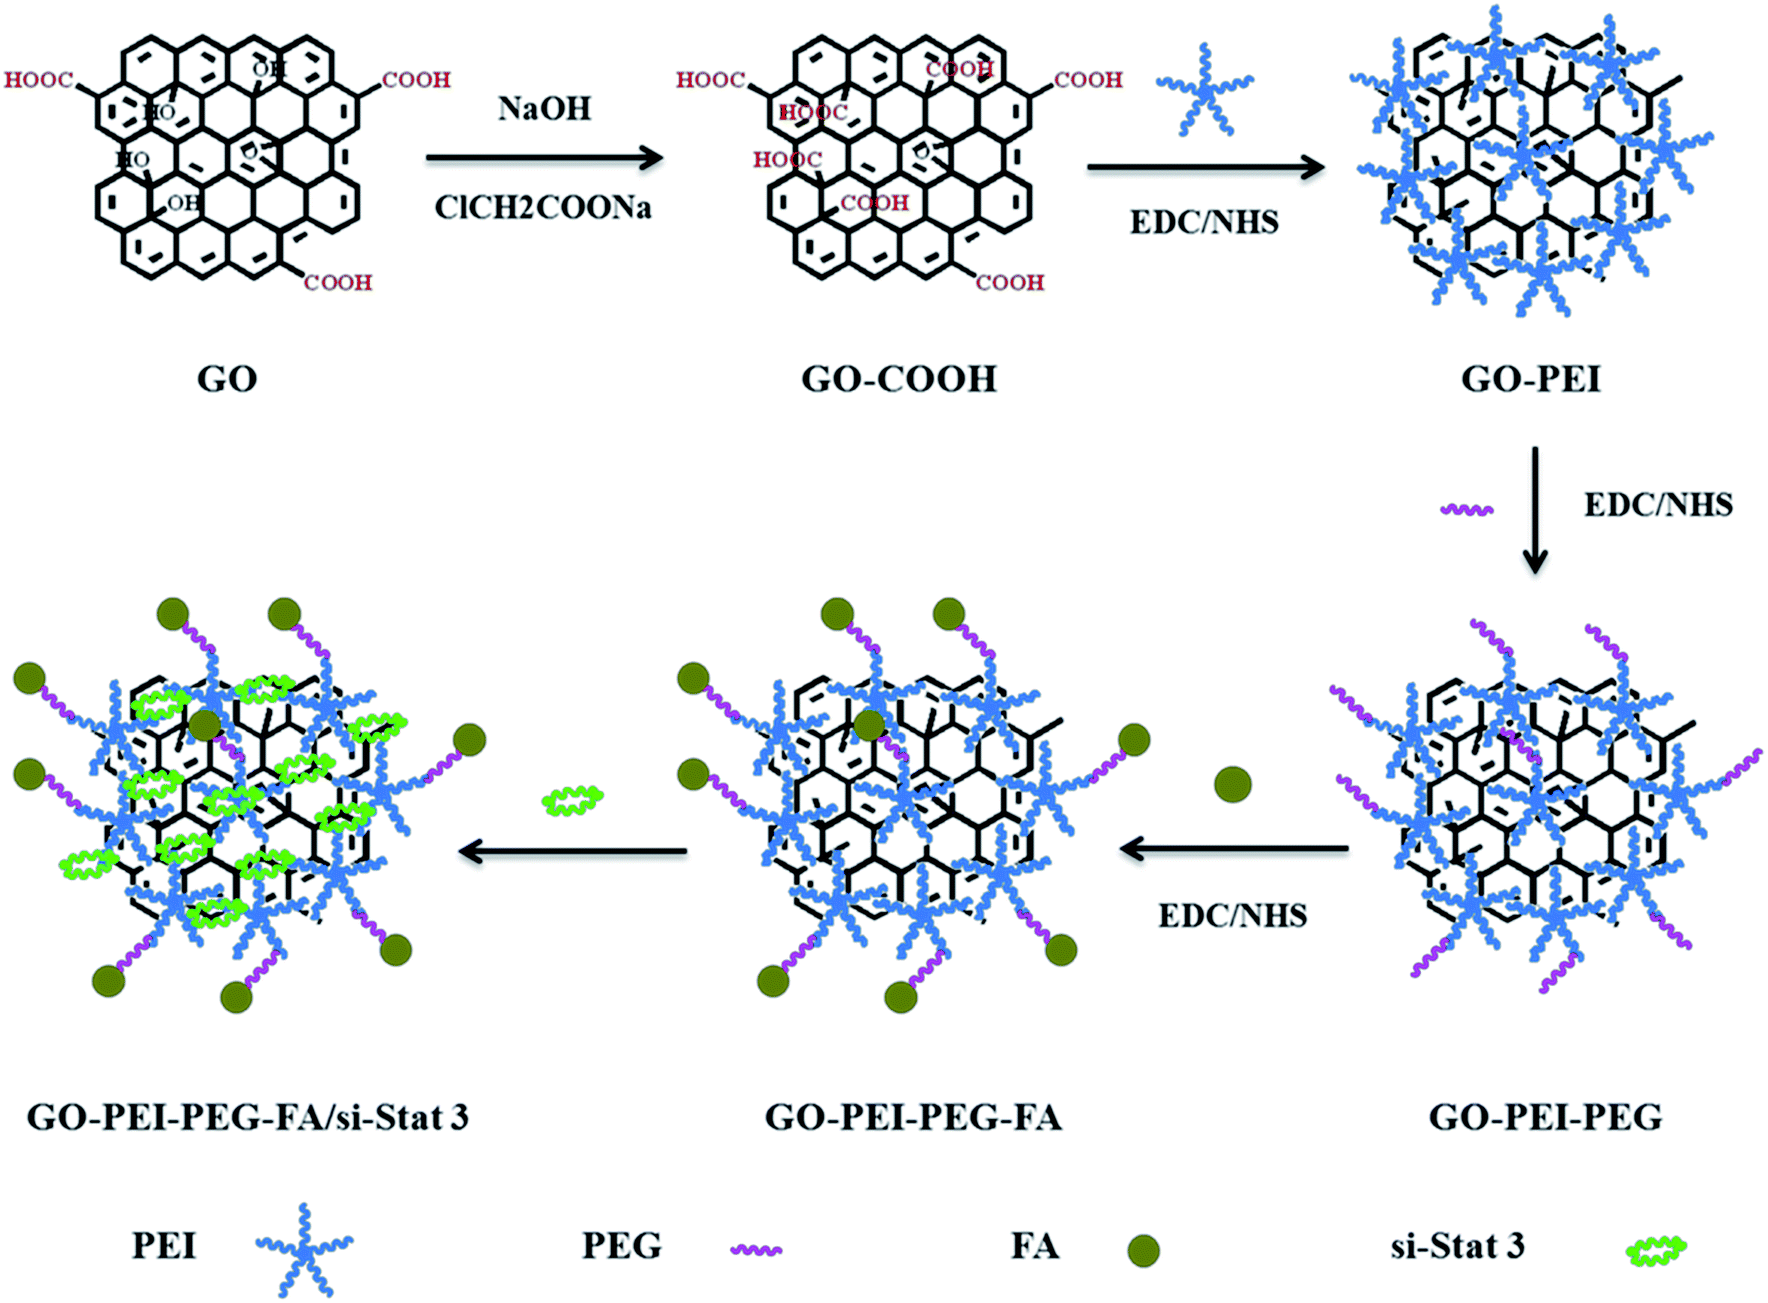 | ||
| Scheme 1 The synthesis processes of GO–PEI–PEG–FA/si-Stat3 complex. | ||
UV-vis spectroscopy was used to prove that PEI, PEG and FA were continuously covalently grafted on GO (Fig. 1). The spectrum of GO (Fig. 1a) exhibited a peak at about 230 nm, corresponding to the π–π* transitions of aromatic C–C bonds. The peak at 283 nm was attributed to FA (Fig. 1b). The appearance of a new peak at about 274 nm (Fig. 1e) was due to FA on GO–PEI–PEG. These results showed that FA was covalent grafted on GO–PEI–PEG successfully.
 | ||
| Fig. 1 UV spectra of GO (a), FA (b), GO–PEI (c), GO–PEI–PEG (d) and GO–PEI–PEG–FA (e). | ||
The chemical coupling of GO–PEI–PEG–FA was further characterized by FTIR spectroscopy (Fig. 2). The spectrum of GO (Fig. 2a) demonstrates the intense absorption peaks at 1725 cm−1, 1626 cm−1 and 1050 cm−1, which was assigned to C![[double bond, length as m-dash]](https://www.rsc.org/images/entities/char_e001.gif) O of carboxylic group, the CC vibration of aromatic rings and the vibration band of C–O–C respectively. In Fig. 2b, the GO–PEI spectrum showed vibration bands around 1650 cm−1 and 2900 cm−1 that correspond to the stretching of –NHCO– and N–H of PEI. At the same time, the characteristic absorption band at around 2873 cm−1 and 1107 cm−1 corresponded to the C–H bond of PEG (Fig. 2c) and the characteristic absorption band at about 1490 cm−1 was assigned to the phenyl ring of FA (Fig. 2d). These results suggested that GO–PEI–PEG–FA was successfully covalent coupled.
O of carboxylic group, the CC vibration of aromatic rings and the vibration band of C–O–C respectively. In Fig. 2b, the GO–PEI spectrum showed vibration bands around 1650 cm−1 and 2900 cm−1 that correspond to the stretching of –NHCO– and N–H of PEI. At the same time, the characteristic absorption band at around 2873 cm−1 and 1107 cm−1 corresponded to the C–H bond of PEG (Fig. 2c) and the characteristic absorption band at about 1490 cm−1 was assigned to the phenyl ring of FA (Fig. 2d). These results suggested that GO–PEI–PEG–FA was successfully covalent coupled.
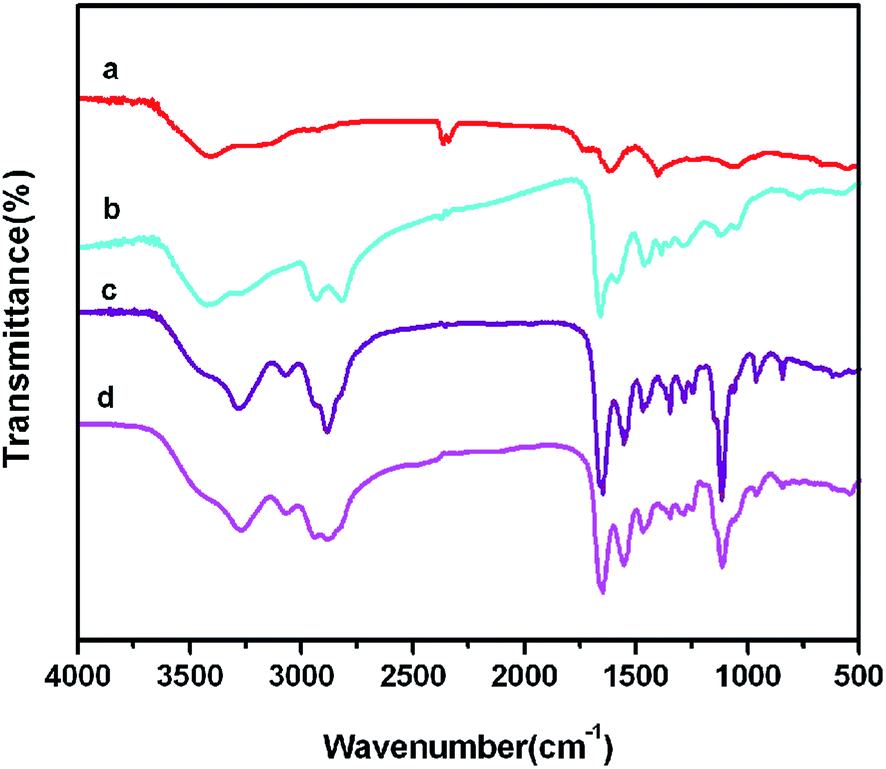 | ||
| Fig. 2 FTIR spectra of GO (a), GO–PEI (b), GO–PEI–PEG (c) and GO–PEI–PEG–FA (d). | ||
Thermogravimetric analysis (TGA) was used to evaluate the content of PEI grafted onto GO, as shown in Fig. 3. The TGA curve of GO (Fig. 3a) indicates that GO has 26 wt% weight loss at about 225 °C which is due to the loss of adsorbed water and oxygen-containing functional groups on GO such as hydroxyl and carboxylic groups. As can be seen from Fig. 3e, the decomposition of pure PEI is between 300 °C and 415 °C.
 | ||
| Fig. 3 TGA curves of the GO (a), GO–PEI of different weight ratio 1:10 (b), 1:40 (c), 1:80 (d) and PEI (e). | ||
After functionalization of GO with PEI, the GO–PEI complexes seem to have an obvious decomposition that occurs in two stages, one is the oxygen-containing functional groups on GO before 230 °C, the other arose from the grafted PEI at 300–415 °C. The content of PEI on GO could be calculated from weight loss at 300–415 °C of Fig. 3b–d. The content of PEI in GO–PEI with weight ratios of 1:10, 1:40 and 1:80 are about 35 wt%, 53 wt% and 61 wt% respectively. These results demonstrated that the content of GO–PEI increased with increasing weight ratio by strictly controlling the reaction conditions.
The effective diameters of GO–PEI, GO–PEI–PEG, GO–PEI–PEG–FA and GO–PEI–PEG–FA/si-Stat3 complexes at different weight ratios of PEI have been demonstrated by DLS in Fig. 4. The effective diameters of GO–PEI complexes at different weight ratios ranged from 1:10 to 1:100 changes from 515 nm to 310 nm, which is larger than the as-prepared GO (∼200 nm). Interestingly, we found that the effective diameters decreased until a point where it remained almost unchanged with a corresponding increase in the amount of PEI on GO. This phenomenon suggested that a series of GO–PEI complexes were prepared successfully. It was found that the effective diameters become larger than GO at low weight ratios of PEI, which may be due to the situ grafting of PEI between GO sheets to form the intercalated layer sandwiched structure: GO–PEI–GO/PEI–GO–PEI. The effective diameters of GO–PEI become smaller with the increasing weight ratio. It may be attributed to the increased amount of PEI on the GO sheets which strengthens the electrostatic interaction between the GO–PEI sheets. Electric repulsion made a GO–PEI complex form an exfoliated structure. Therefore, the GO–PEI sheets were unfolded at relatively low weight ratios with large effective diameters and the conformation of the sheet complexes show a change in the folding which leads to the effective diameters becoming smaller until they remain unchanged. When the weight ratio reached 1:60–1:100, the GO–PEI complexes may form a coil structure of PEI chains wrapped with GO sheets. After conjugating GO–PEI with PEG, FA and plasmid si-Stat3, the trends of the size change of the complexes are nearly the same as GO–PEI. Therefore, we could control the size of GO–PEI–PEG–FA/si-Stat3 at about 400–200 nm by adjusting the graft ratio of PEI on GO with a positive charge, which is beneficial for intracellular trafficking and cellular uptake.
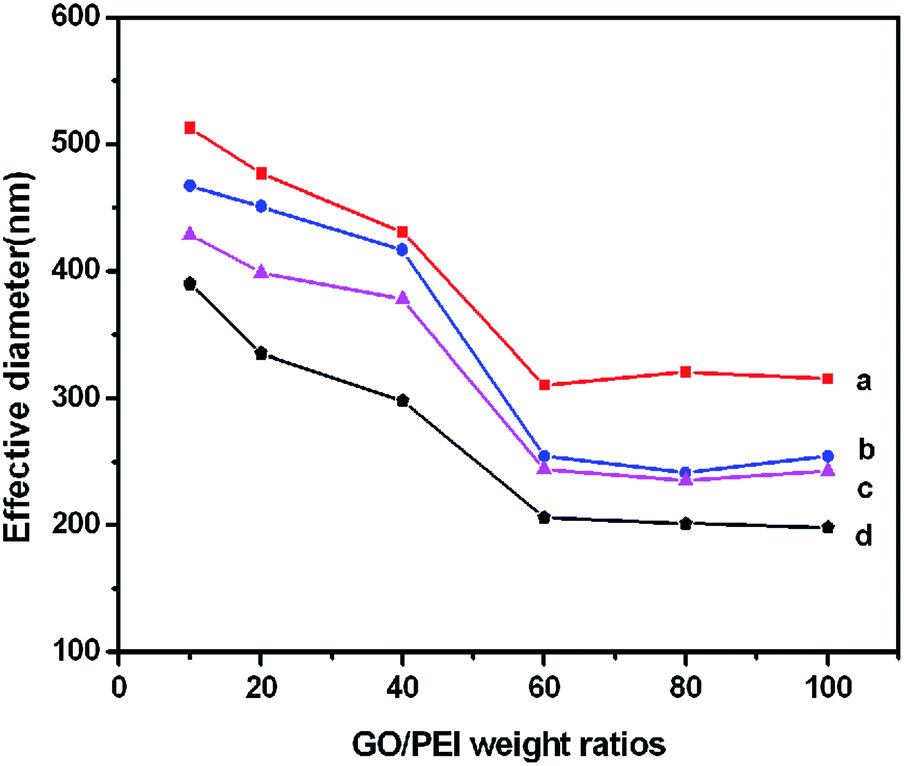 | ||
| Fig. 4 The effective diameters of GO–PEI (a), GO–PEI–PEG (b), GO–PEI–PEG–FA (c) and GO–PEI–PEG–FA/si-Stat3 (d) at different weight ratios of PEI. | ||
The surface charges of GO–COOH, GO–PEI, GO–PEI–PEG, GO–PEI–PEG–FA and GO–PEI–PEG–FA/si-Stat3 complexes were measured by zeta potential (Fig. 5). The GO suspension exhibits a highly negative charge about −39.8 mV, caused by the presence of hydrophilic carboxyl groups on the GO–COOH. The surface charges change to +52.1 mV after PEI is covalently grafted onto GO. After functionalization of GO–PEI with PEG and FA, the surface zeta potential is maintained at above +40 mV. The zeta potential of GO–PEI–PEG–FA/si-Stat3 complex at different weight ratios of PEI remains above +30 mV. The positive zeta potential of the GO–PEI–PEG–FA/si-Stat3 complex can promote attachment to the negatively-charged cellular membranes and achieve the cellular uptake of si-Stat3 complexes.
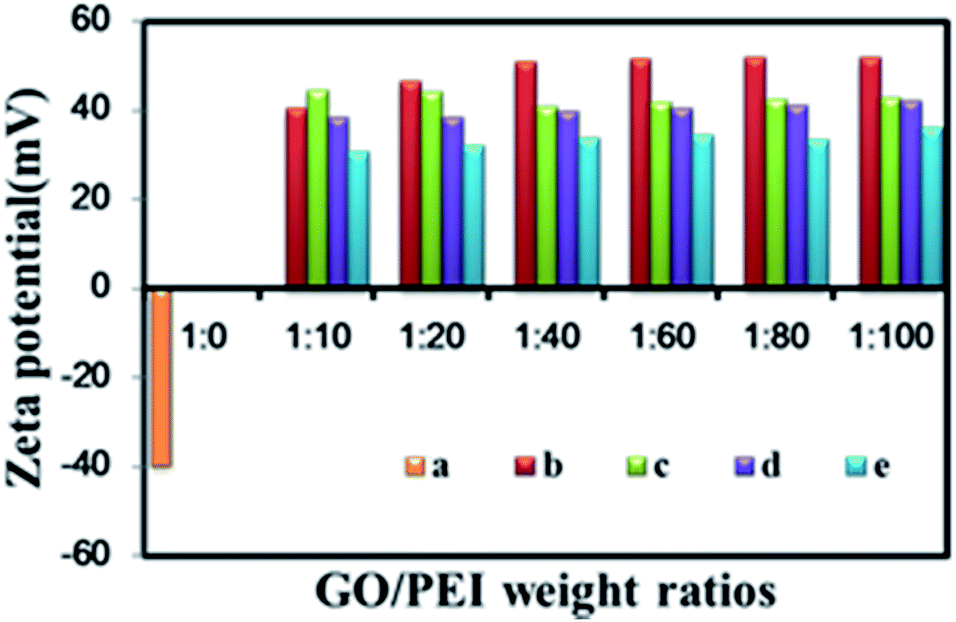 | ||
| Fig. 5 Zeta potential of GO (a), GO–PEI (b), GO–PEI–PEG (c), GO–PEI–PEG–FA (d) and GO–PEI–PEG–FA/si-Stat3 (e) at different weight ratios of PEI. | ||
Good biocompatibility of nanomaterials is necessary for its biological application. Accordingly, we investigated the colloidal stability of a series of GO–PEI–PEG–FA complexes with different weight ratio in PBS and DMEM (Fig. 6). Obviously, the complexes with the weight ratio of 1:10 appeared to be the most darkly colored solution. The color of the GO–PEI–PEG–FA complex dispersion became lighter with higher loadings of PEI, which was consistent with the results of the TGA (Fig. 3). After several months, noticeable aggregation at the weight ratios of PEI :1:10 and 1:20 were observed in DEME, and the remaining solutions displayed long-term stability. The occurrence of this phenomenon is due to the charge repulsion among the GO–PEI–PEG–FA complexes and their effective diameters. According to the Stokes–Einstein equation, the classical theory of colloids D = KT/6πηRh, (D: diffusion coefficient, Rh: hydrodynamic radius or effective diameters, T: temperature, η: solvent viscosity and K: Boltzmann constant), the particle velocity is inversely proportional to the hydrodynamic radius and solvent viscosity and is proportional to temperature.
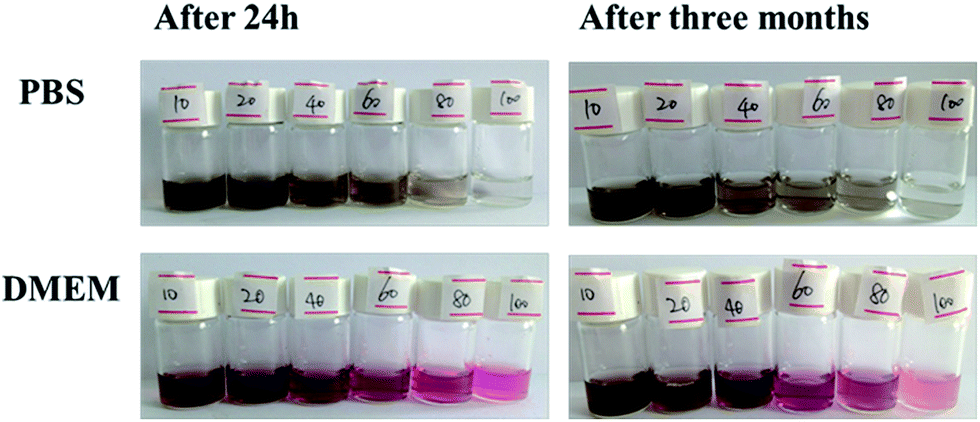 | ||
| Fig. 6 Colloidal stability of GO–PEI–PEG–FA in PBS and DMEM (0.4 mg mL−1) at different weight ratios of PEI. | ||
In our experiment, the aggregation of the GO–PEI–PEG–FA complex with a weight ratio at 1:10 and 1:20 in DMEM was due to the weak electrostatic interaction and the larger hydrodynamic radius which accelerated the particle sedimentation rate under the same experimental conditions as the others. Therefore, the solution stability of the complex was controlled by the particle size and electrostatic interaction among sample–sample and sample–solvent interactions. We could obtain a long-term stable colloidal solution even under physiological conditions by adjusting the different weight ratio of PEI.
3.2. Biological properties
The cytotoxicity of different concentrations of GO–PEI–PEG–FA complexes was evaluated with SMMC-7721 cells by cell viability assay in vitro (Fig. 7). MTT showed that relative cell viability was reduced to 10% when the different ratios of GO–PEI were 1:10 and 1:20. In contrast, the cell viability with GO:PEI at 1:100 was reduced to 65%. Meanwhile, the relative cell viability of 1:100 was reduced to 44% at concentrations of 80 and 160 mg L−1. From the cytotoxicity perspective, the results showed that the ratio of GO:PEI was too cytotoxic to SMMC-7721 cells at 1:100.
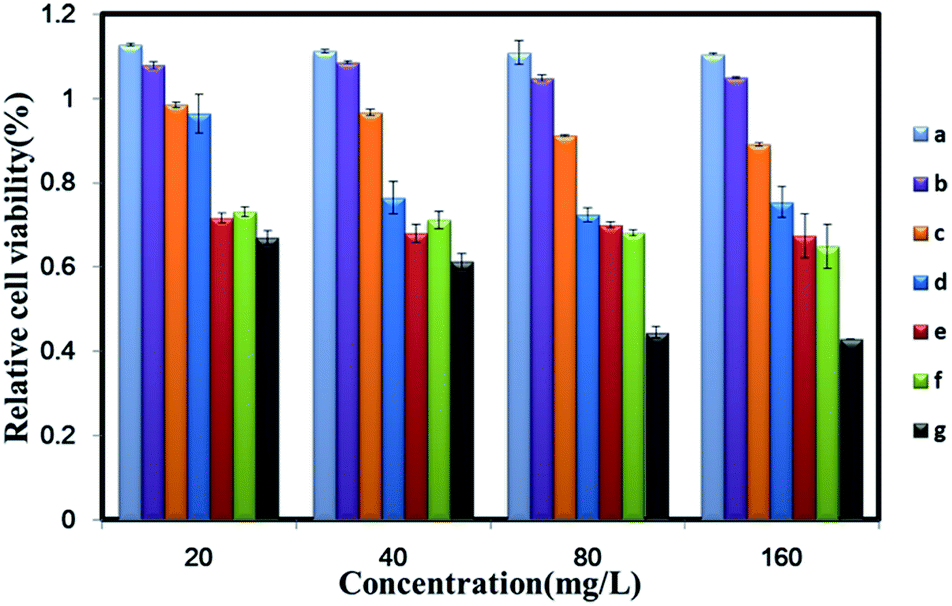 | ||
| Fig. 7 Relative cell viability showed the cytotoxicity of different concentration GO–PEI–PEG–FA at different weight ratios of PEI to SMMC-7721 cells. (a) was control, (b), (c), (d), (e), (f) and (g) was representative of the different weight ratios of PEI 1:10, 1:20, 1:40, 1:60, 1:80 and 1:100 respectively. | ||
DNA condensation ability is an important index of reaction material synthesis. The DNA condensation ability of nanoparticles loaded with si-Stat3 reflected the advantage of the nanocomposite, in other words, the higher the rate of DNA condensation ability, the more low cost the nanocomposite carrier. To obtain a higher efficiency among our complex substance, we further tested the DNA condensation ability by agarose gel electrophoresis (Fig. 8). 1.0% agarose gel electrophoresis showed lane 1 was naked si-Stat3 vector as control and lanes 2–6 was GO–PEI–PEG–FA/si-Stat3 complexes with different N/P ratio. (a), (b) and (c) showed si-Stat3 was loaded onto GO–PEI–PEG–FA completely at ratios of 1:20, 1:20 and 1:12 respectively. (d), (e) and (f) showed si-Stat3 was loaded onto GO–PEI–PEG–FA completely at ratios of 1:0.5 all. In summary, the different weight ratios of PEI with high combining efficiencies of GO–PEI–PEG–FA were 1:60, 1:80 and 1:100.
 | ||
| Fig. 8 Gel retardation analysis showed the DNA condensation ability of complexes at various N/P ratios of GO–PEI–PEG–FA and si-Stat3. (a), (b), (c), (d), (e), and (f) was representative of the different weight ratios of PEI 1:10, 1:20, 1:40, 1:60, 1:80 and 1:100 respectively. | ||
Furthermore, to detect the optimal makeup of nanocomplexes to efficiently deliver DNA into cells, the transfection efficiency was observed by inverted fluorescence microscopy (Fig. 9). Carrying the same amount of si-Stat3, different ratios of GO–PEI–PEG–FA complexes showed different transfection efficiencies in SMMC-7721 cells: the transfection efficiency of 1:10 and 1:100 GO:PEI was 10%, the transfection efficiency of 1:20, 1:40 and 1:80 of GO:PEI was 35%, 50% and 70% respectively. The results indicated that 1:80 of GO:PEI has the highest transfection efficiency. We found that the transfection efficiency was improved with the increasing of weight ratios of PEI as expected. According to the cytotoxicity results, the DNA condensation ability and the transfection efficiency, the most appropriate proportion of GO–PEI is 1:80.
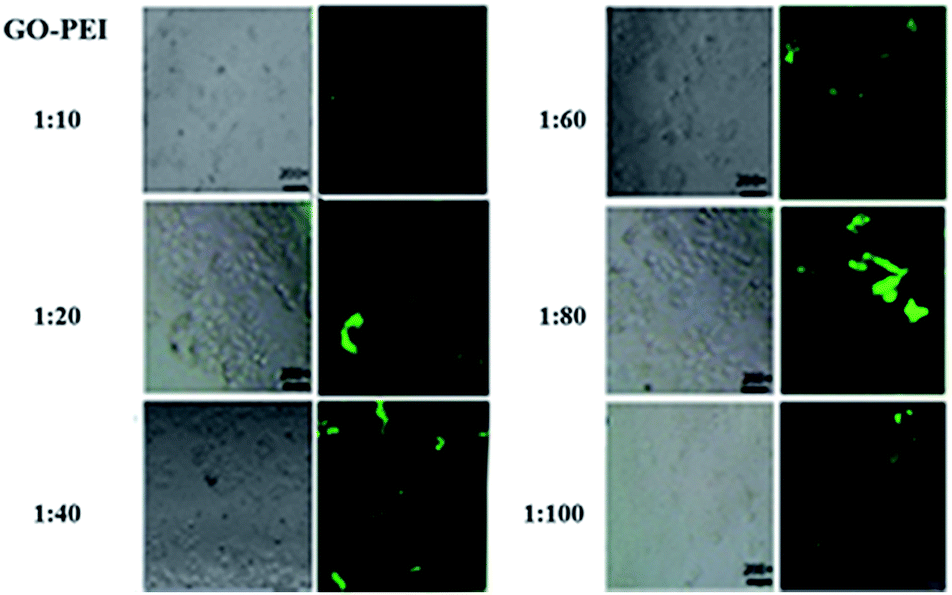 | ||
| Fig. 9 Inverted fluorescence microscope image of transfection efficiency of different ratios of GO–PEI–PEG–FA/si-Stat3 complexes carried the same quality si-Stat3 in SMMC-7721 after 72 h at different weight ratios of PEI. | ||
In order to verify the effect of the complex carrier delivering si-Stat3 in vitro, western blot results (Fig. 10) proved that expression of Stat3 in the GO–PEI–PEG–FA/si-Stat3 was significantly reduced compared with the other group. The results indicated the folate allowed better delivery of si-Stat3 into the SMMC-7721 cells reducing the protein expression more significantly.
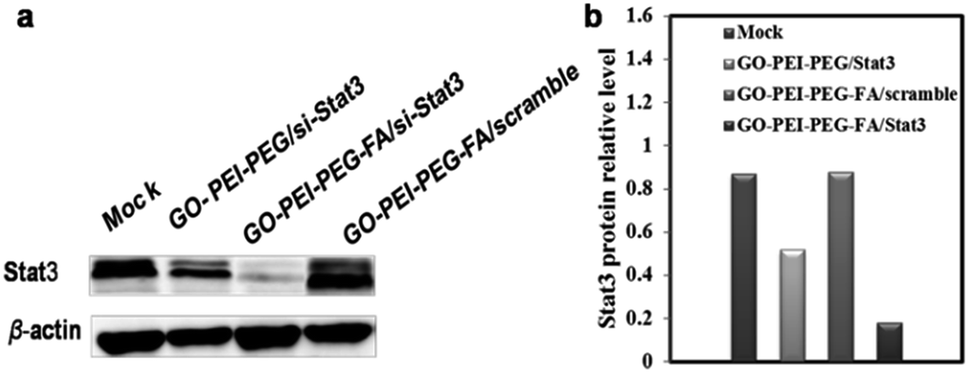 | ||
| Fig. 10 Western blot to investigate si-Stat3 related protein expression (a) and calculation of relative Stat3 protein expression in each group (b). | ||
4. Conclusions
In summary, we have synthesized a novel, effective and safe multi-functionalized GO–PEI–PEG–FA/si-Stat3 gene delivery vector for treating hepatocellular carcinoma successfully. The effective diameters of the as-prepared GO–PEI–PEG–FA/si-Stat3 complex could be controlled by the PEI content. The structure of the complexes was changed from an intercalated layer structure to a fully exfoliated structure with the increasing PEI content. The long-term stability of the complex in physiological conditions was realized, allowing for applications for gene delivery. It was found that the complex possess favorable properties of lower cytotoxicity and higher controllable transfection efficiency. Consequently, the as-prepared GO–PEI–PEG–FA/si-Stat3 silences si-Stat3 expression by targeted therapy. Further investigation will involve the exact release mechanisms and apoptosis of si-Stat3 from the complexes in vitro and in vivo.Acknowledgements
This work was funded by the National Natural Science Foundation of China (No. 81201188 and No. 81472344).Notes and references
- T. Niidome and L. Huang, Gene Ther., 2002, 9, 1647–1652 CrossRef CAS PubMed.
- Z. R. Yang, H. F. Wang, J. Zhao, Y. Y. Peng, J. Wang, B. A. Guinn and L. Q. Huang, Cancer Gene Ther., 2007, 14, 599–615 CrossRef CAS PubMed.
- D. E. Dorer and D. M. Nettelbeck, Adv. Drug Delivery Rev., 2009, 61, 554–571 CrossRef CAS PubMed.
- Y. M. Wang, W. L. Kong, Y. Song, Y. J. Duan, L. Y. Wang, G. Steinhoff, D. L. Kong and Y. T. Yu, Biomacromolecules, 2009, 10, 617–622 CrossRef CAS PubMed.
- O. Boussif, F. Lezoualc’h, M. A. Zanta, M. D. Mergny, D. Scherman, B. Demeneix and J. P. Behr, Proc. Natl. Acad. Sci. U. S. A., 1995, 92, 7297–7301 CrossRef CAS.
- J. Wang, X. He, Y. Zhang, H. Liu and Q. Yu, RSC Adv., 2015, 5, 59417–59427 RSC.
- P. Tian, M. Peng and L. Zhang, RSC Adv., 2015, 5, 34226–34236 RSC.
- H. Lv, S. Zhang, B. Wang, S. Cui and J. Yan, J. Controlled Release, 2006, 114, 100–109 CrossRef CAS PubMed.
- S. Jain, S. Kumar, A. K. Agrawal, K. Thanki and U. C. Banerjee, RSC Adv., 2014, 4, 59164–59174 RSC.
- S. M. Noh, W. K. Kim, S. J. Kim, J. M. Kim, K. H. Baek and Y. K. Oh, Biochim. Biophys. Acta, 2007, 1770, 747–752 CrossRef CAS PubMed.
- L. Feng, L. Wu and X. Qu, Adv. Mater., 2013, 25, 168–186 CrossRef CAS PubMed.
- L. L. Rouhana, J. A. Jaber and J. B. Schlenoff, Langmuir, 2007, 23, 12799–12801 CrossRef CAS PubMed.
- Z. Yu, Q. Xu, C. Dong, S. S. Lee, L. Gao, Y. Li, M. D’Ortenzio and J. Wu, Curr. Pharm. Des., 2015, 21, 4342–4354 CrossRef CAS PubMed.
- C. Engman, Y. Wen, W. S. Meng, R. Bottino, M. Trucco and N. Giannoukakis, Clin. Immunol., 2015, 160, 103–123 CrossRef CAS PubMed.
- Y. Wen and W. S. Meng, J. Pharm. Innov., 2014, 9, 158–173 CrossRef PubMed.
- X. Li, Y. Peng, J. Ren and X. Qu, Proc. Natl. Acad. Sci. U. S. A., 2006, 103, 19658–19663 CrossRef CAS PubMed.
- Z. Yu, R. M. Schmaltz, T. C. Bozeman, R. Paul, M. J. Rishel, K. S. Tsosie and S. M. Hecht, J. Am. Chem. Soc., 2013, 135, 2883–2886 CrossRef CAS PubMed.
- Z. Yu, R. Paul, C. Bhattacharya, T. C. Bozeman, M. J. Rishel and S. M. Hecht, Biochemistry, 2015, 54, 3100–3109 CrossRef CAS PubMed.
- R. Imani, S. H. Emami and S. Faghihi, Phys. Chem. Chem. Phys., 2015, 17, 6328–6339 RSC.
- K. S. Novoselov, A. K. Geim, S. V. Morozov, D. Jiang, Y. Zhang, S. V. Dubonos, I. V. Grigorieva and A. A. Firsov, Science, 2004, 306, 666–669 CrossRef CAS PubMed.
- A. K. Geim and K. S. Novoselov, Nat. Mater., 2007, 6, 183–191 CrossRef CAS PubMed.
- X. Li, X. Wang, L. Zhang, S. Lee and H. Dai, Science, 2008, 319, 1229–1232 CrossRef CAS PubMed.
- W. Song, D. W. Li, Y. T. Li, Y. Li and Y. T. Long, Biosens. Bioelectron., 2011, 26, 3181–3186 CrossRef CAS PubMed.
- B. Yuan, C. Xu, D. Deng, Y. Xing, L. Liu, H. Pang and D. Zhang, Electrochim. Acta, 2013, 88, 708–712 CrossRef CAS.
- Z. Liu, J. T. Robinson, X. Sun and H. Dai, J. Am. Chem. Soc., 2008, 130, 10876–10877 CrossRef CAS PubMed.
- X. Sun, Z. Liu, K. Welsher, J. T. Robinson, A. Goodwin, S. Zaric and H. Dai, Nano Res., 2008, 1, 203–212 CrossRef CAS PubMed.
- K. Yang, S. Zhang, G. Zhang, X. Sun, S. T. Lee and Z. Liu, Nano Lett., 2010, 10, 3318–3323 CrossRef CAS PubMed.
- X. Yang, Y. Wang, X. Huang, Y. Ma, Y. Huang, R. Yang, H. Duan and Y. Chen, J. Mater. Chem., 2011, 21, 3448–3454 RSC.
- N. G. Sahoo, H. Bao, Y. Pan, M. Pal, M. Kakran, H. K. Cheng, L. Li and L. P. Tan, Chem. Commun., 2011, 47, 5235–5237 RSC.
- M. Li, X. J. Yang, J. S. Ren, K. G. Qu and X. G. Qu, Adv. Mater., 2012, 24, 1722–1728 CrossRef CAS PubMed.
- B. Chen, M. Liu, L. Zhang, J. Huang, J. Yao and Z. Zhang, J. Mater. Chem., 2011, 21, 7736–7741 RSC.
- X. Yang, N. Zhao and F. J. Xu, Nanoscale, 2014, 6, 6141–6150 RSC.
- X. Y. Yang, X. Y. Zhang, Y. F. Ma, Y. Huang, Y. S. Wang and Y. S. Chen, J. Mater. Chem., 2009, 19, 2710–2714 RSC.
- Y. Song, K. Qu, C. Zhao, J. Ren and X. Qu, Adv. Mater., 2010, 22, 2206–2210 CrossRef CAS PubMed.
- L. Feng, S. Zhang and Z. Liu, Nanoscale, 2011, 3, 1252–1257 RSC.
- L. Zhang, Z. Lu, Q. Zhao, J. Huang, H. Shen and Z. Zhang, Small, 2011, 7, 460–464 CrossRef CAS PubMed.
- L. Feng, X. Yang, X. Shi, X. Tan, R. Peng, J. Wang and Z. Liu, Small, 2013, 9, 1989–1997 CrossRef CAS PubMed.
- J. Zhang, L. Feng, X. Tan, X. Shi, L. Xu, Z. Liu and R. Peng, Part. Part. Syst. Charact., 2013, 30, 794–803 CrossRef CAS.
- S. Y. Qin, J. Feng, L. Rong, H. Z. Jia, S. Chen, X. J. Liu, G. F. Luo, R. X. Zhuo and X. Z. Zhang, Small, 2014, 10, 599–608 CrossRef CAS PubMed.
- Y. Tao, E. Ju, J. Ren and X. Qu, Biomaterials, 2014, 35, 9963–9971 CrossRef CAS PubMed.
- A. Alshamsan, S. Hamdy, A. Haddadi, J. Samuel, A. O. S. El-Kadi, H. Uludağ and A. Lavasanifar, Clin. Transl. Oncol., 2011, 4, 178–188 CrossRef.
- L. Gao, L. Zhang, J. Hu, F. Li, Y. Shao, D. Zhao, D. V. Kalvakolanu, D. J. Kopecko, X. Zhao and D. Q. Xu, Clin. Cancer Res., 2005, 11, 6333–6341 CrossRef CAS PubMed.
- D. Yin, Y. Li, H. Lin, B. Guo, Y. Du, X. Li, H. Jia, X. Zhao, J. Tang and L. Zhang, Nanotechnology, 2013, 24, 105102 CrossRef PubMed.
- K. Chul Cho, J. Hoon Jeong, H. Jung Chung, C. O. Joe, S. Wan Kim and T. Gwan Park, J. Controlled Release, 2005, 108, 121–131 CrossRef PubMed.
- C. Chen, J. Ke, X. E. Zhou, W. Yi, J. S. Brunzelle, J. Li, E. L. Yong, H. E. Xu and K. Melcher, Nature, 2013, 500, 486–489 CrossRef CAS PubMed.
- L. Zhang, J. Xia, Q. Zhao, L. Liu and Z. Zhang, Small, 2010, 6, 537–544 CrossRef CAS PubMed.
- X. Yang, G. Niu, X. Cao, Y. Wen, R. Xiang, H. Duan and Y. Chen, J. Mater. Chem., 2012, 22, 6649 RSC.
| This journal is © The Royal Society of Chemistry 2016 |