An approach towards continuous production of silver nanoparticles using Bacillus thuringiensis†
Parth Sarthi Nayak‡
a,
Manoranjan Arakha‡a,
Ajeet Kumara,
Shreyasi Asthanaa,
Bairagi C. Mallickb and
Suman Jha*a
aDepartment of Life Science, National Institute of Technology Rourkela, Odisha 769008, India. E-mail: jhas@nitrkl.ac.in
bDepartment of Chemistry, Ravenshaw University, Cuttack, Odisha 753003, India
First published on 13th January 2016
Abstract
Applying the principles of green chemistry for the synthesis of nanoparticles (NPs) is an emerging field in the current era. Continuous production of NPs, i.e. simultaneous bacterial growth and NP production, if possible, would be more effective for different NP mediated applications. Hence, our approach here is to optimize the method to produce and extract silver nanoparticles (AgNPs) during growth of the bacteria Bacillus thuringiensis. The fabricated AgNPs were obtained when the bacteria were grown at a minimum inhibitory concentration of AgNO3 in culture medium. The microorganism produced elemental silver NPs with particular surface physico-chemical properties pertaining to the cellular moieties acting as a capping agent. Fabrication of the NPs was confirmed using UV-Vis absorbance spectra, attenuated total reflection Fourier transform infrared spectra, zeta analysis, and field emission scanning electron micrographs. The UV-Vis and IR studies together indicated the presence of proteins on the NP surface. The fabricated NPs were further purified using size exclusion chromatography (SEC), and the presence of the NPs in different elutions was further confirmed using UV-Vis, IR spectroscopes, and TEM. The yield, upon purification, was 98.75 μg of AgNPs from 500 mL of the culture, which is a relatively good yield. Additionally, the purified AgNPs were found to have a relatively stronger antibacterial activity against Escherichia coli than commercially available AgNPs. The work shows that a microorganism with resistance to significant concentrations of metal ions can be used for continuous production of metal NPs for industrial as well as biological applications.
1. Introduction
The advanced physico-chemical properties of metal NPs make them unique entities compared to bulk materials for various biomedical and pharmaceutical applications.1 Although, various physical and chemical methods are being optimized for engineering metal NPs, still the biological methods have drawn the attentions of different research groups working in this field to replace the traditional physical and chemical methods, which frequently use toxic chemicals, and produce wastes toxic to the environment.2,3 On the other hand, the biological methods, also known as green synthesis methods, are eco-friendly, safe, energy efficient, and less toxic than the other methods. Different biological agents have been used to fabricate NPs such as plant extracts, and extracts from microorganisms and fungi.2,4 Engineering metal NPs using microbes have significant advantages like being clean, non-toxic, eco-friendly, and it is also possible at ambient temperature and pressure.5,6 In the case of the fabrication of metal NPs, the physico-chemical properties of the NPs are preserved by the moieties acting as capping agents. It is well known that the physico-chemical properties of metal NPs can be affected, like the magnetic properties of iron NPs are lost upon air oxidation,7 the piezoelectric properties of ZnO NPs are affected by the variation in physico-chemical properties etc.8 The extraction, yield, and stability of metal NPs obtained through green synthesis have always been apprehended.9,10Among different metal and metal oxide NPs, AgNPs have drawn the attention of various research groups for various possible biological applications, such as nanomedicine, drug delivery, nanodevice fabrication, biosensing, catalysis, and imaging.11 AgNP synthesis using conventional methods involves chemical reduction in solution, the sonochemical method, microemulsion method, or microwave assisted method.12 AgNPs prepared through these methods are very labile for rapid dissolution into Ag(I) ions on suspension in polar media like water, and cause toxicity to cells, unless the NPs are capped with agents like TiO2, bacterial exopolysaccharides (EPS), biological moieties/biomolecules etc. The capping molecules make the dissolution rate slower, resulting in a longer half life of the particle.13 Thus, AgNP production using green synthesis methods has drawn the attention of various research groups to avoid these problems. It is well reported that the biological entities used for the green synthesis of NPs are enzymes and proteins which reduce the metal ions into elemental metal crystals, and control the size of the reduced metal crystals in nano-sizes, respectively.14 In addition to the above reasons, bacterial growth rate and low maintenance conditions have drawn attention towards the fabrication of metallic NPs using bacteria for various biological applications. The bacteria, growing in heavy metal rich environments, have also been shown to have the remarkable ability to reduce heavy metal ions, a property contributing to their use for NP synthesis and for the bioremediation of toxic metal ions.15 Although, various studies have been done to decipher the extracellular and intracellular synthesis of AgNPs from different bacteria like Pseudomonas stutzeri,16 Bacillus subtilis,17 Bacillus licheniformis,18 Bacillus cereus,19 Bacillus flexus,20 Plectonema boryanum,21 and Klebsiella pneumoniae,22 no studies have been done to obtain AgNPs from bacteria during their growth. Hence, we have made an attempt to synthesize NPs during the growth of bacteria, and termed the process as ‘continuous production of NPs’.
The Ag(I) ion, because of its toxic propensity, kills bacteria at very low concentrations and this makes it very hard to use in live bacteria for AgNP fabrication. However, bacteria with resistance to heavy metal ions or specifically growing in a Ag(I) ion rich niche can be used for the purpose. In our recent study, we found the resistance of B. thuringiensis to a relatively very high concentration of Zn(II)/ZnONPs.23 Hence, in this study, we used the same strain, relatively non-pathogenic B. thuringiensis, to fabricate AgNPs. The fabricated AgNPs were characterized using UV-visible and attenuated total reflection Fourier transform infrared (ATR-FTIR) spectroscopes, a zeta analyzer, field emission scanning electron microscope (FE-SEM), and transmission electron microscope (TEM). Later the purification of the fabricated AgNPs from the bacterial culture was done using SEC. In addition to this, sodium hexametaphosphate (SHMP) was used in the mobile phase to avoid the irreversible binding of AgNPs to the column, and for maintaining the monodispersivity of the NPs. However, the antimicrobial study using a LIVE/DEAD BacLight bacterial viability kit demonstrated the relatively stronger antibacterial activity of the fabricated AgNPs compared to the commercially available chemically synthesized AgNPs from Sigma-Aldrich. Thus, the study optimized a novel and new green synthesis protocol for AgNP synthesis from commonly available non-pathogenic bacteria B. thuringiensis. Hence, the method can be adopted for continuous production of AgNPs in a bio-fermenter.
2. Experimental
2.1. Materials and methods
Nutrient broth and tannic acid were purchased from Himedia, India, whereas glutaraldehyde and sodium hexametaphosphate (SHMP) were purchased from Merck, India. Silver nitrate (AgNO3) and sephadex (G-100) were purchased from Sigma Aldrich. Bacillus thuringiensis (MTCC 8998) was procured from the Institute of Microbial Technology, Chandigarh, India. All the formulations were prepared using deionised water, unless mentioned otherwise.2.2. Minimum inhibitory concentration of AgNO3 against B. thuringiensis
Initially, a minimum inhibitory concentration (MIC) of AgNO3 against B. thuringiensis was optimized to fabricate the AgNPs. Briefly, a B. thuringiensis mother culture was prepared by taking a loop full of bacteria from a slant culture, and inoculating into the nutrient broth followed by overnight incubation at 37 °C and 150 rpm orbital shaking. 50 mM AgNO3 stock solution was prepared by dissolving an appropriate amount of AgNO3 in sterilized deionised water. Different reaction mixtures were prepared in a 96-well plate, taking 20 μL of the mother culture in different AgNO3 concentrations, and the final volume was adjusted to 300 μL using the nutrient broth. Optical density at 600 nm was measured at regular time intervals for 24 h at 37 °C using a micro-plate reader (Synergy H1 hybrid reader, Biotek, USA). A MIC of 0.15 mM was determined from the average optical density (O.D.) at 600 nm of three independent triplicate reactions at late log phase with approximately 42% of the O.D. compared to the O.D. of untreated bacterial growth (Fig. 1a).2.3. Bacterial viability at the MIC value
The MIC value was further confirmed qualitatively as well as quantitatively by conducting a fluorescence microscopic study using a LIVE/DEAD BacLight assay. The LIVE/DEAD BacLight viable kit (L7007, Molecular probes, Invitrogen) was used to distinguish the viable cells from non-viable cells.23,24 Briefly, 30 mL of the B. thuringiensis culture was prepared by inoculating 1 mL of the overnight culture and adding 0.15 mM AgNO3, and allowing it to grow until the end of the log phase. Another 30 mL of the culture without AgNO3 was also prepared for a positive control. From each culture, 25 mL of the culture was centrifuged at 7000 rpm for 15 minutes. The pellet was collected, and resuspended in 2 mL of HEPES buffer (10 mM, pH 7.4, containing 150 mM NaCl). 1 mL of the B. thuringiensis cell suspension was added to 20 mL of HEPES buffer in a separate tube. The sample was incubated (mixing at every 15 minutes interval) for one hour at room temperature. The cells were washed two times with HEPES buffer by centrifuging and resuspending the pellet in 20 mL of HEPES buffer. Finally, the pellet was resuspended in 10 mL of HEPES buffer, and the O.D. was measured at 670 nm. 3 μL of the dye mixture was added to 1 mL of the above samples and incubated for 15 minutes in the dark, followed by imaging using a fluorescence microscope (Olympus IX71, Germany) with a 20× objective lens.2.4. Biosynthesis and purification of AgNPs from B. thuringiensis
From the MIC measurement, the AgNO3 MIC against B. thuringiensis was found at 0.15 mM, which was also further confirmed by the LIVE/DEAD BacLight assay. Hence, 0.15 mM AgNO3 was used for the synthesis of AgNPs during the bacterial growth in the culture medium. For the AgNP synthesis, 1 mL of the B. thuringiensis mother culture was added to 500 mL of the nutrient broth, and incubated at 37 °C, with 150 rpm agitation. Upon reaching the mid log phase of growth, the culture was supplemented with AgNO3 to attain a final concentration of 0.15 mM in the respective culture medium. The resulting culture was further incubated under the same conditions for an additional 24 h to get reduced elemental silver nanocrystals.The bacterial culture containing the reduced elemental silver nanocrystals was centrifuged at 6000 rpm for 30 minutes, followed by pellet collection, and resuspension of the pellet in 10 mL of deionised water. The suspension was sonicated for 30 minutes (at 80 amplitude) to disrupt the bacterial cell membrane, thus the intracellular NPs came in cell lysate. The suspension containing lysate was again centrifuged at 12![[thin space (1/6-em)]](https://www.rsc.org/images/entities/char_2009.gif) 000 rpm for 30 minutes, and the supernatant was collected and filtered using a 0.22 μm cut-off membrane filter. The filtered supernatant containing the NPs was stored at 4 °C for further analysis. The AgNPs from the above supernatant were further purified using SEC using 15 mL of sephadex G-100 resin soaked and washed with deionised water, and 10 mM sodium hexametaphosphate (SHMP) suspended in deionised water was taken as the mobile phase with a flow rate of 1 mL min−1.
000 rpm for 30 minutes, and the supernatant was collected and filtered using a 0.22 μm cut-off membrane filter. The filtered supernatant containing the NPs was stored at 4 °C for further analysis. The AgNPs from the above supernatant were further purified using SEC using 15 mL of sephadex G-100 resin soaked and washed with deionised water, and 10 mM sodium hexametaphosphate (SHMP) suspended in deionised water was taken as the mobile phase with a flow rate of 1 mL min−1.
2.5. Characterization of the AgNPs
AgNP samples collected before and after the SEC were analyzed using different biophysical techniques. The surface plasmon resonance properties of the AgNPs were analyzed using a UV-Vis spectrophotometer (Cary 100, Agilent Technology, Singapore), whereas the stability of the NPs was analyzed depending on the surface potential values measured using the zeta analyzer (Malvern Zetasizer, Nano ZS90, Netherland). The bond level characterization of the possible molecules responsible for the reduction of Ag(I) into elemental Ag(0) and the AgNP fabrication was done using an ATR-FTIR spectroscope (Alpha ATR-FTIR, Bruker, Germany). The bond vibrations were measured by putting a sample over a diamond platform with 128 scans at 2 cm−1 resolutions in the range of 2000–500 cm−1.To check the morphology of the fabricated AgNPs, bacterial samples from the early stationary phase of bacterial growth kinetics in the absence and presence of 0.15 mM AgNO3 were taken for FE-SEM (Nova Nano SEM 450, FEI company) analysis. The bacterial samples taken for FE-SEM analysis were appropriately fixed using glutaraldehyde and tannic acid, as described in the published literature.23 However, 10 μL of the SEC elutions were directly put on glass slides for imaging without any fixing. Both kinds of the samples were scanned at 10 kV accelerating voltage after gold coating for 3 minutes. For the TEM imaging, the SEC load and elutions (1–4) were centrifuged at 12![[thin space (1/6-em)]](https://www.rsc.org/images/entities/char_2009.gif) 000 rpm for 45 minutes, at 4 °C. The pellets were resuspended in deionised water prior to coating on a carbon grid. The grids were scanned for AgNPs using TEM (FEI Tecnai TF20, Netherland).
000 rpm for 45 minutes, at 4 °C. The pellets were resuspended in deionised water prior to coating on a carbon grid. The grids were scanned for AgNPs using TEM (FEI Tecnai TF20, Netherland).
Additionally, the concentration of the fabricated AgNPs after SEC was determined using an atomic absorption spectrophotometer (Perkin Elmer AA200, Singapore) using a specified cathode lamp with a corresponding wavelength. Before measuring the samples, the flame absorptions were calibrated using respective standard solutions in the range of 1–2 mg mL−1.
2.6. Antibacterial activity of purified AgNPs
The LIVE/DEAD BacLight viability assay is one of the important methods used to study the antimicrobial activity of various NPs. The impact of AgNPs on E. coli was studied using a LIVE/DEAD BacLight viability kit (L7007, Molecular probes, Invitrogen, USA) with the help of a fluorescence microscope with a 20× objective lens, as mentioned above. The samples were prepared for the fluorescence microscope following the protocol as described above. For a comparative analysis, we took commercially available AgNPs (product code-730785, Sigma Aldrich, USA) as a standard, and prepared the samples following the protocol, maintaining the concentration of both AgNPs at 9.2 μg mL−1.3. Results and discussion
3.1. MIC of AgNO3 against B. thuringiensis
As expected, the bacteria show significant resistance to Ag(I) ions. From the growth kinetics, when the O.D. at 600 nm from the stationary phase was plotted against the AgNO3 concentration, a MIC of 0.15 mM was observed (Fig. 1a). However, the kinetics experiment was performed in triplicate to further strengthen the observation. The spectroscopic data were further supported by microscopic data; the BacLight assay was performed at the MIC, i.e. at 0.15 mM AgNO3. Interestingly, the bacterial population was equally populated with viable and non-viable cells, when they were grown at the MIC. The viable cells with intact membranes are stained green by the syto9 dye fraction present in the mixture of dyes used in the BacLight assay (Fig. 1b-I). On the other hand, the non-viable cells with depolarized membranes are stained red by the propidium iodide dye fraction present in the mixture of the dyes (Fig. 1b-II).23 However, in Fig. 1b-II there is a relatively small, but significant, number of cells which have co-localized dyes. This finding can be rationalized either as the co-localized/overlaid viable and non-viable bacterial cells during the slide preparation, or the cells undergoing viable to non-viable phase transitions within the reading time frame (transient cells). Nevertheless, the population fractions shared by the viable, non-viable and transient cells exist as 40![[thin space (1/6-em)]](https://www.rsc.org/images/entities/char_2009.gif) :
:![[thin space (1/6-em)]](https://www.rsc.org/images/entities/char_2009.gif) 40
40![[thin space (1/6-em)]](https://www.rsc.org/images/entities/char_2009.gif) :
:![[thin space (1/6-em)]](https://www.rsc.org/images/entities/char_2009.gif) 20 at the scale of 100 (Fig. 1b-II), which clearly strengthens the MIC value concluded from the growth kinetics experiment (Fig. 1a).
20 at the scale of 100 (Fig. 1b-II), which clearly strengthens the MIC value concluded from the growth kinetics experiment (Fig. 1a).
The silver ion is a well-known antimicrobial agent. It interacts with sulphur containing proteins present in the cell wall and/or in cytoplasm, resulting in non-availability of the protein functions.13 That is not the only possible method by which silver triggers the non-viability of bacterial strains. The presence of silver ions also disrupts the electrochemical gradient in bacterial inter-membrane spaces leading to non-viable cells. Additionally, the presence of silver ions in a culture also results in an enhanced level of reactive oxygen species (ROS) that can also cause cell death through membrane depolarization.13 However, certain bacteria during the evolutionary screening adopted approaches like efflux pumps (Bacillus pumilus), reduction of toxic silver ions into non-toxic elemental silver (Pseudomonas stutzeri AG259) etc., which helped them to fight back against Ag(I) ion toxicity or to grow in a silver rich environment.13 In the latter case, the bacterium has a protein that is very specific for the silver ion, i.e. it has the silver-binding motif, AgBP2. The protein with the motif binds, and helps the bacterium to reduce the silver ions into non-bioavailable elemental silver crystals up to 200 nm in size.13 However, the interaction between the silver ions and silver ion specific proteins plays an important role in determining the fate of the bacteria upon interaction with the silver ions. As reported, the toxicity of the silver ion is closely related to the interaction of the silver ion with the thiol (sulfhydryl) group.25,26 Hence, the proteins containing amino acids like cysteine strongly interact with silver ions and neutralize the silver ions using reducing biological processes to prevent the Ag(I) dependent cell death. On the other hand, it is very interesting to note that amino acids with disulfide bonds and non-sulphur containing amino acids are totally unable to neutralize the silver ions against the bacteria.25 Hence, the bacterial protein plays a very important role in determining the toxicity of the silver ions.
In recent work on metal oxide NPs, we found that B. thuringiensis is relatively resistant to NPs and the respective metal ions that are formed upon the NP suspension into the culture.23 Hence, the bacterial resistance against metal ions and metal oxide NPs is used for this work to reduce the silver ions into elemental silver nanocrystals during the growth of the bacteria.27–29
3.2. Validation of the approach as a continuous process
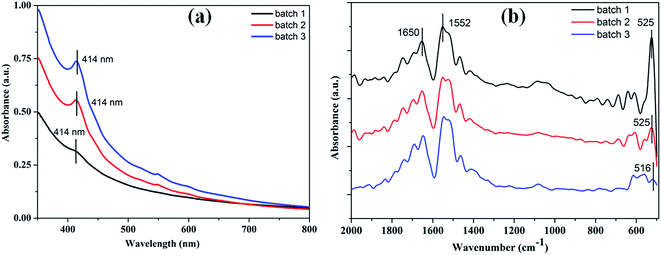
The primary aim of this study was to establish a platform for the large scale production of NPs, which will boost different industrial applications of the NPs. Many research groups4,5,30,31 have already established the synthesis protocols (both chemical and green synthesis) for production of AgNPs. However, most of the green synthesis protocols are based on batch culture techniques, using the bacterial cell mass in which the AgNP production is depleted after a certain time interval, hence compromising the industrial level applications of the AgNPs. Here, we have taken a step to create a platform for large scale production of AgNPs. The process was termed as ‘continuous production’ and we hypothesized that this study will be helpful for the large scale production of many NPs by adopting the protocol in a bio-fermenter. To prove the process is continuous, we performed three batch cultures by inoculating the culture with a previous culture (detail method in ESI†). The synthesis of the AgNPs in each culture was confirmed from the UV-vis spectra (Fig. 2a), where the SPR peak was found at 414 nm, and from the IR peaks within 800–500 cm−1 for the Ag–Ag and/or Ag–O vibration (Fig. 2b). Additionally, the number of live cells at the stationary phase (harvesting point) was evaluated using the BacLight viability assay, where we found more than 50% live cells in each culture. Additionally, Fig. 2a and b confirmed the synthesis of AgNPs in all the three cultures, while Fig. 3a–c confirmed the presence 53%, 64%, and 60% of viable cells in the first, second, and third batch cultures, respectively. However, the live cells found at the end of the third batch culture can be used, further, for the next batch culture to obtain AgNPs. The enhanced viability from culture 1 to the next cultures is dedicated to the propagation of a Ag(I) ion tolerant fraction in the cultures. To this end, if the approach is adopted in a bio-fermenter, harvesting 90–95% of the culture after 24 h of incubation, and supplementing 10–5% of the remaining culture with a fresh media of equal volume containing 0.15 mM Ag(I) ions for the next harvest after 24 h of incubation can be done for optimum continuous production of AgNPs. Hence, the findings clearly demonstrate that the protocol can be adopted in a bio-fermenter for large scale continuous production of AgNPs. | ||
| Fig. 3 BacLight fluorescence images of B. thuringiensis obtained from the end of different batch cultures containing 0.15 mM AgNO3 (a – batch 1, b – batch 2, and c – batch 3). | ||
3.3. Fabrication of AgNPs
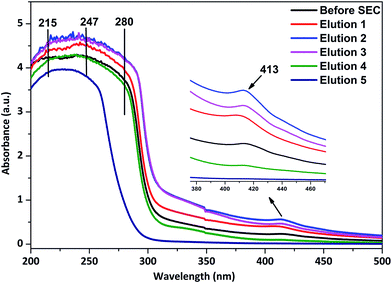
During the green syntheses of NPs using both plants as well as microorganisms, the moieties attached to the NP interface may vary from proteins to the phytochemicals present in cells. The moieties are responsible for either reducing the metal ion into elemental metal or capping the size of the elemental metal by reducing the free energy content upon the interactions. In both cases, the molecules attached to the NP surface are called nanoparticle corona, and consist of a loosely attached layer (soft core) and a tightly attached layer (hard core) of the corona.32 Here, the fabrication of AgNPs by different biomolecules was confirmed using UV-Vis and ATR-FTIR spectroscopic analysis.According to F. X. Schmid, the peptide groups present in the protein main chain have the potential to absorb strongly the far-UV light in a range of 180–230 nm, whereas the side chains of aromatic amino acids like Tyr, Trp and Phe absorb in the near-UV region of 240–300 nm.33 It is very interesting to observe the UV-Vis spectra of the AgNP samples, where we got absorbance maxima in between 215–247 nm along with the shoulder at ∼280 nm (Fig. 4). The data provide a clear indication of the presence of proteins in the AgNP samples. Moreover, as shown in Fig. 4, these findings remain unchanged for the AgNP containing elution samples obtained after the SEC. Additionally, the result is also supported by the IR (amide I and II band peaks in the range of 1650 and 1545 cm−1) and zeta potential results (Fig. 8 and Table 1, respectively), as well as the SDS-PAGE (sodium dodecyl sulfate polyacrylamide gel-electrophoresis) analysis as described in the ESI (Fig. S1†). The missing protein band or the protein band with lesser intensity than the control in the SDS-PAGE (Fig. S1, ESI†), confirmed the respective proteins are strongly attached to the AgNP surface forming a nanoparticle corona.
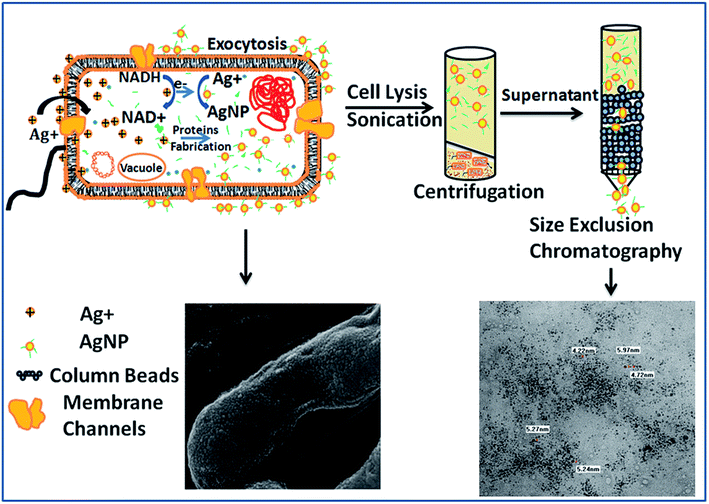
Based on the experimental results, we proposed a mechanism of the AgNP synthesis from the silver ions inside bacterial cells, and it is represented as a schematic diagram (Scheme 1). Here, we have divided the whole process into two important events, (i) the reduction of Ag(I) into elemental silver Ag(0), and (ii) the capping or ceasing of reduced silver element growth into nanocrystal sizes by the biomolecules, preferably by proteins present in the cell. In the first step, proteinaceous enzymes act as a reducing agent to convert the Ag(I) ions into elemental Ag(0). In the step, Ag(I) ions enter into the bacterial cell via different membrane channels called porins or diffuse because of the differential electromotive forces, followed by the reduction of the Ag(I) ions into metallic Ag(0) by accepting electrons from the NADH to NAD+ conversion.34 The conversion is assisted by the thiol containing proteins, which generally have a relatively higher binding potential for the Ag(I) ions.25 The absence of a reducing (neutralizing) propensity in the protein causes bacterial cell death, since the binding protein will not be available for the biological functions.25 Hence, the reduction is possible by NADH dependant reductase enzymes, only.
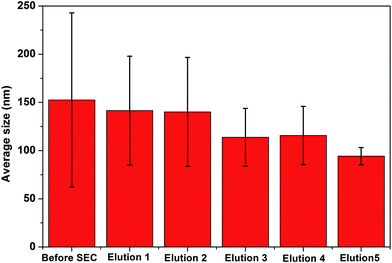
In the second step, nanoparticle–protein interactions play a vital role in stabilizing the growth of the elemental silver crystals in nanometer sizes, hence the nanocrystal or nanomaterial is formed. The fabricated NPs are capped by the Ag(0) specific or metal specific bacterial proteins, as discussed for the bacteria, P. stutzeri AG259.13 The proteins bind to the growing elemental crystals, and stabilize the growth in nanometer-size crystals. Because of the loosely attached moieties upon the nanoparticle surface, the hydrodynamic size of the particle is relatively higher with a significant deviation from standard nanoparticle sizes (Fig. 5). However, some of the protein capped NPs are secreted out to the bacterial surface via an exocytosis/cellular efflux system28,29 or other processes, and remain suspended in the bacterial culture or remain attached on the surface of the bacterial membrane as shown in FE-SEM image (Fig. 6b). Generally, NPs present in the supernatant or outside the cells are very dilute, having very low concentrations, and thus yield. To avoid the problem, the cells are lysed to harvest a relatively higher NP concentration. However, the optimized method, here, can be adopted in a bio-fermenter to get the NPs at the industrial scale using B. thuringiensis or Pseudomonas stutzeri AG259 or a similar kind of bacteria, which will also sort out the problem of the lower yield of the NPs through green synthesis methods.
3.4. Characterization of synthesized AgNPs
The photocatalytic activity of the metal NPs depends on the band gap energy of the NPs, i.e. the lower the band gap energy, the higher the photocatalytic propensity. Here, the band gap energy of the synthesized AgNPs is evaluated from UV-Visible spectra using the equation, Ebg = 1240/λ (eV),23 where Ebg is the band gap energy in eV and λ is the cut off wavelength (absorbance peak) in nanometers. For the fabricated AgNPs, the band gap energy (Ebg) before and after purification are found to be 3.00 eV, which is closest to the cited value in the literature, 2.6 eV.31,36
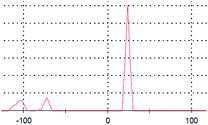
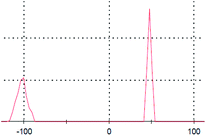
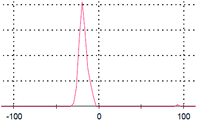
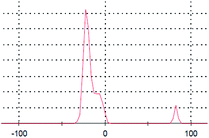
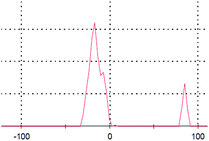
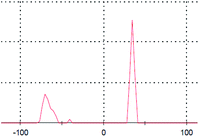
The presence of a negative surface potential in our data (Table 1) confirms the presence of AgNPs and cellular moieties with negative surface potentials. The data suggests that along with the negative value (26%), there is the presence of some particles that contribute to the positive surface potential (∼74%). The data confirmed that the moieties may be proteins, other cellular moieties or both with positive surface potentials. However, the significant improvement in dispersivity was observed with successive elutions. For example in elution 1, we observed the presence of 52.6% positive and 47.4% negative surface potentials, and this is due to the collection of molecules larger than the pores of the size exclusion resin. Molecules larger than the pores of the resin pass through the void volume of the gel. Interestingly, in elution 2, a 99.5% negative surface potential was found which is due to the presence of relatively pure AgNPs. The AgNP fraction in elution 2 moved through the largest pores of the resin, and eluted after the first elution. Elution 2 has only fabricated AgNPs, as confirmed by the UV-visible spectra. However, with successive elutions, the fraction of positive surface potential increased and the negative surface potential decreased. The change in fraction composition is due to the elution of smaller cellular moieties with respective surface potentials along the traces of smaller AgNPs.
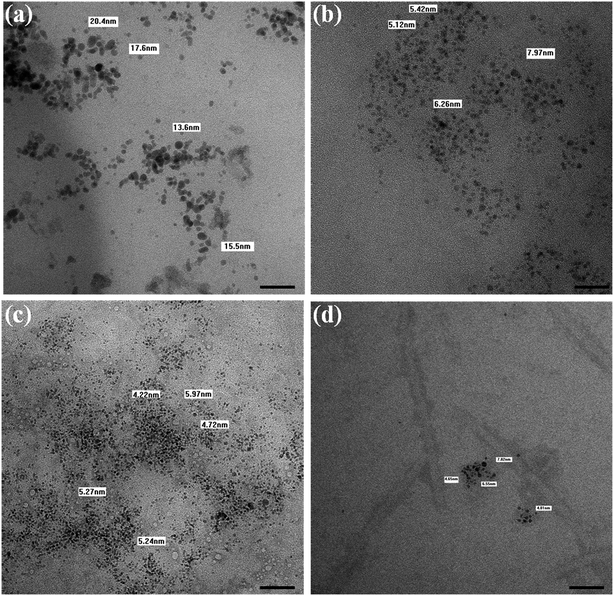 | ||
| Fig. 7 TEM images of the AgNPs. (a) before SEC, (b) elution 1, (c) elution 2, and (d) elution 3. The scale bar represents 50 nm. | ||
The particle size found using TEM or FE-SEM is smaller than the hydrodynamic size observed using the Zeta sizer. The difference in size can be attributed to the sample preparation and the principles followed by the techniques. FE-SEM, in general, gives a particular field image of the nanoparticles, but the Zeta sizer measures the hydrodynamic size of the particles in a respective medium, and gives the average of the particles coming in the light path, i.e. the average size of the predominant particle population. However, in solution, the particle size varies significantly because of the absorption of the moieties to different extents, to lower the free energy content. Hence, the zeta sizer indicated a fivefold higher size than the size observed in the images collected using FE-SEM/TEM. The data altogether indicate that B. thuringiensis when grown in the presence of 0.15 mM AgNO3, reduces the Ag(I) ions into elemental silver nanocrystals with an average size of 10–30 nm diameter, and the NPs are secreted outside of the cell along with the protein corona, like in Pseudomonas stutzeri AG259.13,26
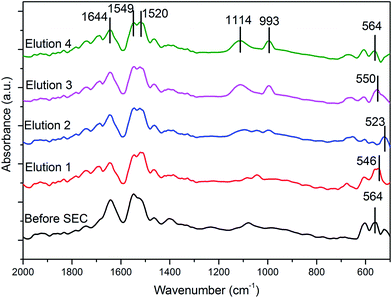
![[double bond, length as m-dash]](https://www.rsc.org/images/entities/char_e001.gif) O vibrations (amide I) and those at 1549 cm−1, and 1520 cm−1 are due to the N–H vibrations (amide II) confirming the presence of proteins in the eluted samples. Protein(s) present in the eluted samples are either part of the nanoparticle corona (hard or soft corona) or present in the bulk solution in equilibrium with the protein(s) present in the corona or both. Here, the proteins are either reducing the Ag(I) ions to AgNPs or acting as a capping agent or both. It has been reported that proteins can bind to NPs either through free amine groups, cysteine or hydroxide groups present in the proteins resulting in reduction of the particles free energy content, thereby stabilizing the NPs.39–41 Additionally, the strong peak at ∼1114 cm−1 for all the elutions indicated the presence of SHMP on the NP interface as well as in the bulk solution. Additionally, upon purification using SEC, the concentration of the AgNPs, 9.875 ppm or 9.875 μg mL−1, was observed using atomic absorption spectroscopy.
O vibrations (amide I) and those at 1549 cm−1, and 1520 cm−1 are due to the N–H vibrations (amide II) confirming the presence of proteins in the eluted samples. Protein(s) present in the eluted samples are either part of the nanoparticle corona (hard or soft corona) or present in the bulk solution in equilibrium with the protein(s) present in the corona or both. Here, the proteins are either reducing the Ag(I) ions to AgNPs or acting as a capping agent or both. It has been reported that proteins can bind to NPs either through free amine groups, cysteine or hydroxide groups present in the proteins resulting in reduction of the particles free energy content, thereby stabilizing the NPs.39–41 Additionally, the strong peak at ∼1114 cm−1 for all the elutions indicated the presence of SHMP on the NP interface as well as in the bulk solution. Additionally, upon purification using SEC, the concentration of the AgNPs, 9.875 ppm or 9.875 μg mL−1, was observed using atomic absorption spectroscopy.
3.5. Antimicrobial activity of purified fabricated AgNPs
The antibacterial activity of the biofabricated AgNPs was evaluated using a LIVE/DEAD BacLight bacterial viability fluorescence kit. According to the assay, when bacterial cells are stained with this dye, they show green fluorescence for the live cells with intact membranes, or red for the dead cells with deformed membranes. Hence, it is considered a suitable dye to study the antimicrobial activity, which gives both a qualitative and quantitative analysis of the antimicrobial activity. Fig. 9a and b show the fluorescence images of the intact and purified AgNP treated E. coli cells. A statistical analysis using ImageJ42 software reveals that the control of E. coli contains 100% green cells, interpreting 100% live cells, whereas the purified AgNP treated E. coli culture contains a mixture of green (∼45%) and red cells (∼55%) (Fig. 9b). The result indicated that the presence of 9.2 μg mL−1 of the fabricated AgNPs in the E. coli culture reduced the viability of the bacterium to only 45%. A comparative analysis with the commercially available AgNPs from Sigma (Fig. S2, ESI†) revealed that the fabricated AgNPs have relatively stronger antibacterial activity. The stronger antimicrobial activity of the fabricated AgNPs can be attributed to additive effects of the nanoparticle corona and the nanoparticle.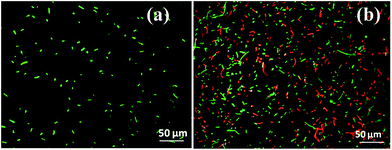 | ||
| Fig. 9 Fluorescence microscopy images of (a) intact E. coli, and (b) purified fabricated AgNP treated E. coli. | ||
4. Conclusion
The study optimized the protocol to fabricate metallic NPs using live B. thuringiensis, and purified the NPs in stable form. The NPs obtained were spherical in shape with 5–30 nm diameters. The yield of the nanoparticles (pure) obtained is 98.75 μg from 500 mL of the bacteria culture. Protein(s) present in the nanoparticle corona played an important role in the bioreduction of Ag(I) ions into AgNPs, and their dispersivity. The purified AgNPs showed relatively stronger antibacterial activity against E. coli than the commercially available AgNPs. The optimized process of obtaining eco-friendly, cost effective, and fabricated AgNPs can be used for large-scale production by adopting the protocol in a bio-fermenter.Acknowledgements
We are thankful to the Department of Ceramic Engineering, National Institute of Technology Rourkela, Odisha, India, for providing the FE-SEM facility for fulfilment of the research work. We are also thankful to Dr Mamata Mohapatra, Department of Hydro & Electrometallurgy, Institute of Minerals and Materials Technology, Bhubaneswar, Odisha, India, for providing the AAS facility. Additionally, we are also thankful to Dr Manidipa Banerjee, Kusum School for Biological Sciences, Indian Institute of Technology Delhi, for the image acquisition using the T.E.M. facility. For the financial support, we would like to acknowledge the Department of Science and Technology, Department of Biotechnology, and the Ministry of Human Resource and Development, Govt. of India, India.References
- M. J. Ahmed, G. Murtaza, A. Mehmood and T. M. Bhatti, Mater. Lett., 2015, 153, 10–13 CrossRef CAS.
- H. Duan, D. Wang and Y. Li, Chem. Soc. Rev., 2015, 44, 5778–5792 RSC.
- P. Banerjee, M. Satapathy, A. Mukhopahayay and P. Das, Bioresources and Bioprocessing, 2014, 1, 1–10 CrossRef.
- S. Behera, S. Jha, M. Arakha and T. Panigrahi, Int. J. Eng. Res. Appl., 2013, 3, 058–062 Search PubMed.
- V. L. Das, R. Thomas, R. T. Varghese, E. Soniya, J. Mathew and E. Radhakrishnan, 3 Biotech, 2014, 4, 121–126 CrossRef.
- C. Malarkodi, S. Rajeshkumar, K. Paulkumar, G. Gnanajobitha, M. Vanaja and G. Annadurai, Nanosci. Nanotechnol., 2013, 3, 26–32 Search PubMed.
- M. Arakha, S. Pal, D. Samantarrai, T. K. Panigrahi, B. C. Mallick, K. Pramanik, B. Mallick and S. Jha, Sci. Rep., 2015, 5, 14813 CrossRef CAS PubMed.
- M. Mahdavi, M. B. Ahmad, M. J. Haron, F. Namvar, B. Nadi, M. Z. A. Rahman and J. Amin, Molecules, 2013, 18, 7533–7548 CrossRef CAS PubMed.
- S. K. Balasubramanian, L. Yang, L.-Y. L. Yung, C.-N. Ong, W.-Y. Ong and E. Y. Liya, Biomaterials, 2010, 31, 9023–9030 CrossRef CAS PubMed.
- J. P. Novak, C. Nickerson, S. Franzen and D. L. Feldheim, Anal. Chem., 2001, 73, 5758–5761 CrossRef CAS PubMed.
- I. Sondi and B. Salopek-Sondi, J. Colloid Interface Sci., 2004, 275, 177–182 CrossRef CAS PubMed.
- N. Jain, A. Bhargava, S. Majumdar, J. Tarafdar and J. Panwar, Nanoscale, 2011, 3, 635–641 RSC.
- B. Reidy, A. Haase, A. Luch, K. A. Dawson and I. Lynch, Materials, 2013, 6, 2295–2350 CrossRef CAS.
- K. N. Thakkar, S. S. Mhatre and R. Y. Parikh, Nanomedicine: Nanotechnology, Biology and Medicine, 2010, 6, 257–262 CrossRef CAS PubMed.
- S. Iravani, Int. Scholarly Res. Not., 2014, 359316 Search PubMed.
- T. Klaus, R. Joerger, E. Olsson and C.-G. R. Granqvist, Proc. Natl. Acad. Sci. U. S. A., 1999, 96, 13611–13614 CrossRef CAS.
- N. Saifuddin, C. W. Wong and A. A. Yasumira, J. Chem., 2009, 6, 61–70 CAS.
- K. Kalimuthu, R. S. Babu, D. Venkataraman, M. Bilal and S. Gurunathan, Colloids Surf., B, 2008, 65, 150–153 CrossRef CAS PubMed.
- M. M. G. Babu and P. Gunasekaran, Colloids Surf., B, 2009, 74, 191–195 CrossRef CAS PubMed.
- S. Priyadarshini, V. Gopinath, N. M. Priyadharsshini, D. MubarakAli and P. Velusamy, Colloids Surf., B, 2013, 102, 232–237 CrossRef CAS PubMed.
- M. F. Lengke, M. E. Fleet and G. Southam, Langmuir, 2007, 23, 2694–2699 CrossRef CAS PubMed.
- A. R. Shahverdi, A. Fakhimi, H. R. Shahverdi and S. Minaian, Nanomedicine: Nanotechnology, Biology and Medicine, 2007, 3, 168–171 CrossRef CAS PubMed.
- M. Arakha, M. Saleem, B. C. Mallick and S. Jha, Sci. Rep., 2015, 5, 09578 CrossRef CAS PubMed.
- S. Liu, G. Huang, J. Yu, T. W. Ng, H. Y. Yip and P. K. Wong, ACS Appl. Mater. Interfaces, 2014, 6, 2407–2414 CAS.
- W. K. Jung, H. C. Koo, K. W. Kim, S. Shin, S. H. Kim and Y. H. Park, Appl. Environ. Microbiol., 2008, 74, 2171–2178 CrossRef CAS PubMed.
- R. H. Sedlak, M. Hnilova, C. Grosh, H. Fong, F. Baneyx, D. Schwartz, M. Sarikaya, C. Tamerler and B. Traxler, Appl. Environ. Microbiol., 2012, 78, 2289–2296 CrossRef CAS PubMed.
- F. Reith, B. Etschmann, C. Grosse, H. Moors, M. A. Benotmane, P. Monsieurs, G. Grass, C. Doonan, S. Vogt and B. Lai, Proc. Natl. Acad. Sci. U. S. A., 2009, 106, 17757–17762 CrossRef CAS PubMed.
- R. Ramanathan, M. R. Field, A. P. O’Mullane, P. M. Smooker, S. K. Bhargava and V. Bansal, Nanoscale, 2013, 5, 2300–2306 RSC.
- R. Ramanathan, A. P. O’Mullane, R. Y. Parikh, P. M. Smooker, S. K. Bhargava and V. Bansal, Langmuir, 2010, 27, 714–719 CrossRef PubMed.
- M. J. Ahmed, G. Murtaza, A. Mehmood and T. M. Bhatti, Mater. Lett., 2015, 153, 10–13 CrossRef CAS.
- D. D. Evanoff and G. Chumanov, ChemPhysChem, 2005, 6, 1221–1231 CrossRef CAS PubMed.
- V. L. Colvin and K. M. Kulinowski, Proc. Natl. Acad. Sci. U. S. A., 2007, 104, 8679–8680 CrossRef CAS PubMed.
- F. X. Schmid, Encyclopedia of Life Science, 2001, pp. 1–4 Search PubMed.
- Z. Sadowski, in Silver Nanoparticles, Intech, 2010 Search PubMed.
- A. Gupta, P. Singh and C. Shivakumara, Solid State Commun., 2010, 150, 386–388 CrossRef CAS.
- H. Kumar and R. Rani, Int. J. Eng. Innov. Technol., 2013, 3, 344–348 Search PubMed.
- H. Salem, K. Eid and M. Sharaf, Int. J. Drug Delivery, 2011, 3, 293–304 CAS.
- A. Saeb, A. S. Alshammari, H. Al-Brahim and K. A. Al-Rubeaan, Sci. World J., 2014, 704708 Search PubMed.
- A. Gole, C. Dash, V. Ramakrishnan, S. Sainkar, A. Mandale, M. Rao and M. Sastry, Langmuir, 2001, 17, 1674–1679 CrossRef CAS.
- N. Goswami, R. Saha and S. K. Pal, J. Nanopart. Res., 2011, 13, 5485–5495 CrossRef CAS.
- C. G. Kumar and S. K. Mamidyala, Colloids Surf., B, 2011, 84, 462–466 CrossRef CAS PubMed.
- C. A. Schneider, W. S. Rasband and K. W. Eliceiri, Nat. Methods, 2012, 9, 671–675 CrossRef CAS PubMed.
Footnotes |
| † Electronic supplementary information (ESI) available. See DOI: 10.1039/c5ra21281b |
| ‡ Authors made equal contribution to the work. |
| This journal is © The Royal Society of Chemistry 2016 |


