Assessment of SOC adsorption prediction in activated carbon filtration based on Freundlich coefficients calculated from compound properties

I. Slavik*ac, W. Uhlbc, H. Börnickd and E. Worchd
aWahnbachtalsperrenverband, Siegelsknippen, 53721 Siegburg, Germany. E-mail: irene.slavik@wahnbach.de
bNorwegian Institute for Water Research (NIVA), Gaustadalléen 21, 0349 Oslo, Norway
cTechnische Universität Dresden, Chair of Water Supply Engineering, 01062 Dresden, Germany
dTechnische Universität Dresden, Institute of Water Chemistry, 01062 Dresden, Germany

Received 10th October 2015 , Accepted 3rd February 2016

First published on 3rd February 2016


Abstract

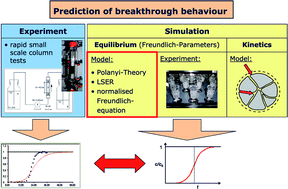
Three models using compound properties to calculate Freundlich constants for adsorption of SOCs on activated carbon were evaluated using data obtained from the literature and in our own experiments. The models are based on Polanyi's potential theory, Linear Solvation Energy Relationships (LSERs) and a solubility normalisation of the Freundlich equilibrium model. Using the extensive collection of data it could clearly be shown which datasets deviate from the general behaviour and that those deviations were due to methodical differences, rather than due to different behaviour of some compounds or random behaviour. However, the theories should not be used to predict Freundlich coefficients of complexing compounds such as EDTA. Model adequacy tests showed that the mass of compound adsorbed per mass of carbon was best described when Freundlich constants obtained from LSERs were used. The comparison of experimental and predicted breakthrough curves using equilibrium Freundlich constants from the three models investigated showed that the prediction of breakthrough behaviour based on Freundlich coefficients predicted from compound properties and the Linear Driving Force (LDF) model for the kinetics is suitable in terms of a conservative risk assessment. A general procedure is proposed to predict breakthrough of compounds for which Freundlich constants are not available.

Introduction

In drinking water treatment, synthetic organic compounds (SOCs) are usually removed by activated carbon filtration. For process control and to guarantee drinking water quality and safety, even in cases of accidental or intentional contamination, the adsorption behaviour of SOCs needs to be known. Despite the fact that adsorption is always competitive adsorption between SOCs and background organic matter in practice, single-solute adsorption studies are necessary to compare the adsorption behaviour of adsorbates or adsorbent performance and also to estimate input parameters for competitive adsorption modelling.

In practice, adsorption behaviour and consequently the effectiveness of activated carbon filtration is characterised by breakthrough curves as explained previously.1–3 Breakthrough curves can be determined experimentally by running pilot plants or by small-scale column tests. The latter is a time- and cost-saving alternative that allows the accurate or at least approximate prediction of the breakthrough of single solutes as well as of background organic matter.4–10 Such small-scale column tests can also be used to classify the breakthrough behaviour of SOCs.11–16

In addition, the simulation of breakthrough curves using modelling approaches such as the Linear Driving Force (LDF) model is possible. Using this model, intra-particle mass transfer can be described assuming that the uptake rate of a solute into an adsorbent is proportional to the difference between the solid-phase concentration on the adsorbent surface and the mean solid-phase concentration in the interior of the adsorbent.17 With the LDF model, external (film diffusion) as well as inner mass transfer processes (surface and pore diffusion) are considered. By means of a differential mass balance and including an equilibrium isotherm, the calculation of a travelling concentration front to describe breakthrough behaviour is possible.

The application of the LDF model requires adsorption equilibrium data and mass transfer coefficients. Mass transfer coefficients can be determined using empirical relationships from the literature.18–27 To describe adsorption equilibrium, numerous models can be used that are based on empirical, physicochemical and/or thermodynamic interrelations. These equilibrium models include inter alia the Langmuir isotherm,28 the Freundlich isotherm,29 and equations proposed by Dubinin and co-workers.30–32 Adsorption equilibrium data are needed in the LDF model, whereby usually Freundlich isotherm data are applied which are determined from batch experiments – a time-consuming and costly procedure.

Since models to predict Freundlich isotherm parameters exist, the simulation of breakthrough behaviour based on models without experiments is theoretically possible. A simulation of breakthrough behaviour that is based solely on compound characteristics is of special significance for such cases where prompt statements on adsorbability are required, even if the results are related to higher inaccuracies. This is especially the case when raw water contaminations occur due to accidents or premeditated attacks.

Different approaches to predict Freundlich parameters are described in the literature. The models include relations of adsorption parameters with available compound-specific parameters. One approach is the Polanyi potential theory that can be used to normalise aqueous-phase adsorption isotherms for numerous compounds, as applied by previous studies.33–36 By this theory, non-linear isotherms that are typical for adsorption from aqueous solutions onto activated carbon are well described based on the assumptions of heterogeneous adsorption energies and multiple-layer adsorption. Isotherm data are normalised, mostly by the molar volume of a solute, leading to a single characteristic curve in the ideal case. For this, adsorption isotherm data sets should include solutes, which are similar in size, structure and polarity.2,37–39 The characteristic curve describes the adsorption of different compounds onto a certain adsorbent.

In previous studies,40–42 a modified Freundlich equation was applied to model isotherm data by using adsorbate properties. In these studies, it was shown that normalising the equilibrium concentration of the adsorbate by the compound's aqueous solubility results in the collapsing of sorption isotherms of similar organic compounds. This modified Freundlich equation describes the relation between sorption capacity at a given concentration (Freundlich coefficient) and sorption nonlinearity (Freundlich exponent) in a quite simple and straightforward way.

While adsorption equilibrium is described in the form of adsorption isotherms in the Polanyi potential theory and in the modified Freundlich equation, Quantitative Structure–Activity Relationships (QSARs) can be used to describe adsorption by adsorbate–adsorbent interactions. This approach was applied for previous investigations.33,43–51 Linear solvation energy relationships (LSERs) as a specific form of QSARs allow the physical/chemical properties of substances, such as adsorbability, to be related to their molecular structure. LSERs reflect interactions between a molecule and the solvent by considering the energy required or released when electrostatic and hydrogen bonds are formed, as well as the energy necessary to surround a solute with solvent molecules. These interactions are described by four dimensionless energy terms. When using LSERs to predict the adsorption capacity with water/carbon partitioning constants log(qe/ce) or log[thin space (1/6-em)]KD, respectively, then only the linear part of an adsorption isotherm can be described as dependent variable, but not the nonlinear part. Previous studies33,51 used the carbon loading qe at equilibrium concentration ce as an independent variable to describe the adsorption equilibrium, whereas others46,48 considered the linearised Freundlich capacity constant log[thin space (1/6-em)]KF.

Data sets used so far for the modelling of adsorption equilibrium mostly include only few compounds compared to the vast number of organics being present in the aquatic environment which is still continuously increasing. Consequently, no study has yet proved a general validity of the models. Adsorption equilibrium data available in the literature are valid for the conditions of the experimental set-up only which is contradictory to a general validity and applicability of these models. Moreover, data reported in different literature sources offer large discrepancies, even if the same experimental conditions were applied.44

For water treatment, the prediction of breakthrough behaviour is the most important. However, although approaches to predict adsorption equilibrium data exist, they have not yet been evaluated for a simulation of the breakthrough behaviour of SOCs in activated carbon filtration.

Consequently, the objectives of this study were the following:

(i) The evaluation of three models for the calculation of Freundlich constants with respect to their applicability to describe adsorption equilibrium by comparing calculated amounts of solute adsorbed at equilibrium with experimental equilibrium data.

(ii) The evaluation of breakthrough behaviour predicted when using Freundlich constants obtained from the three different models by comparing them to breakthrough curves obtained in experimental small-scale filter tests.

(iii) The description of a general procedure for the prediction of breakthrough behaviour based on Freundlich coefficients calculated from compound properties.

For these purposes, correlations to predict Freundlich equilibrium constants were developed on the basis of data sets that included isotherm data from the literature and from own experiments. The Freundlich adsorption equilibrium constants were calculated for both individual substance groups and combined data sets. Using the calculated equilibrium constants, calculated isotherms were compared to the experimental data and the adequacy of the three models to yield the isotherm that is most similar to the one obtained experimentally was tested.

Following this, the calculated adsorption equilibrium parameters of 6 selected test compounds from the compound group of phenols were used in the simulation of their breakthrough behaviour in an activated carbon filter. For these compounds, the conditions of the experimental set-up (adsorption equilibrium batch tests and small-scale filter tests) were in accordance with those of the model development. Finally, the simulation results were compared to the experimentally determined breakthrough curves by means of filter run time to reach a 10% as well as an 80% breakthrough.

Theory

Model to describe adsorption equilibrium

To describe adsorption equilibrium one of the most commonly used isotherm models – the Freundlich model – was used. Its suitability to represent adsorption equilibrium data has been proven in numerous literature studies.40,52–64 The Freundlich model is an empirical isotherm equation that was developed assuming heterogeneous adsorption energies on the adsorbent surface, written as:
 
qeq = Kceqn (1)
or in the linearised form:
ln[thin space (1/6-em)]qeq = ln[thin space (1/6-em)]K + n[thin space (1/6-em)]ln[thin space (1/6-em)]ceq

In eqn (1), qeq is the amount of solute adsorbed on carbon at equilibrium, ceq is the bulk liquid-phase equilibrium concentration and K is the Freundlich constant that is related to the adsorption capacity. The parameter n is the Freundlich exponent giving an indication of the intensity or favourability of the adsorption process in relation to the surface heterogeneity.

Models to predict adsorption equilibrium in terms of Freundlich parameters

Polanyi potential theory. The Polanyi potential theory provides the basic mathematical form for the correlation as given in eqn (2):
 
image file: c5ra21005d-t1.tif(2)
where Vads is the volume of solute adsorbed, qeq is the amount of solute adsorbed on carbon at equilibrium, ρ is the density of the solute, V0 and A are empirical constants, where V0 can be considered as the maximum volume adsorbed. R is the ideal gas constant, T is the absolute temperature, S is the aqueous solubility of the solute, ceq is the bulk liquid-phase equilibrium concentration, and Vm is the molar volume acting as normalising factor. The term RT[thin space (1/6-em)]ln(S/ceq) is equivalent to the adsorption potential E of the Polanyi theory. The variables qeq and ceq have to be determined in batch experiments.

Eqn (2) relates the volume of solute adsorbed per mass of adsorbent, Vads, to isotherm data and properties specific for the respective compound. The empirical constants in eqn (2), which are V0 and A, can be determined from regression and as a result the so-called “characteristic curve” of the Polanyi potential theory is obtained.

Knowing the equation of the “characteristic curve” and the adsorptive properties molecular weight, solubility and density enables calculation of the Freundlich constants K and n using the following mathematical relationship:

 
image file: c5ra21005d-t2.tif(3)
 
image file: c5ra21005d-t3.tif(4)

Eqn (3) results from a coefficient comparison between eqn (2) and (1).

Solubility-normalised Freundlich model. In this approach, sorption isotherms are combined by normalising the equilibrium concentration ceq with the solubility S of a solute in water. In comparison to other models, the aspect of providing a simplified way to normalise and to model adsorption isotherms is a matter of particular interest. The main advantage is that the solubility is the only input parameter of this model besides the experimental isotherm data. For the regression analysis, the following modified Freundlich equation was used:
 
image file: c5ra21005d-t4.tif(5)
where K* and n* denote the unit-equivalent (modified) Freundlich coefficients. The regression curve was achieved by non-linear regression analysis. Combining eqn (1) and (5) and rearranging them results in equations that give the Freundlich parameters K and n:
 
image file: c5ra21005d-t5.tif(6)
 
n = n* (7)
Model using Linear Solvation Energy Relationships (LSERs). As described before, LSERs can be used to calculate capacities from the physicochemical properties of single solutes that consider relative strengths of adsorbent–adsorbate interactions. For this, correlations between adsorption affinity coefficients and LSER variables have to be established. However, these correlations can only be established by using one single numerical descriptor of adsorption. On the basis of the Freundlich isotherm, previous studies43,44,47 used qeq/ceq at the minimum concentration tested as a descriptor of adsorption since this term becomes constant, i. e. the isotherm becomes linear, at low concentrations.65,66 In contrast, other groups45,46,48,67–70 used the Freundlich constant K as a single descriptor of adsorption. A similar approach was proposed by another study49 who correlated LSER variables with an organic-carbon-based partition coefficient. Comparable to the study by Nguyen,49 Shih50 applied an interpolated adsorption coefficient Kd which was calculated from the best-fit Freundlich isotherm of each investigated sorbate at three levels of saturation. In keeping with these approaches, Zhang71 established correlations between solubility normalised Freundlich affinity coefficients and LSER variables, whereas de Ridder51 directly predicted the carbon loading qeq as single descriptor using a QSAR model. On the contrary, another study33 used LSER parameters within the Polanyi model instead of the molar volume as a normalising factor. However, this approach requires a special subroutine to determine the best-fit parameters of the nonlinear regression analysis causing limited applicability in water treatment practice.

Possibilities to calculate the Freundlich n-value from the Freundlich coefficient K by an empirical correlation are also discussed in the literature. Such an empirical relationship would have the advantage of avoiding the proposed separate correlation of the Freundlich parameters with LSER variables. However, other groups69,72,73 could not confirm the general validity of correlations in terms of n = −a[thin space (1/6-em)]log[thin space (1/6-em)]K + b. A previous study51 stated that there is no consistent relationship between the Freundlich constants, but both parameters are required for the description of adsorption equilibriums.

Since both Freundlich parameters are needed as descriptors of adsorption equilibrium for simulating breakthrough behaviour using the LDF model, correlations were established for both parameters in this study. For a better fit to the variables describing the linear relationships between adsorbate and adsorbent, the log-values of the Freundlich coefficients were used for the regression analysis to increase linearity between the dependent and the independent parameters. The following equations were established:

 
image file: c5ra21005d-t6.tif(8)
 
image file: c5ra21005d-t7.tif(9)

In eqn. (8) and (9) Vi is the intrinsic (van der Waals) molecular volume with 100 as scaling factor, π* is the polarity/polarisability parameter, β is the hydrogen-bonding acceptor parameter, α is the hydrogen-bonding donor parameter, and m, s, b, a, d are empirical constants with the index K relating them to the Freundlich coefficient K and with the index n relating them to the Freundlich exponent n.

Materials and methods

Adsorbates

The investigations within this study were performed using 98 organic compounds grouped in the following classes according to the investigations by Crittenden:33 (I) aliphatics, (II) aromatics and halogenated aromatics, (III) polyfunctional organic compounds and (IV) sulfonated aromatics. Furthermore, the groups of amines, phenols and pesticides were investigated. Correlations were determined using isotherm data of those 98 organic compounds. To correlate equilibrium data, the physical and chemical properties solubility (S), molecular weight (MW), and density (ρ) of the organic substances used for this study were obtained from a number of data sources.33,74–80 LSER parameters were calculated according to the rules of thumb developed by Hickey81 or taken from the literature.33,45,82

Adsorbent

The investigations were carried out with the commercial activated carbon Filtrasorb 300 (F 300, Chemviron). F 300 is made of fragments of hard coal and is activated by water steam. Because of its widespread application in water treatment and the use of different grain sizes of F 300 for many isotherm experiments in the recent past, this activated carbon was chosen as the standard adsorbent.

After grinding the raw material, the carbon was sieved. The sieve fraction of the carbon used in the experiments ranged from 0.3 to 0.4 mm. Before use, the carbon had to be pre-treated to remove fine particles and impurities (preloading). To avoid the wash out of interfering components under acidic conditions during the experiments, the carbon was washed with hydrochloric acid. As a result of systematic investigations, the following procedure was chosen as the optimal pre-treatment for the carbon:

(1) Sieving.

(2) Washing for 24 hours with 0.01 M hydrochloric acid.

(3) Rinsing with ultrapure water until no more fine particles are visible on the water surface.

(4) Treating in a Soxhlet-apparatus with ultrapure water for at least 30 hours, exchanging the wash water every 8 hours.

(5) Control of the DOC concentration of the exchanged wash water. Washing was continued until the difference between the DOC concentration of the wash water and of ultrapure water was less than 0.3 mg L−1.

(6) Drying of the carbon at 110 °C.

(7) Storage of the carbon in a desiccator until its final use.

Equilibrium data

Equilibrium isotherm data were determined in own lab-scale experiments as described below or taken from the literature.26,74,77,83–86 Altogether, 120 isotherm data sets were used within this study. Data from the literature were selected according to comparability with respect to the conditions of the experimental set-up. This means that all considered investigations were performed at room temperature (20–25 °C) on the activated carbon F 300 at initial concentrations within the range from 0.06 to 50 mg L−1.

The main characteristics of the experimental set-ups applied in the procedures to generate adsorption equilibrium data are summarised in Table 1. The compounds investigated by own lab-scale experiments are listed in Table 2.

Table 1 Experimental set-up characteristics to generate adsorption equilibrium data (adsorbent: activated carbon F300)a
Data source
  85 84 26 86 74 77 83 103 Own measurements
a n. a.: no data available. w. a.: without pH-adjustment. Alipha–X = halogenated aliphatic organic compounds. Ar, Ar–X, Ar–Sul = aromatics, halogenated aromatics, and sulfonated aromatics. poly-FG = polyfunctional organic compounds.
Class of compounds Ar–Sul Ar–X, poly-FG Alipha–X, poly-FG, Ar–Sul Poly-FG Alipha–X, Ar, Ar–X, poly-FG Alipha–X, poly-FG, Ar–Sul Ar–X, poly–FG, Ar–Sul Alipha–X Ar–X, poly-FG
No. of compounds 10 11 4 5 53 6 5 8 18
Initial concentration [mg L−1] 10 20 (DOC) 5–7 (DOC) 0.06–0.15 0.25–50 0.09–1.0 6–23 12 0.1–50
pH 7 2 5.6–8 7 3; 5.3; 7 n. a. 2 8.5–9.4 pKa – 2 or w. a.
Equilibrium time 48 h 14 d 12 d 6 d 2 h 2 d Or 10–12 d 5–14 d 1–7 d 2–8 w
Temperature [°C] 20 25 18–22 20 n. a. 20–25 n. a. 20 20–25
Particle size [mm] Powdered carbon 0.3–0.6 0.3–0.6 0.3–0.6 Powdered carbon (0.038–0.074) 0.3–0.6 or 0.4–0.6 Powdered carbon Powdered carbon 0.3–0.4
Analytical method HPLC DOC, UV-spectroscopy DOC, HPLC, UV-spectroscopy GC-MS GC, DOC, UV-/fluorescence spectroscopy GC, HPLC DOC, UV-spectroscopy DOC HPLC; UV-spectroscopy


Table 2 List of compounds investigated by own lab-scale experiments
Compound Abbreviation CAS-no. Molecular formula Molar mass in g mol−1
Phenol P 108-95-2 C6H6OH 94.1
2-Chlorophenol 2-CP 95-57-8 C6H5ClO 128.6
2-Nitrophenol 2-NP 88-75-5 C6H5NO3 139.1
3-Chlorophenol 3-CP 108-43-0 C6H5ClO 128.6
3-Nitrophenol 3-NP 554-84-7 C6H5NO3 139.1
4-Chlorophenol 4-CP 106-48-9 C6H5ClO 128.6
4-Nitrophenol 4-NP 100-02-7 C6H5NO3 139.1
2,4-Dichlorophenol 2,4-DCP 120-83-2 C6H4Cl2O 163.0
2,4-Dinitrophenol 2,4-DNP 51-28-5 C6H4N2O5 184.1
2,4,6-Trichlorophenol 2,4,6-TCP 88-06-2 C6H3Cl3 197.5
2-Methylphenol 2-MP 95-48-7 C7H8O 108.1
4-Methylphenol 4-MP 106-44-5 C7H8O 108.1
Atrazine Atr 1912-24-9 C8H14ClN5 215.7
Bromacil Brom 314-40-9 C9H13BrN2O2 261.1
Diuron Diuron 330-54-1 C9H10Cl2N2O 233.1
Isoproturon Isopr 34123-59-6 C12H18N2O 206.3
2-Nitroaniline 2-NA 88-74-4 C6H6N2O2 138.1
Iopamidol Iopam 60166-93-0 C17H22I3N3O8 777.1


Isotherm data in the form of the initial concentration c0, the adsorbate concentration at equilibrium ceq, and the mass of activated carbon m used from own isotherm experiments and from the literature sources summarised in Table 1 were used to calculate the amounts of solute adsorbed on the activated carbon qexp applying the mass balance equation:

 
image file: c5ra21005d-t8.tif(10)

In eqn (10), V is the volume of the adsorbate solution. The diagram of the obtained pairs of dependent (qexp) and independent (ceq) variables of eqn (10) gives the adsorption isotherm. For each compound, the Freundlich constant K and the Freundlich exponent n in eqn (1) were determined by non-linear regression as well as for the linear form of eqn (1). An evaluation of the respective regressions was performed using the coefficient of determination (R2) and the root-mean-square error (RMSE). The non-linear regression resulted in a slightly better representation of the experimental data. Therefore, the coefficients from non-linear regression were used in the following.

Isotherm experiments

Batch isotherm experiments were carried out in Erlenmeyer flasks applying varying doses of activated carbon whilst initial concentrations of the adsorbates were kept equal. The experimental set-up regarding initial concentrations, quantity of activated carbon and the volumes of the solutions are summarised in Table 3.
Table 3 Set-up of the batch isotherm experiments
Compounds Initial concentration Mass of activated carbon (lower and upper range) Volume of solution
Phenols and 2-nitroaniline 50 mg L−1 15 to 250 mg 300 mL
Phenols 5 mg L−1 1 to 100 mg 300 mL
Phenols 0.1 mg L−1 1 to 25 mg 500 mL
Pesticides and iopamidol 15 mg L−1 1 to 80 mg 300 mL


If necessary, the pH was adjusted by adding a phosphate buffer depending on the pKa dissociation constant of the respective compound. These pH adjustments guaranteed that only the non-ionic states of molecules were investigated in the adsorption experiments. All experiments were performed in the dark at room temperature (approximately 20 °C). Horizontally working shakers with a speed of 70 rpm ensured the mixing of the samples.

The time to reach equilibrium was determined in separate kinetic studies in 0.5 L Erlenmeyer flasks applying three different doses of activated carbon, whilst initial concentrations of the adsorbates were kept equal. Batch experiments were performed in duplicate for the compounds listed in Table 2. In these, the doses of activated carbon were chosen according to the carbon mass ranges of the subsequent isotherm experiments representing the lower, medium and upper range. At regular intervals, the residual adsorbate concentration was determined using HPLC and UV spectrophotometry at 254 nm until it reached a plateau phase. In order to ensure that bio-degradation processes could be excluded, an adsorbate solution without activated carbon was investigated in parallel each time as a blank.

Isotherm experiments were performed in duplicate and repeated once resulting in four isotherms of each adsorbate to ensure reproducibility. Reproducibility could only be achieved when the carbon was pre-treated according to the procedure described before and when the time to reach equilibrium was sufficient according to the kinetic studies. After equilibration, samples were membrane filtered using a cellulose nitrate filter with a pore size of 0.45 μm. The residual concentration of the compounds investigated was determined by HPLC with UV-VIS detection. In addition, UV254 was determined as additional parameter to identify trends and outliers. These isotherm data were then subjected to non-linear regression to determine the Freundlich coefficient K and exponent n.

Breakthrough curves

Breakthrough curves of the compounds 4-methylphenol, 3-chlorophenol, 3-nitrophenol, 4-nitrophenol, 2,4-dichloro-phenol and 2,4,6-trichlorophenol at initial concentrations of 50 mg L−1 were determined experimentally in a small-scale filter test according to a previous study.87 This filter test was used to estimate the performance of a technical adsorber within a very short period of time (ca. 5 days). Therefore, the main difference to test filters commonly used to accurately predict full-scale activated carbon performance, as for example the rapid small-scale column tests (RSSCTs) developed previously,16,88 is the shorter filter bed depth. The characteristics of the small-scale test filter applied are listed in Table 4.
Table 4 Characteristics of the small-scale test filter
Grain size 0.3 to 0.4 mm
Filter diameter 10 mm
Weight of carbon 1.65 g
Volumetric flow rate 8 mL min−1
Filter surface 0.79 cm2
Filter bed depth 4.2 cm
Filter volume 3.3 cm3
Filter flow rate 6.1 m h−1
EBCT (empty bed contact time) 24.5 s


The small-scale filter unit consisted of a glass tube filled with activated carbon, a feed reservoir, a dosing pump, and an effluent reservoir. Glass spheres, quartz fibres, and wire gauzes stabilised the filter bed within the glass tube. The filter tests were performed in the dark at room temperature (approximately 20 °C). Whilst measuring breakthrough curves, solutions of the selected organic compound were pumped through the small-scale test filter at flow rates of approximately 8 mL min−1. Samples of the outflow were taken at periodic time intervals until an almost complete breakthrough of the solute was obtained. The solute concentration in the samples was analysed using UV spectrophotometry.

The small-scale filter test was applied instead of an RSSCT since perfect similarity between the filter test and full-scale performance was not strictly necessary. The decisive point was the prediction of breakthrough behaviour of different compounds in a direct comparison to each other. This meant that only the order of breakthrough was of special interest within this study instead of the determination of real full-scale filter run time. Therefore, only the same transport mechanisms as those in a full-scale filter had to be simulated.

For the mathematical description of breakthrough behaviour, the Linear Driving Force model (LDF-model) as originally proposed by Glueckauf17 and being frequently used and discussed in the literature4,58,89–93 was applied. To model fixed-bed adsorption, mass transfer coefficients and equilibrium data are needed. The empirical correlation according to Wilson19 was used to determine the volumetric mass transfer coefficient of film diffusion kFaV. For the determination of the volumetric mass transfer coefficient of intra-particle transport kSaV, the correlation developed by Sierig26 was applied as follows:

 
image file: c5ra21005d-t9.tif(11)

In eqn (11), DL is the diffusion coefficient of the adsorptive in bulk solution in m2 s−1, c0 is the adsorptive initial concentration in mg L−1, rK is the grain radius of the adsorbent in m and q0 is the amount of solute adsorbed in mg g−1 as determined using the Freundlich isotherm.

In Table 5, the volumetric mass transfer coefficients used to simulate breakthrough curves and the initial concentrations of the experimental investigations performed in this study are listed.

Table 5 Volumetric mass transfer coefficients and initial concentrations of the compounds experimentally investigated within this study to simulate breakthrough behaviour
Compound Initial concentration c0 [mg L−1] kFaV [s−1] kSaV [s−1]
4-Methylphenol 48.8 0.582 8.09 × 10⁻⁵
3-Chlorophenol 49.2 0.524 7.58 × 10⁻⁵
3-Nitrophenol 48.7 0.492 7.58 × 10⁻⁵
4-Nitrophenol 47.2 0.505 6.82 × 10⁻⁵
2,4-Dichlorophenol 52.6 0.478 6.03 × 10⁻⁵
2,4,6-Trichlorophenol 47.8 0.463 4.70 × 10⁻⁵


Breakthrough behaviour was evaluated by means of filter run time until breakthrough at c/c0 = 0.1 and c/c0 = 0.8.

Statistics

For analysis of the experimentally obtained adsorption equilibrium data, the Freundlich parameters as well as their 95% confidence range were calculated using a function for univariate non-linear regression provided by the Mathematica® software (Wolfram Research, Inc.). The equations (slope and intercept) of the models used to predict the Freundlich parameters from compound properties were determined by univariate linear regression.

For 16 compounds, the calculated Freundlich adsorption equilibrium constants were used to calculate isotherms, meaning the relationship between the adsorbate concentration and the amount of solute adsorbed at equilibrium. The calculated amounts of solute adsorbed were compared to the experimentally determined values and assessed on the basis of the coefficient of variation of the root-mean-square error (cv(RMSE)), the coefficient of determination (R2) and the fraction of unexplained variance (FUV). The calculation of the Freundlich constants was based on a data set including polyfunctional compounds, except for phenol, where a data set only including phenols was used.

Furthermore, the relative error between the model based predicted Freundlich parameters (Kpred, npred) and the parameters calculated by the application of the Freundlich isotherm equation with experimentally determined data as basis (Kexp, nexp) was determined according to eqn. (12) and (13):

 
ErrorK = |(Kpred × 100%)/Kexp − 100%| (12)
 
Errorn = |(npred × 100%)/nexp − 100%| (13)

Results and discussion

Equilibrium data

Freundlich isotherm data of own experimental investigations are summarised in Table 6.
Table 6 Freundlich parameters and their 95% confidence ranges determined in own experiments
Compound group Compound Freundlich coefficient K [(mg g−1)/(mg L−1)n] Freundlich coefficient 95% confidence range Freundlich exponent n Freundlich exponent 95% confidence range
Phenols Phenol 68 66–70 0.26 0.25–0.27
2-Chlorophenol 198 191–206 0.18 0.17–0.19
2-Nitrophenol 137 129–145 0.32 0.29–0.34
2-Methylphenol 192 185–200 0.13 0.11–0.14
3-Chlorophenol 114 108–120 0.25 0.23–0.27
3-Nitrophenol 122 114–130 0.22 0.20–0.24
4-Chlorophenol 128 123–133 0.22 0.20–0.23
4-Nitrophenol 126 121–130 0.26 0.25–0.27
4-Methylphenol 143 138–148 0.18 0.16–0.19
2,4-Dichlorophenol 280 251–309 0.12 0.08–0.16
2,4.Dinitrophenol 185 175–195 0.28 0.25–0.30
2,4,6-Trichlorophenol 280 245–314 0.20 0.15–0.25
Pesticides Atrazine 195 178–213 0.18 0.13–0.22
Bromacil 178 156–200 0.26 0.20–0.32
Diuron 155 137–173 0.40 0.34–0.45
Isoproturon 167 123–211 0.25 0.13–0.37
Amines 2-Nitroaniline 109 95–122 0.27 0.22–0.32
Pharmaceuticals Iopamidol 97 75–119 0.35 0.25–0.45


Correlations using the Polanyi model

Applying the Polanyi potential theory on the data of own investigations and from the literature, different correlation calculations for the investigated data sets were performed. In Table 7, the groups of compounds considered with the respective number of compounds are listed together with the correlation results, i.e. the coefficient of determination (R2), the empiric constants V0 and A and the relative error between the model based predicted Freundlich parameters and the parameters calculated from experimental data. The empiric constant V0 was approximately in the same order of magnitude as described by ref. 33. Correlations for halogenated aliphatic organic compounds, amines and phenols resulted in the highest R2-values. The correlations appeared to be very weak when data of aromatics and halogenated aromatics as well as of polyfunctional organic compounds were used.
Table 7 Correlation results applying the Polanyi modela
a Alipha–X = halogenated aliphatic organic compounds. Ar, Ar–X, Ar–Sul = aromatics, halogenated aromatics, and sulfonated aromatics. Poly-FG = polyfunctional organic compounds.
Group of compounds Alipha-X Ar/Ar–X Poly-FG Ar–Sul Amines Phenols Pesticides All
Number of compounds 26 24 52 14 15 35 7 112
R2 0.86 0.09 0.08 0.55 0.84 0.67 0.29 0.32
V0 in cm3 g−1 1.02 0.15 0.17 0.25 1.05 0.60 0.37 0.34
A in cm3 J−1 0.02 0.003 0.004 0.02 0.02 0.01 0.03 0.01
ErrorK in % 242 189 37 52 62 59 123 737
Errorn in % 38 82 69 29 41 39 47 41


The relation between the adsorbed volume and the adsorption potential (normalised by the molar volume) is shown in Fig. 1 for polyfunctional organic compounds (poly-FG).


image file: c5ra21005d-f1.tif
Fig. 1 Correlation of isotherm data for polyfunctional organic compounds using the Polanyi model.

According to the Polanyi model, a linear relationship is expected due to eqn (2), ideally with all data points matched by the regression line. This was not the case for all of the compounds included in the data set of polyfunctional organics, resulting in the quite low coefficient of determination of only 0.08. As marked by ellipses in Fig. 1, the volumes adsorbed of EDTA, DDE, DDT and amines by Eppinger86 as well as of atrazine and diuron by Rabolt77 were clearly lower than those represented by the regression line. This means that it is not possible to represent the adsorption behaviour of compounds classified as polyfunctional organics by one regression line as intended by the Polanyi theory. Since the correlation for the group of amines resulted in a R2 of 0.84 (Table 7), it seems that grouping according to polyfunctional structures is too broad. To increase the accuracy of the Polanyi model results, it is therefore recommended to compose data sets for specific structures and functional groups (e.g. amino group, carboxylic acid group, phenyl group).

A further reason for deviations from the regression line can be attributed to differences in the conditions of the underlying isotherm experiments. Data for atrazine and diuron obtained by Rabolt77 can clearly be identified as outliers, whereas data for the same compounds but examined in own experiments cannot. As listed in Table 1, there are differences in the concentration ranges investigated by different authors, as well as the particle size of the activated carbon used, the pH-conditions and the definition of the equilibrium state. These different experimental set-ups result in differences in the isotherm equilibrium data and consequently in the Freundlich parameters. Therefore, it is not uncommon for the literature to provide Freundlich parameters that differ considerably in the order of magnitude for the same compound, even if the same carbon (F 300) is used. For example, for phenol, different K/n-data pairs are reported: 21/0.54,74 31/0.55,83 37/0.42,84 and 68/0.26 (own measurements). Comparable results were also found for other activated carbons: 30/0.87 for NAC 1240 and 53/1.34 for NAC D10.94

Since the experimental data (isotherm data) are part of the model equation (eqn (2)), the experimental set-up has a strong impact on the correlation results and the accuracy of the model. Consequently, in order to predict the adsorption of different compounds, such models are applicable at best when the adsorption conditions are equal or close to those at which the data underlying the correlation were generated.

Furthermore, there are some difficulties and conflicts in predicting the adsorption behaviour of special compounds, such as EDTA, which can occur in a dissociated or complex bound form depending on the matrix. Both states cannot be considered for the prediction of Freundlich coefficients.

To evaluate the impact of the compound properties on the correlation results, a sensitivity analysis was performed. For the correlation within the compound group phenols being exclusively based on data of our own measurements the properties, density and solubility were altered ±10% and ±50%, respectively, one at a time, in order to investigate the impact on the dependent variables. Table 8 lists the sensitivity analysis results.

Table 8 Effect of changes in compound density and solubility on the correlation results for phenols including exclusively own experimental data
Parameter Variation Correlation coefficient Dependent variable Standard deviation ErrorK Errorn
%   V0 in cm3 g−1 A in cm3 J−1 SDEV in % % %
  ±0 0.73 0.796 0.009 30 25 22
Density +10 0.56 0.596 0.008 40 109 46
−10 0.56 0.696 0.009 40 109 46
Solubility +50 0.73 0.859 0.009 30 25 22
−50 0.73 0.696 0.009 30 25 22


The results of the sensitivity analysis demonstrate that the density used within the Polanyi model is of high significance towards the correlation results. A 10% variation of the density results in a much higher error for the Freundlich coefficient K and exponent n, whereas a 50% variation of the solubility does not cause changes in the error of prediction. This significance of the density can be attributed to the fact that it is part of both the molar volume and the volume adsorbed. Therefore, errors in the determination of density cause greater deviations in the correlation results. Moreover, there can be a discrepancy if the compound density is used to describe the density of the compound in an adsorbed state. For this reason, it is possible that the compound density is not the most suitable value to be applied in the Polanyi model.

Correlations using the modified Freundlich model

The calculation of Freundlich parameters was also performed by normalising isotherm data with the compound's solubility. The correlation coefficients, the modified Freundlich parameters and the percentage error of the Freundlich parameters for the compound groups investigated are listed in Table 9.
Table 9 Correlation results applying the modified Freundlich modela
a Alipha–X = halogenated aliphatic organic compounds. Ar, Ar–X, Ar–Sul = aromatics, halogenated aromatics, and sulfonated aromatics. Poly-FG = polyfunctional organic compounds.
Group of compounds Alipha–X Ar/Ar–X Poly-FG Ar–Sul Phenols
Number of compounds 26 24 48 14 35
R2 0.69 0.19 0.27 0.10 0.74
K* 3294 245 602 134 1212
n* 0.59 0.13 0.22 0.12 0.25
ErrorK 292 245 76 43 59
Errorn 67 68 36 30 34


The best correlation results were obtained for phenols and halogenated aliphatic organics which is reflected in the R2 of 0.74 and 0.69, respectively. Although there was no good correlation (R2 = 0.27) between the normalised concentration and the amount of solute adsorbed (carbon loading, qeq) for the group of polyfunctional organic compounds, most isotherm data are close to the regression line, as shown in Fig. 2. Deviations from the regression line can be observed for the same compounds that also caused discrepancies using the Polanyi model.


image file: c5ra21005d-f2.tif
Fig. 2 Correlation of isotherm data for polyfunctional organic compounds using the modified Freundlich model.

As marked by ellipses in Fig. 2, for EDTA, DDE, DDT, amines obtained by Eppinger86 and atrazine and diuron obtained by Rabolt,77 the amounts of solute adsorbed were clearly lower than those matched by the regression line. This supports the conclusions drawn previously:

(i) Compound grouping should be based on a more limited variety of specific structures and functional groups (e.g. amino group, carboxylic acid group, phenyl group).

(ii) Differences in the conditions of the underlying isotherm experiments have a strong impact on the correlation results.

(iii) Equilibrium data of compounds with very special characteristics like the complexing compound EDTA may not be represented together with the data of other compounds by one regression line.

The calculation of carbon loadings (qeq) by means of the Freundlich isotherm equation (eqn (1)) using predicted Freundlich parameters and an equilibrium concentration (ceq) of 2 mg L−1 resulted in the expected orders of adsorption. Adsorbability increased with increasing hydrophobicity (polarity), molecular mass, degree of substitution, chain length and branching. These interrelations are known and extensively discussed in the literature.1,67,95,96 Since the characteristics of these compounds have an effect on solubility, a normalisation of isotherm data using the solubility consequently allows the prediction of adsorption behaviour to a certain degree. Consequently, with the modified Freundlich equation, adsorption processes can be modelled that are dominated by hydrophobicity. However, the estimation of adsorbability is limited for such compounds, of which adsorption is dominated by steric effects, polarisability or hydrogen-bonds.

An important disadvantage of the modified Freundlich model is that only one Freundlich exponent n can be calculated for a test data set. Furuya41 tried to compensate this disadvantage by additional correlation of the Freundlich exponent n with the electron density in the highest occupied molecular orbital (HOMO) of a compound to predict the Freundlich exponent from the adsorbate's molecular structure. This approach was not applied within the current study.

Correlations using LSERs

Table 10 lists the regression analysis results applying the LSER model for the groups of compounds investigated. In these investigations, the Freundlich parameters were correlated to terms describing interactions between a molecule and the solvent. A comparison of the calculated empiric constants mK, mn, sK, sn, bK, bn, aK, an, dK and dn allows evaluation of their relative importance to the dependent variables log[thin space (1/6-em)]K and log[thin space (1/6-em)]n, respectively. For the evaluation, the empiric constants have to be considered in relation with the LSER-parameters according to eqn (8) and (9).
Table 10 Correlation results applying the LSER modela
a Alipha–X = halogenated aliphatic organic compounds. Ar, Ar–X, Ar–Sul = aromatics, halogenated aromatics, and sulfonated aromatics. Poly-FG = polyfunctional organic compounds.
Group of compounds Alipha–X Ar/Ar–X Poly-FG Ar–Sul Amines Phenols Pesticides All
Number of compounds 26 24 51 14 15 35 7 112
R2 for K 0.60 0.48 0.35 0.74 0.91 0.46 0.98 0.50
R2 for n 0.68 0.33 0.12 0.07 0.63 0.06 0.94 0.33
ErrorK 93 93 33 20 39 45 22 113
Errorn 24 37 33 40 21 33 13 41
dK/dn −1.1/0.2 −0.02/−0.2 3.9/−0.9 2.9/−1.5 −0.6/0.2 3.0/−0.9 16.1/24.4 1.2/−0.4
mK/mn 7.8/−2.3 4.5/−1.2 1.0/0.1 2.6/−0.6 8.2/−2.6 2.1/0.1 0.5/−1.7 4.0/−0.6
sK/sn −0.4/0.5 1.9/0.6 0.3/−0.1 −0.1/0.1 0.2/−0.5 1.2/−0.5 −4.2/−8.0 −0.07/0.08
bK/bn −1.4/0.2 −1.8/0.04 −0.6/0.02 −0.8/−0.02 −3.0/1.1 −1.8/0.6 −12.6/−29.1 −1.0/−0.3
aK/an 0.7/0.2 0.8/−0.7 0.2/−0.5 0.6/0.4 1.3/2.0 −0.4/−0.2 32.4/77.6 1.4/−0.4


In eqn (8) and (9), the mVi term is a measure for the size of the intrinsic (van der Waals) molecular volume, the * term is a measure for the strength of polarisability of a compound and the and the terms are a measure for the strength of hydrogen-bonds with the respective algebraic signs indicating whether these molecular characteristics and interactions inhibit or support adsorbability. The positive mKVi terms in combination with negative or small mnVi terms represent an increase in adsorbability when the molecular volume is increasing. This is in accordance with mechanistic understanding. The London forces between the adsorbate and the adsorbents are approximately proportional to the polarisability of the molecule which on its turn is largely proportional to the molecular volume. London-forces are due to temporary dipoles resulting from electron-shifting.97 As the chance for such electron-shifting is higher for big molecules (with high molecular volume), adsorbability increases with increasing molecular volume (which also comes along with decreasing solubility). The coefficients in Table 10 indicate that the molecular volume is of great importance to the adsorbability of an organic compound. Only the adsorbability of pesticides seems to be affected stronger by hydrogen-bonding forces. The strong impact of the molar volume on adsorbability was also observed in the literature,45,72,98,99 and is therefore considered a normalising factor of the adsorption potential within the Polanyi model.

Increases in the terms should correlate with increasing * terms since these terms represent solubility in water. This is not always the case as shown by the coefficients in Table 10. Kamlet,43 who came to similar conclusions, noted that adsorption behaviour cannot exclusively be attributed to solubility but interactions between dipole/dipole and dipole/induced dipole are of special importance in adsorption processes.

In comparison to the results applying the Polanyi and the modified Freundlich model, the errors of the predicted Freundlich parameters are smaller when using LSERs. Correlations of the log[thin space (1/6-em)]K values mainly resulted in better correlation coefficients compared to the correlations of the corresponding log[thin space (1/6-em)]n values.

By considerations regarding the amounts of solute adsorbed (carbon loading) that were determined using the Freundlich isotherm equation (eqn (1)) with predicted Freundlich parameters and an equilibrium concentration (ceq) of 2 mg L−1, expected orders of adsorbability could be represented. There was an increase in adsorbability with the number of substituents and for phenols additionally with the functional group in the order methylphenols < chlorophenols < nitrophenols. These interrelations result from the magnitude of electron-withdrawing forces and hydrophobicity.

Similar orders of adsorbability are described in the literature,100–102 where the position of the substituents was also taken into consideration. It was shown that methyl substituents did not influence adsorbability, in contrast to chloro or nitro groups. In the literature, there is also a discussion with respect to steric effects (molecular size) which can be important for adsorbability of very large molecules but are not sufficiently taken into account by the LSER parameter intrinsic volume.48 It is proposed by the author that for large compounds, adsorption capacity is limited because of the restricted access to the micro-pores of the carbon. This is an effect of carbon characteristics and cannot be described by solute properties, thus.

To improve the prediction quality of adsorption equilibrium models, Blum44 assigned a “dummy” variable to identify the data source to account for the variance in the literature data. This resulted in a considerable improvement of the correlations and confirmed the assumption of these differences being not random but largely methodical. This approach was also applied by Luehrs.45

To improve prediction accuracy for QSAR models, the Freundlich parameters K and n should not be correlated separately. Previous groups50,51 proposed reasonable approaches to directly predict carbon loading using QSARs. While Shih50 tested their method for only 14 test sorbates, the investigations of de Ridder51 included data sets of 71 organic micropollutants grouped into four bins (aliphatic solutes with and without H-bond groups and aromatic solutes with and without H-bond groups). The latter achieved prediction accuracies for carbon loadings “within 0.5[thin space (1/6-em)]log unit deviation from measured values”.

Evaluation of the models to predict adsorption equilibrium

To evaluate the three models applied with respect to their adequacy to predict adsorption equilibrium, a comparison of the predicted amounts of solute adsorbed at equilibrium (qeq) with that determined experimentally (qexp) was performed for the 16 compounds investigated in own experiments. The calculations of the Freundlich constants (K and n) of the respective compounds were based on a data set of polyfunctional compounds, except for phenol, where a data set solely including phenols was used. For evaluation, the coefficient of variation of the root mean square error, cv(RMSE) was calculated by normalising the RMSE with the mean qeq. Furthermore, R2 and the factor of unexplained variance, FUV, of the calculated isotherms were determined and are given in Table 11. Besides the three models considered in this study, Freundlich coefficients for our own data were calculated by non-linear regression. Furthermore, the respective goodness of fit parameters are given for non-linear fitting of the Freundlich coefficient and Freundlich exponent to the experimental data.
Table 11 List of mean qeq with the corresponding error of experimental data, the cv(RMSE) for qeq as well as the R2 and the FUV of equilibrium data determined by non-linear regression, the Polanyi model, the modified Freundlich model and the LSER model. Best correlations are highlighted in bold
Compound Mean qeq [mg g−1] Error mean qeq cv(RMSE) qeq, R2, FUV
Non-linear regression Polanyi Modified Freundlich LSER
2,4,6-TCP 402 0.86 0.11 0.53 0.52 0.38
0.86 −2.56 −2.39 −0.85
0.14 3.56 3.39 1.85
2,4-DCP 364 1.76 0.08 0.60 0.58 0.33
0.75 −14.07 −13.32 −3.54
0.25 15.07 14.32 4.54
2,4-DNP 203 0.60 0.13 0.51 0.58 0.38
0.95 0.21 −0.01 0.55
0.05 0.79 1.01 0.45
2-CP 240 0.46 0.16 0.70 0.64 0.34
0.84 −1.83 −1.38 0.34
0.16 2.83 2.38 0.66
3-CP 151 0.33 0.13 0.57 0.54 0.19
0.94 −0.32 −0.18 0.85
0.06 1.32 1.18 0.15
4-CP 151 0.33 0.11 0.59 0.55 0.17
0.95 −0.44 −0.25 0.88
0.05 1.44 1.25 0.12
2-NP 200 0.38 0.12 0.59 0.46 0.21
0.96 0.00 0.38 0.87
0.04 1.00 0.62 0.13
3-NP 184 0.43 0.10 0.47 0.43 0.17
0.92 −1.01 −0.65 0.75
0.08 2.01 1.65 0.25
4-NP 166 0.35 0.11 0.55 0.53 0.11
0.96 −0.10 0.00 0.96
0.04 1.10 1.00 0.04
2-MP 265 0.97 0.04 0.68 0.58 0.17
0.94 −21.54 −15.05 −0.43
0.06 22.54 16.05 1.43
4-MP 199 0.50 0.05 0.62 0.50 0.15
0.97 −4.42 −2.52 0.69
0.03 5.42 3.52 0.31
Phenol 132 0.38 0.27 0.41 0.22 0.22
0.65 0.17 0.76 0.75
0.35 0.83 0.24 0.25
Isoproturon 262 2.73 0.18 0.34 0.39 0.34
0.57 −0.48 −0.88 −0.41
0.43 1.48 1.88 1.41
Diuron 250 2.31 0.09 0.48 0.33 0.11
0.97 0.24 0.64 0.96
0.03 0.76 0.36 0.04
Atrazine 244 10.00 0.11 0.23 0.43 0.29
0.81 0.23 −1.78 −0.24
0.19 0.77 2.78 1.24
2-NA 151 0.37 0.22 0.35 0.24 0.24
0.82 0.53 0.78 0.79
0.18 0.47 0.22 0.21


The goodness of fit parameters clearly show that the LSER best describes the experimental results (14 of 16 compounds). For one compound (phenol) LSER and the modified Freundlich Model yield comparable adequacies. Atrazine is the only one compound for which another model than LSER, namely Polanyi, performs better.

In Fig. 3, experimental data and isotherms obtained by nonlinear regression for determination of the Freundlich constants as well as the isotherms obtained using the LSER, the modified Freundlich and the Polanyi model are displayed exemplarily for four phenols, diuron and an amine.


image file: c5ra21005d-f3.tif
Fig. 3 Experimentally determined isotherm data and isotherms calculated by non-linear regression, the Polanyi model, the modified Freundlich model and the LSER model.

It is shown that the isotherm calculated using LSER always is the closest to the experimental isotherm and furthermore best describes the curve's shape. When using LSER, the Freundlich constants are determined by regression for q as a function of ceq. In the second step (eqn (8) and (9)), five empiric parameters are determined by a further regression in order to relate the Freundlich constants obtained in the first regression to compound properties. In contrast, the modified Freundlich model and the Polanyi model indirectly describe in linearised form q as a function of ceq and the Freundlich constants are then obtained by comparison of the coefficients. Thus, when using these two models, two instead of five empirical parameters (Polanyi) or no empirical parameters (modified Freundlich) are used to relate compound properties to the Freundlich constants.

Simulation of breakthrough behaviour using predicted equilibrium data

The comparison of simulated breakthrough behaviour to experimentally determined breakthrough curves was performed for the phenols listed in Table 5. The simulations were performed using adsorption equilibrium data obtained by applying the Polanyi model, Linear Solvation Energy Relationships and the modified Freundlich model to calculate the adsorption equilibrium data.

In Fig. 4, the results of breakthrough simulations using the modified Freundlich model to predict equilibrium data are exemplarily shown and compared to experimentally determined breakthrough curves. For the comparison of simulated and experimentally determined breakthrough behaviour, breakthrough at c/c0 = 0.1 and 0.8 was assessed. The results of experimentally determined and simulated breakthrough at c/c0 = 0.1 are listed in Table 12 for the phenols investigated and in Table 13 for the breakthrough at c/c0 = 0.8.


image file: c5ra21005d-f4.tif
Fig. 4 Comparison of breakthrough at c/c0 = 0.1 between experimentally determined ([dash dash, graph caption]) and predicted (–) breakthrough curves applying Freundlich parameters obtained from the modified Freundlich model. 4-Methylphenol (image file: c5ra21005d-u1.tif), 3-chlorophenol (image file: c5ra21005d-u2.tif), 3-nitrophenol (image file: c5ra21005d-u3.tif), 4-nitrophenol (image file: c5ra21005d-u4.tif), 2,4-dichlorophenol (image file: c5ra21005d-u5.tif) and 2,4,6-trichlorophenol (−).
Table 12 Comparison of breakthrough at c/c0 = 0.1 between experimentally determined and simulated breakthrough curves for phenols
Compound Experimental breakthrough Simulated breakthrough
Polanyi model LSER model Modified Freundlich model
[h] [h] [Δh] [h] [Δh] [h] [Δh]
4-Methylphenol 11 7 −36% 9 −18% 9 −18%
3-Chlorophenol 14 9 −36% 12 −14% 10 −29%
3-Nitrophenol 16 13 −19% 14 −13% 14 −13%
4-Nitrophenol 18 12 −33% 12 −33% 13 −28%
2,4-Dichlorophenol 19 17 −11% 16 −16% 16 −16%
2,4,6-Trichlorophenol 28 26 −7% 19 −32% 23 −18%
Mean deviation     −24%   −21%   −20%


Table 13 Comparison of breakthrough at c/c0 = 0.8 between experimentally determined and simulated breakthrough curves for phenols
Compound Experimental breakthrough Simulated breakthrough
Polanyi model LSER model Modified Freundlich model
[h] [h] [Δh] [h] [Δh] [h] [Δh]
4-Methylphenol 16 17 6% 18 13% 17 6%
3-Chlorophenol 18 19 6% 22 22% 18 0%
3-Nitrophenol 22 23 5% 25 14% 24 9%
4-Nitrophenol 24 25 4% 22 −8% 24 0%
2,4-Dichlorophenol 29 31 7% 29 0% 28 −3%
2,4,6-Trichlorophenol 39 54 38% 36 −8% 41 5%
Mean deviation     11%   11%   4%


The filter run time until breakthrough at both c/c0 = 0.1 and c/c0 = 0.8, due to increasing adsorption capacity with increasing number of substituents, followed the order methylphenols < chlorophenols < nitrophenols. The beginning of breakthrough (c/c0 = 0.1) was predicted earlier by an average of 22%. The 80% breakthrough was predicted well with an average deviation of 8%.

As displayed in Fig. 4, the simulated breakthrough curves showed a consistently smaller gradient compared to the experimental results. For that reason, the concentration ratio of c/c0 = 0.1 was reached earlier and the simulated breakthrough at c/c0 = 0.8 was mostly reached a little later than the breakthrough determined experimentally. These results indicate a systematic error regarding the volumetric mass transfer coefficients.

Generally, based on that we conclude that the simulation of SOC breakthrough in activated carbon filtration using Freundlich coefficients predicted from compound properties is suitable in terms of a conservative risk assessment.

Summary and conclusions

In this study, Freundlich constants to describe adsorption equilibrium were calculated using the Polanyi's potential theory, Linear Solvation Energy Relationships (LSERs), and a solubility normalisation of the Freundlich adsorption equilibrium model. The results showed that all models are applicable to predict adsorption equilibrium. However, the isotherms obtained when using LSER always were the closest to the isotherm obtained experimentally and best described the curve shape.

Moreover, it was shown that the predicted adsorption equilibrium parameters can be used to simulate breakthrough behaviour by calculating breakthrough curves in applying the Linear Driving Force (LDF) model and empirically determined mass transfer coefficients to describe adsorption kinetics. The breakthrough behaviour predicted generally was consistent with experimental results obtained in small-scale filter tests when the datasets used in the model had been determined under the same conditions as those in the small-scale filter test (mainly type of carbon, grain size, cleaning). Thus, the simulation of SOC breakthrough in activated carbon filtration using Freundlich coefficients predicted from compound properties is considered suitable in terms of a conservative risk assessment.

However, experimental and simulated breakthrough curves differ considerably in curve shape, which is attributed to improper description of the kinetics, which needs further improvements.

In order to predict breakthrough behaviour of compounds for which Freundlich constants are not available the following procedure is suggested:

(a) Determine LSER-parameters Vi/100, π*, β, α, for the respective compound from literature or by calculating them using a method described previously.81

(b) Attribute the compound to a group according to Table 10.

(c) Choose the type of activated carbon and grain size.

(d) Choose data sets of K and n for compounds and the respective activated carbon and grain size (data presented here and used for parameter calculation are for the activated carbon F300 at grain size 0.3–0.4 mm). K and n might be calculated from q and ceq, respectively, if the literature just gives q and ceq.

(e) Determine the LSER-parameters Vi/100, π*, β and α for the compounds of which datasets of K and n according to (d) are to be used.

(f) Determine the empirical constants m, s, b, a, d according to eqn (8) and (9) by non-linear regression and use the data set chosen.

(g) Use the LSER-parameters obtained in (a) for the compound in question and the LSER constants obtained in (f) to calculate the Freundlich constants K and n for that compound.

(h) Predict the breakthrough curve using the Linear Driving Force (LDF) model.

Acknowledgements

The authors thank the Federal Ministry of Education and Research (BMBF) for funding this research under grant 02 WT 0719. Mrs Grützner is gratefully acknowledged for technical assistance in the lab. Thanks are also due to Prof. Dr.-Ing. Mirko Slavik for his support regarding mathematical issues and the Mathematica® software handling.

References

  1. H. Sontheimer, J. C. Crittenden and R. S. Summers. Activated carbon for water treatment, DVGW-Forschungsstelle am Engler-Bunte Institut der Universität Karlsruhe, 2nd edn, 1988 Search PubMed.
  2. J. C. Crittenden, D. W. Hand, H. Arora and B. W. Lykins Jr, Design considerations for GAC treatment of organic chemicals, J.–Am. Water Works Assoc., 1987a, 79, 74–82 Search PubMed.
  3. D. W. Hand, J. C. Crittenden, M. Asce and W. E. Thacker, Simplified models for design of fixed-bed adsorption systems, J. Environ. Eng., 1984, 110, 440–456 CrossRef CAS.
  4. A. Sperlich, A. Werner, A. Genz, G. Amy, E. Worch and M. Jekel, Breakthrough behaviour of granular ferric hydroxide (GFH) fixed-bed adsorption filters: modelling and experimental approaches, Water Res., 2005, 39, 1190–1198 CrossRef CAS PubMed.
  5. T. F. Marhaba, Examining bromate ion removal by GAC through RSSCT and pilot-scale columns, Environmental Engineering and Policy, 2000, 2, 59–64 CrossRef.
  6. G. Crozes, J. Hagstrom, I. H. Suffet and C. Young, Bench-scale evaluation of adsorptive processes for taste and odours control using rapid small-scale column tests and flavor profile analysis, Water Sci. Technol., 1999, 40(6), 39–44 CrossRef CAS.
  7. D. R. U. Knappe, V. L. Snoeyink, P. Roche, M. J. Prados and M.-M. Bourbigot, The effect of preloading on rapid small-scale column test predictions of atrazine removal by GAC adsorbers, Water Res., 1997, 31(11), 2899–2909 CrossRef CAS.
  8. P. J. Cerminara, G. A. Sorial, S. P. Papadimas, M. T. Suidan, M. A. Moteleb and T. F. Speth, Effect of influent oxygen concentration on the GAC adsorption of VOCs in the presence of BOM, Water Res., 1995, 29(2), 409–419 CrossRef CAS.
  9. D. W. Hand, J. A. Herlevich Jr, D. L. Perram and J. C. Crittenden, Synthetic adsorbent versus GAC for TCE removal, J.–Am. Water Works Assoc., 1994, 86(8), 64–72 CAS.
  10. R. D. Vidic, G. A. Sorial, S. P. Papadimas, M. T. Suidan and T. F. Speth, Effect of Molecular Oxygen on the Scaleup of GAC Adsorbers, J.–Am. Water Works Assoc., 1992, 84, 98–105 CAS.
  11. C. J. Corwin and R. S. Summers, Adsorption and desorption of trace organic contaminants from granular activated carbon adsorbers after intermittent loading and throughout backwash cycles, Water Res., 2011, 45, 417–426 CrossRef CAS PubMed.
  12. A. M. Redding, F. S. Cannon, S. A. Snyder and B. J. Vanderfort, A QSAR-like analysis of the adsorption of endocrine disrupting compounds, pharmaceuticals, and personal care products on modified activated carbons, Water Res., 2009, 43(15), 3849–3861 CrossRef CAS PubMed.
  13. S. A. Snyder, S. Adham, A. M. Redding, F. S. Cannon, J. DeCarolis, J. Oppenheimer, E. C. Wert and Y. Yoon, Role of membranes and activated carbon in the removal of endocrine disruptors and pharmaceuticals, Desalination, 2007, 2002, 156–181 CrossRef.
  14. R. Parette, F. S. Cannon and K. Weeks, Removing low ppb level perchlorate, RDX, and HMX from groundwater with cetryltrimethylammonium chloride (CTAC) pre-loaded activated carbon, Water Res., 2005, 39, 4683–4692 CrossRef CAS PubMed.
  15. J. C. Crittenden, P. S. Reddy, H. Arora, J. Trynoski, D. W. Hand, D. L. Perram and R. S. Summers, Predicting GAC performance with rapid small-scale column test, J.–Am. Water Works Assoc., 1991, 83, 77–87 CAS.
  16. J. C. Crittenden, J. K. Berrigan and D. W. Hand, Design of rapid small-scale adsorption tests for a constant diffusivity, J.–Water Pollut. Control Fed., 1986, 58(4), 312–319 CAS.
  17. E. Glueckauf and J. I. Coates, Theory of chromatography. Part 4 – The influence of incomplete equilibrium on the front boundary of chromatogram and on the effectiveness of separation, J. Chem. Soc., 1947, 1315–1321 RSC.
  18. J. E. Williamson, C. J. Geankoplis and K. E. Bazaire, Liquid-phase mass transfer at low Reynolds numbers, Ind. Eng. Chem. Fundam., 1963, 2(2), 126 CAS.
  19. E. J. Wilson and C. J. Geankoplis, Liquid mass transfer at very low Reynolds numbers in packed beds, Ind. Eng. Chem. Fundam., 1966, 5, 9–14 CAS.
  20. T. Kataoka, H. Yoshida and K. Ueyama, Mass transfer in laminar region between liquid and packing material surface in the packed bed, J. Chem. Eng. Jpn., 1972, 5(2), 132–136 CrossRef CAS.
  21. T. Vermeulen, G. Klein, and N. K. Hiester. Adsorption and ion exchange, in Chemical engineer's handbook, ed. C. H. Chilton, J. H. Perry, and R. H. Perry, McGraw-Hill Book Company, 5th edn New York, 1973 Search PubMed.
  22. P. N. Dwivedi and S. N. Upadhyay, Particle-fluid mass-transfer in fixed and fluidised beds, Ind. Eng. Chem. Process Des. Dev., 1977, 16(2), 157–165 CAS.
  23. V. Gnielinski, Gleichungen zur Berechnung des Wärme- und Stoffaustauschs in durchströmten Kugelschüttungen bei mittleren und großen Peclet-Zahlen, Verfahrenstechnik, 1978, 12, 363–367 Search PubMed.
  24. V. Gnielinski, Berechnung des Wärme- und Stoffaustausches in durchströmten ruhenden Schüttzungen, Verfahrenstechnik, 1982, 16, 36–39 Search PubMed.
  25. H. Ohashi, T. Sugawara, K.-I. Kikuchi and H. Konno, Correlation of liquid-side mass transfer coefficient for single particles and fixed beds, J. Chem. Eng. Jpn., 1981, 14(6), 433–438 CrossRef CAS.
  26. U. Sierig, Investigations on adsorption kinetics of organic compounds on activated carbon, Ph. D. dissertation, Technische Universität Dresden, Germany, 1999.
  27. F. Hess, Development of praxis oriented calculation basics for the kinetics of activated carbon filtration in drinking water treatment, Ph. D. dissertation, Technische Universität Dresden, Germany, 2001.
  28. I. Langmuir, The adsorption of gases on plane surfaces of glass, mica and platinum, J. Am. Chem. Soc., 1918, 40, 1361–1403 CrossRef CAS.
  29. H. Freundlich, Über die Adsorption in Lösungen, J. Phys. Chem. A, 1906, 57, 385–470 CAS.
  30. M. M. Dubinin, Miroporosistnost i adsorbcionnye svojstva uglerodnych adsorbentov, Izv. Akad. Nauk SSSR, Ser. Chim., 1983, 3, 487–493 Search PubMed.
  31. M. M. Dubinin and V. A. Astachov, Razvitie predstavlenij ob objemnom zapolnenii miropor pri adsorbcij gazov i parov mikroporisstymi absorbentami. Soobshchenie 1: Uglerodnye adsorbenty, Izv. Akad. Nauk SSSR, Ser. Chim., 1971, 1, 5–11 Search PubMed.
  32. M. M. Dubinin, E. D. Zaverina and L. V. Raduskevic, Sorbcija i struktura aktivirovannoj uglja. I. Adsorbcija organiceskich parov, Zurn. Fiz. Chim., 1947, 21, 1351 CAS.
  33. J. C. Crittenden, S. Sanongraj, J. L. Bulloch, D. W. Hand, T. N. Rogers, T. F. Speth and M. Ulmer, Correlation of aqueous-phase adsorption isotherms, Environ. Sci. Technol., 1999, 33(17), 2926–2933 CrossRef CAS.
  34. L. Li, P. A. Quinlivan and D. R. U. Knappe, Predicting adsorption isotherms for aqueous organic micropollutants from activated carbon and pollutant properties, Environ. Sci. Technol., 2005, 39(9), 3393–3400 CrossRef CAS PubMed.
  35. M. Fuller, J. A. Smith and S. E. Burns, Sorption of nonionic organic solutes from water to tetraalkylammonium bentonites: Mechanistic considerations and application of the Polanyi–Manes potential theory, J. Colloid Interface Sci., 2007, 313(2), 405–413 CrossRef CAS PubMed.
  36. C. Long, A. Li, H. Wu, F. Liu and Q. Zhang, Polanyi-based models for the adsorption of naphthalene from aqueous solutions onto nonpolar polymeric adsorbents, J. Colloid Interface Sci., 2008, 319, 12–18 CrossRef CAS PubMed.
  37. M. Manes and L. T. E. Hofer, Application of the Polanyi Adsorption Potential Theory to Adsorption from Solution on Activated Carbon, J. Phys. Chem., 1969, 73(3), 584–590 CrossRef CAS.
  38. M. Manes, The Polanyi adsorption potential theory and its applications to adsorption from water solution onto activated carbon, in Activated carbon adsorption of organics from the aqueous phase, ed. I. H. Suffet and M. J. McGuire, Ann Arbor Science Pub., Ann Arbor, MI, 1980, vol. 1, pp. 43–64 Search PubMed.
  39. R. W. Kuennen, K. Van Dyke, J. C. Crittenden and D. W. Hand, Predicting the multicomponent removal of surrogate compounds by a fixed-bed adsorber, J.–Am. Water Works Assoc., 1989, 81, 46–58 CAS.
  40. K. Urano, E. Yamamoto, M. Tonegawa and K. Fujie, Adsorption of chlorinated organic compounds on activated carbon from water, Water Res., 1991, 25(12), 1459–1464 CrossRef CAS.
  41. E. G. Furuya, H. T. Chang, Y. Miura and K. E. Noll, A fundamental analysis of the isotherm for the adsorption of phenolic compounds on activated carbon, Sep. Purif. Technol., 1997, 11, 69–78 CrossRef CAS.
  42. S. Kleineidam, C. Schueth and P. Grathwohl, Solubility-normalized combined adsorption-partitioning sorption isotherms for organic pollutants, Environ. Sci. Technol., 2002, 36(21), 4689–4697 CrossRef CAS PubMed.
  43. M. J. Kamlet, R. M. Doherty, M. H. Abraham and R. W. Taft, Linear solvation energy relationships, 33. An analysis of the factors that influence adsorption of organic compounds on activated carbon, Carbon, 1985, 23(5), 549–554 CrossRef CAS.
  44. D. J. W. Blum, I. H. Suffet and J. P. Duguet, Quantitative structure-activity relationship using molecular connectivity for the activated carbon adsorption of organic chemicals in water, Water Res., 1994, 28(3), 687–699 CrossRef CAS.
  45. D. C. Luehrs, J. P. Hickey, P. E. Nilsen, K. A. Godbole and T. N. Rogers, Linear solvation energy relationships of the limiting partition coefficient of organic solutes between water and activated carbon, Environ. Sci. Technol., 1996, 30(1), 143–152 CrossRef CAS.
  46. C. Brasquet, E. Subrenat and P. Le Cloirec, Selective adsorption on fibrous activated carbon of organics from aqueous solution: correlation between adsorption and molecular structure, Water Sci. Technol., 1997, 35(7), 251–259 CrossRef CAS.
  47. C. Brasquet and P. Le Cloirec, QSAR for organics adsorption onto activated carbon in water: what about the use of neural networks, Water Res., 1999, 33(17), 3606–3608 CrossRef.
  48. J. A. McElroy, Adsorption of substituted aromatic compounds by activated carbon: a mechanistic approach to Quantitative Structure-Activity Relationships, Master's thesis, University of Florida, 2005 Search PubMed.
  49. T. H. Nguyen, K.-U. Goss and W. P. Ball, Polyparameter Linear Free Energy Relationships for estimating the equilibrium partition of organic compounds between water and the natural organic matter in soil and sediments, Environ. Sci. Technol., 2005, 39(4), 913–924 CrossRef CAS PubMed.
  50. Y.-H. Shih and P. M. Gschwend, Evaluating activated carbon – water sorption coefficients of organic compounds using a Linear Solvation Energy Relationship approach and sorbate chemical activities, Environ. Sci. Technol., 2009, 43(3), 851–857 CrossRef CAS PubMed.
  51. D. J. de Ridder, L. Villacorte, A. R. D. Verliefde, J. Q. J. C. Verberk, S. G. J. Heijman, G. L. Amy and J. C. van Dijk, Modelling equilibrium adsorption of organic micropollutants onto activated carbon, Water Res., 2010, 44, 3077–3086 CrossRef CAS PubMed.
  52. T. Asakawa and K. Ogino, Adsorption of phenol on surface modified carbon black from its aqueous solution, J. Colloid Interface Sci., 1984, 102(2), 348–355 CrossRef CAS.
  53. S. Kumar, S. N. Upadhyay and Y. D. Upadhya, Removal of phenols by adsorption on fly-ash, J. Chem. Technol. Biotechnol., 1987, 37(4), 281–290 CrossRef CAS.
  54. A. Akgerman and M. Zardkoohi, Adsorption of phenolic compounds on fly ash, J. Chem. Eng. Data, 1996, 41(2), 185–187 CrossRef CAS.
  55. A. R. Khan, T. A. Al-Bahri and A. Al-Haddad, Adsorption of phenol based organic pollutants on activated carbon from multi-component dilute aqueous solutions, Water Res., 1997, 31(8), 2102–2112 CrossRef CAS.
  56. L. S. Collela and P. M. Armenante, Adsorption isotherms for chlorinated phenols on activated carbons, J. Chem. Eng. Data, 1998, 43, 573–579 CrossRef.
  57. A. J. Slaney and R. Bhamidimarri, Adsorption of pentachlorophenol (PCP) by activated carbon in fixed beds: Application of homogeneous surface diffusion model, Water Sci. Technol., 1998, 38(7), 227–235 CrossRef CAS.
  58. J.-M. Chern and Y.-W. Chien, Adsorption of nitrophenol onto activated carbon: isotherms and breakthrough curves, Water Res., 2002, 36, 647–655 CrossRef CAS PubMed.
  59. Y. El-Sayed and T. J. Bandosz, Adsorption of valeric acid from aqueous solution onto activated carbons: role of surface basic sites, J. Colloid Interface Sci., 2004, 273(1), 64–72 CrossRef CAS PubMed.
  60. F.-C. Wu, R.-L. Tseng and R.-S. Juang, Comparisons of porous and adsorption properties of carbons activated by steam and KOH, J. Colloid Interface Sci., 2005, 283(1), 49–56 CrossRef CAS PubMed.
  61. M. Radhika and K. Palanivelu, Adsorptive removal of chlorophenols from aqueous solution by low cost adsorbent - Kinetics and isotherm analysis, J. Hazard. Mater., 2006, 138(1), 116–124 CrossRef CAS PubMed.
  62. M. F. Carvalho, A. F. Duque, I. C. Gonçalves and P. M. L. Castro, Adsorption of fluoro-benzene onto granular activated carbon: Isotherm and bioavailability studies, Bioresour. Technol., 2007, 98(18), 3424–3430 CrossRef CAS PubMed.
  63. B. H. Hameed, Equilibrium and kinetics studies of 2,4,6-trichlorophenol adsorption onto activated clay, Colloids Surf., A, 2007, 307(1–3), 45–52 CrossRef CAS.
  64. H.-J. Fan, H.-S. Yang, Y.-S. Tsai and E. Furuya, Prediction of individual Freundlich isotherms from binary and ternary phenolic compounds mixtures, Chemosphere, 2008, 71(5), 886–893 CrossRef CAS PubMed.
  65. M. J. McGuire and I. H. Suffet, Adsorption of organics from domestic water-supplies, J.–Am. Water Works Assoc., 1978, 70(11), 621–636 CAS.
  66. I. H. Suffet, and M. J. McGuire. Activated carbon adsorption of organics from the aqueous phase, Ann Arbor Science, 1980, vol. 1 Search PubMed.
  67. W. B. Arbuckle, Estimating equilibrium adsorption of organic compounds on activated carbon from aqueous solution, Environ. Sci. Technol., 1981, 15(7), 812–819 CrossRef CAS.
  68. I. Abe, K. Hayashi, T. Hirashima and M. Kitagawa, Prediction of adsorption isotherms of organic compounds from water on activated carbons. 4. Adsorbability of structural isomers of alcohols, J. Colloid Interface Sci., 1983, 94(1), 201–206 CrossRef CAS.
  69. I. Abe, K. Hayashi, H. Tatsumoto, M. Kitagawa and T. Hirashima, The relation between activated carbon adsorption and water quality indexes, Water Res., 1985, 19(9), 1191–1193 CrossRef CAS.
  70. I. Abe, H. Tatsumoto, N. Ikuta and T. Hirashima, Prediction of equilibrium adsorption amount on activated carbon by molecular structure parameters, Chem. Express, 1987, 2, 197–200 CAS.
  71. S. Zhang, X. Liu and T. Karanfil, Applicability of the linear solvation energy relationships in the prediction for adsorption of aromatic compounds on activated carbons from aqueous solutions, Sep. Purif. Technol., 2013, 117, 111–117 CrossRef CAS.
  72. I. Abe, K. Hayashi and T. Hirashima, Relationships between the Freundlich adsorption constants K and 1/N for hydrophobic adsorption, J. Am. Chem. Soc., 1982, 104, 6452–6453 CrossRef CAS.
  73. I. Abe, K. Hayashi, T. Hirashima and M. Kitagawa, Prediction of adsorption isotherms of organic compounds from water on activated carbons. V. Multiple linear regression analysis method, J. Colloid Interface Sci., 1984, 99(2), 588–590 CrossRef CAS.
  74. R. A. Dobbs and J. M. Cohen, Carbon adsorption isotherms for toxic organics, Municipal Environmental Research Laboratory, EPA-600/8-80-023, 1980 Search PubMed.
  75. R. Koch, Umweltchemikalien, Physikalisch-chemische Daten, Toxizitäten, Grenz- und Richtwerte, Umweltverhalten. 2, Auflage, VCH Verlagsgesellschaft, Weinheim, 1991 Search PubMed.
  76. H. Börnick, Aromatic amines in the river Elbe – Development of analytical methods and investigations on the behaviour during drinking water treatment, Ph. D. dissertation, Technische Universität Dresden, Germany, 1998.
  77. B. Rabolt, Investigations on competitive adsorption of micro pollutants and natural organic matter, Ph. D. dissertation, Technische Universität Dresden, Germany, 1998.
  78. MMP, Molecular Modelling Pro. Published by ChemSW® Inc., leader programmer: Quinn, J. A., 2002.
  79. IPPD, Interactive PhysProp Database, http://www.syrres.com/esc/physdemo.htm, Syracuse Re-search Corporation, 2004.
  80. CFD, ChemFinder.Com, http://chemfinder.cambridgesoft.com/, CambridgeSoft Corporation, 2004.
  81. J. P. Hickey and D. R. Passino-Reader, Linear Solvation Energy Relationships: “Rules of thumb” for estimation of variable values, Environ. Sci. Technol., 1991, 25(10), 1753–1760 CrossRef CAS.
  82. G. Ohlenbusch, Experimental characterisation and calculation of interactions between phenols and dissolved organic material in aqueous solution, Ph. D. dissertation, Universität Karlsruhe, Germany, 2000.
  83. C. Meinicke, Investigations on the adsorption of organic compounds on different adsorbents, Ph. D. dissertation, Martin-Luther-Universiät Halle-Wittenberg, Germany, 1995.
  84. C. Heese, Investigations on adsorption kinetics and adsorption dynamics of organic compounds, Ph. D. dissertation, Technische Universität Dresden, Germany, 1996.
  85. M. Ulmer, Adsorption of aromatic sulfonates on activated carbon, Ph. D. dissertation, Universität Karlsruhe, Germany, 1998.
  86. C. Eppinger, Aromatic amines in the river Elbe and their behaviour during drinking water treatment, Ph. D. dissertation, Technische Universität Dresden, Germany, 2000.
  87. P. Marcus, Development and validation of a lab-scale rapid column test to assess adsorbability of organic compounds on activated carbon, Ph. D. dissertation, Technische Universität Dresden, Germany, 2005.
  88. J. C. Crittenden, J. K. Berrigan, D. W. Hand and B. Lykins, Design of fixed-bed adsorption tests for non-constant diffusivities, J. Environ. Eng., 1987, 113(2), 243–259 CrossRef CAS.
  89. R. Murillo, T. García, E. Aylón, M. S. Callén, M. V. Navarro, J. M. López and A. M. Mastral, Adsorption of phenanthrene on activated carbons: Breakthrough curve model-ling, Carbon, 2004, 42, 2009–2017 CrossRef CAS.
  90. A. Patton, B. D. Crittenden and S. P. Perera, Use of the linear driving force approximation to guide the design of monolithic adsorbents, Chem. Eng. Res. Des., 2004, 82(A8), 999–1009 CrossRef CAS.
  91. A. Serbezov and S. V. Sotirchos, On the formulation of linear driving force approximations for adsorption and desorption of multicomponent gaseous mixtures in sorbent particles, Sep. Purif. Technol., 2001, 24, 343–367 CrossRef CAS.
  92. S. Sircar and J. R. Hufton, Why does the linear driving force model for adsorption kinetics work?, Adsorption, 2000, 6, 137–147 CrossRef CAS.
  93. D. G. Hartzog and S. Sircar, Sensitivity of PSA Process Performance to Input Variables, Adsorption, 1995, 1, 133–151 CrossRef CAS.
  94. H. I. Maarof, B. H. Hameed and A. L. Ahmad, Adsorption isotherms for phenol onto activated carbon, Am. J. Chem. Eng., 2004, 4(1), 70–76 Search PubMed.
  95. S. W. Wang, A. L. Hines and D. S. Farrier, Adsorption of aliphatic acids from aqueous solutions onto activated carbon, J. Chem. Eng. Data, 1979, 24(4), 345–347 CrossRef CAS.
  96. K. S. Al-Bahrani and R. J. Martin, Adsorption studies using gas-liquid chromatography – I. Effect of molecular structure, Water Res., 1976, 10, 731–736 CrossRef CAS.
  97. F. London, The general theory of molecular forces, Trans. Faraday Soc., 1937, 33, 8b–26 RSC.
  98. I. Abe, K. Hayashi, M. Kitagawa and T. Urahata, Adsorptive mechanisms on activated carbon in the liquid phase. III. The relationship between the physical constants of organic compounds and their adsorbabilities on activated carbon from aqueous solution, Bull. Chem. Soc. Jpn., 1980, 53, 1199–1205 CrossRef CAS.
  99. I. Abe, K. Hayashi and M. Kitagawa, Prediction of adsorption isotherms of organic compounds from water on activated carbon, Bull. Chem. Soc. Jpn., 1981, 54, 2819–2820 CrossRef CAS.
  100. M. L. Zhou, G. Martin, S. Taha and F. Sant’Anna, Adsorption isotherm comparison and modelling in liquid phase onto activated carbon, Water Res., 1998, 32(4), 1109–1118 CrossRef CAS.
  101. X. H. Deng, Y. H. Yue and Z. Gao, Preparation and characterization of active carbon ad-sorbents for wastewater treatment from elutrilithe, J. Colloid Interface Sci., 1997, 192(2), 475–480 CrossRef CAS PubMed.
  102. V. L. Snoeyink, W. J. Weber Jr and H. B. Mark, Sorption of phenol and nitrophenol by active carbon, Environ. Sci. Technol., 1969, 3(10), 918–926 CrossRef CAS.
  103. E. Worch, J. Heubach, and S. Paul. Verbundprojekt: Stickstofforganische Mikroverunreinigungen und ihr Verhalten im Prozeß der Trinkwasseraufbereitung; Teilprojekt: Untersuchungen zur adsorptiven Entfernung stickstofforganischer Substanzen (Teilaufgabe 1) und Optimierung der Analytik einzelner Leitsubstanzen (Teilaufgabe 2); Abschlußbericht zum Forschungsvorhaben 02 WT 9565/1, DVGW-Technologiezentrum Wasser (TZW) Karlsruhe, 1999, Available via TIB/UB Hannover/Germany, http://www.tib-hannover.de.

This journal is © The Royal Society of Chemistry 2016