Photodegradation of organic dyes based on anatase and rutile TiO2 nanoparticles†
Ashish Gautam,
Anuraj Kshirsagar,
Rahul Biswas,
Shaibal Banerjee and
Pawan K. Khanna*
Nanochemistry Laboratory, Dept. of Applied Chemistry, Defence Institute of Advanced Technology (DIAT-DU), DRDO, Govt. of India, Pune-411025, India. E-mail: pawankhanna2002@yahoo.co.in
First published on 23rd December 2015
Abstract
The present work highlights a simple nanochemistry based clean and efficient process for effective degradation of various organic dyes by use of anatase and rutile TiO2 nanoparticles. Based on photodegradation studies it was observed that at certain experimental parameters, rutile TiO2 was as effective as anatase for the degradation of indigo carmine (IC) dye in aq. solution. However, anatase TiO2 was found to be much more efficient against methylene blue (MB), methyl orange (MO), rhodamine B (RB) and eriochrome black T (EBT) under short UV irradiation. The photodegradation study of these organic dyes was also performed under long UV irradiation employing both anatase and rutile titania and the results showed similar trends. However, only EBT photodegradation indicated equal photocatalytic activity by both phases. The catalytic degradation of the organic dyes was studied by degradation kinetics. The maximum degradation efficiency using anatase and rutile titania photocatalysts was found to be 88% and 77% in the case of MB under short UV irradiation while about 65% was found in the case of EBT under long UV irradiation. The reuse of photocatalyst even after five cycles retained the degradation efficiency of 83% and 71% respectively for anatase and rutile when tested against MB.
1. Introduction
Dye pollutants, found in the waste water from various chemical industries such as paints, dyes and textile etc. are a major concern for a clean environment as such pollutants can adversely affect the environment causing health hazards to living organisms.1–3 Safe and effective disposal and degradation of harmful organics from such polluted water is needed. Currently, the methods employed for the degradation/decomposition of harmful dyes are either by dye adsorption onto a certain solid support or their catalytic decomposition in the form of gaseous molecules via green chemical reactions.4The absorption method is normally employed where precious metal catalysts are part of the degradation process. However, degradation through chemical reactions may involve liberation of harmful gases into the atmosphere.4b Owing to such limitations, it is need of the present time that suitable, robust and green non-toxic materials as well as processes are designed and practiced to handle the issue of environmental pollution. Nanotechnology has played a vital role in recent time to handle such issues in more effective manners. Often metal oxide nano-particles have been employed for degradation of organic dyes. Advancement in photocatalysis research led to use of oxygen rich metal oxides nano-particles for promotion of the oxidation of organic molecules facilitating green decomposition.5,6 Amongst the metal oxide materials, nano-TiO2 offers advantages due to its band-gap in the desired UV-Visible spectral range as a photocatalyst. Besides its optical properties, TiO2 has been found to be a non-toxic and stable material, which is available at lower cost. The common forms of this metal oxide are known to be anatase and rutile with the former one being the strongest oxidizer among the two whereas presence of rutile with anatase only enhances its photocatalytic activity. TiO2 (often anatase) is known to be an effective photocatalyst and has found varied applications for its role in photocatalytic processes thus making it an environmentally friendly candidate for waste water treatment and water purification.6–8
It has been documented in literature that, the exposure of nano-TiO2 to UV radiations results in the formation of hydroxyl radicals (˙OH) which eventually initiates the oxidation of the organic pollutants in water and completes the degradation process. The dye pollutants so-oxidized and decomposed lead to carbon dioxide and water.5 Additionally, TiO2 nano-particles have been attractive because of their variety of industrial applications as well as due to their potential applicability in dye sensitized solar cells and photocatalysis.8 Rutile phase of TiO2 is particularly useful in cosmetics.9,10 Reportedly, rutile TiO2 nano-particles are never easy to synthesize by chemical methods however, phase pure anatase TiO2 can be converted to rutile phase by high temperature sintering process between 500 °C to 800 °C. Zhang et al. described phase transformation at temperature as low as 500 °C.11 However, Khanna et al. reported that, myristic acid capped TiO2 nanoparticles retained their anatase phase up to 500 °C.12 Similarly, Pillai et al. reported chemically prepared anatase phase and its transformation to rutile at about 800 °C with good dispersibility.13 According to the literature reports, during the chemical synthesis of TiO2, intermediate precursor is converted to gel and is dried into white powder to obtain a mixture of anatase TiO2 and titanium hydroxide. Sintering of so-prepared powder via re-arrangements of atoms leads to phase pure rutile TiO2. Thus it is appropriate to practice chemical methods and suitably tailor them to rutile TiO2.
Rutile TiO2 is an important semiconductor for optical instruments and polarized optics as well as it has several applications that include paints, plastics, and sun-screen lotions to protect skin damage against UV-rays etc.14,15 Despite its impressive application list, there are only limited reports describing use of rutile TiO2 as photocatalyst however, anatase TiO2 has been documented as an excellent UV light photocatalyst.16–20 Ultra-violet light below 400 nm can be shielded but since the range between 380 nm and above falls in the borderline between UV and visible light spectrum, and since the band-gap energy of nano regime rutile phase is also near 400 nm, it may be considered as a suitable photocatalyst optionally. Despite the fact that band-gap of rutile TiO2 is lower than the energy required for photocatalysis, nano-particles of rutile phase titania may still be effective due to large surface area. Indeed, in the present case due to presence of oxygen rich initial surfaces (coming from starch used as a surfactant), offers greater possibility of effective photocatalysis. Various surfactants have been previously employed for the control of size and shape of the nanoparticles however, good control over size with oxygen rich surfaces which can impel the photocatalytic activity, is quite challenging. In view of the above, it is appropriate to consider surfactants like myristic acid (MA),12 potato starch (PS),21a polyvinylpyrolidone (PVP),21b poly-oxyethylene lauryl ether (POLE)21b etc. suitable to impart oxygen richness in the sample. According to the structural differences among these surfactants, oxygen content in the starch is much higher. Therefore, starch by virtue of its oxygen rich polymeric nature might strongly adsorbed on the surface of rutile titania thus assisting formation of oxygen free radicals with possibility of getting it trapped into the crystal structure and therefore enhancing photocatalysis.21,22
Photocatalytic activity has been mostly studied using spherical nanoparticles, where the catalytic efficiency indeed increases with decreasing particle size. Often titania is considered to be more effective due to presence of more oxygen content. One can generate oxygen rich rutile titania clusters which then might become effective in photocatalysis as the band gap is only marginally different than the anatase. Indeed, there are few reports describing enhancement in photocatalytic activity of oxygen rich rutile titania e.g. by treatment with hydrogen peroxide.23 However, such material might suffer from ineffective photocatalytic performance due to surface etching drawback. The etching of crystal surfaces may cause defects leading to random emission properties which may reduce electron retention probabilities thus making defective rutile titania a less effective photocatalyst due to fast recombination process.24 It is therefore desired to process defect free rutile titania for the purpose of photocatalysis.
One of major concern from the modern life style is the unsafe dumping of domestic as well as industrial waste and its adverse effect on the environment. The effective disposal of such waste should be based on environmentally safe treatment strategies by adopting clean and green technologies in order to offer environmental benefits. Therefore, recycling of the waste water by employing nano-photocatalysts seems to be a better way to circumvent the problems. Recyclable metal oxide nanoparticles based photocatalysts are considered to be beneficial for waste water treatment. Most often ZnO and TiO2 have been tested for such purpose with or without surface modification or doping them with other inorganic nano-structures.25,26
In the present article, a careful method has been described for preparation of spherical anatase titania by use of three different surfactants and their conversion to rutile titania. The choice of surfactants for the synthesis of titania nanoparticles was based on the easy degradability as well as environmental friendly nature of MA, PVP and starch. The use of these surfactants resulted in to smaller size nanoparticles with control over shape and size. Starch coated titania was further studied for photocatalytic activity due to possible oxygen rich surfaces. The comparative photocatalytic activities of anatase and rutile phase nano TiO2 and their reusability is discussed with respect to five organic dyes often detrimental to water quality.
2. Materials and methods
2.1. Materials
Titanium tetra-isopropoxide (TTIP), myristic acid (tetradecanoic acid), potato starch (PS), polyvinylpyrolidone (PVP), absolute ethanol/methanol/isopropanol and sulphur free toluene were all purchased from Sigma-Aldrich India Ltd. Mumbai. All chemicals and reagents were used as received. Deionized water was used for synthesis and cleaning purpose. X-ray diffraction (XRD) analysis was done at room temperature using Cu_Kα radiation (λ = 0.1546 nm) generated voltage of 40 kV and current of 120 mA with 2θ ranging in 10–90°. Fourier transform infrared (FTIR) spectra were obtained using a Perkin Elmer Spectrum-Two infrared spectrometer in the range of 4000 to 400 cm−1. Scanning electron microscope (SEM) measurement was performed on Zeiss Gemini operated at 300 kV. Transmission electron microscopy (TEM) measurement was carried with Technai G2 electron microscope operated at 300 kV. Thermogravimetric analysis (TGA) was performed on Perkin Elmer TGA7 under nitrogen between 25 °C to 850 °C at a constant heating rate of 20 °C min−1. Ultraviolet-visible absorption spectra were recorded on a UV 210 UV/Vis spectrophotometer Speccord 210 in the wavelength range of 200 nm to 800 nm. Photoluminescence spectra were recorded on Agilent Technologies Instrument in the range of 250 nm to 800 nm with excitation wavelength of 320 nm. Raman spectra were recorded using EZ Raman spectrometer (Emitted wavelength is 780 nm) in the range 4000 to 400 cm−1. The photocatalytic activities were performed in a UV chamber applying 254 nm and 365 nm irradiation. Five major organic dyes namely, methylene blue (MB), methyl orange (MO), rhodamine B (RB), indigo carmine (IC), eriochrome black T (EBT) were tested at 100 ppm level. The intensity of the UV lamp was measured in the range of 0–50![[thin space (1/6-em)]](https://www.rsc.org/images/entities/char_2009.gif) 000 lux using LUX meter (LX-101A) of Digital instruments.
000 lux using LUX meter (LX-101A) of Digital instruments.
2.2. Synthesis of TiO2 nanoparticles
Size controlled anatase TiO2 nanoparticles were synthesized by modified sol–gel preparation method which involved hydrolysis of TTIP in 2-propanol using myristic acid or potato starch or PVP as capping agent/surfactant. In a typical synthesis, 10 mL of TiCl4 was added to 60 mL of 2-propanol with a molar ratio of 1![[thin space (1/6-em)]](https://www.rsc.org/images/entities/char_2009.gif) :
:![[thin space (1/6-em)]](https://www.rsc.org/images/entities/char_2009.gif) 6 along with 0.25 gm surfactant (myristic acid/potato starch/PVP) under ice bath. A milky white suspension (sol) formation was observed after 8 hours of stirring at room temperature. The so-formed sol was allowed to stand for gelation process to obtain white gel. The gel so-obtained was centrifuged and washed with methanol and dried in a vacuum oven at 50 °C for 12–18 hours to obtain hydroxide rich predominantly anatase titanium dioxide nanoparticles.
6 along with 0.25 gm surfactant (myristic acid/potato starch/PVP) under ice bath. A milky white suspension (sol) formation was observed after 8 hours of stirring at room temperature. The so-formed sol was allowed to stand for gelation process to obtain white gel. The gel so-obtained was centrifuged and washed with methanol and dried in a vacuum oven at 50 °C for 12–18 hours to obtain hydroxide rich predominantly anatase titanium dioxide nanoparticles.
2.3. Formation of rutile TiO2 nanoparticles by sintering
Hydroxide rich predominantly amorphous anatase titanium dioxide nanoparticles were synthesized at low temperature which was converted to rutile phase by systematic sintering at 100, 200, 400 and 800 °C for 2 hour each at a prefixed heating rate. So-generated off-white powders were collected and used for further analysis.2.4. Photodegradation of dyes by anatase versus rutile nano-TiO2
Photocatalytic reactions were carried out in a UV chamber with 8 W lamp providing 254 nm or 365 nm irradiation. The aqueous suspensions containing all necessary components were first stirred in the dark for 1 h and then irradiated with a pre-warmed UV lamp. Except when stated otherwise, the experimental condition was as follows, 0.1 g TiO2 was added in 100 ppm dye solution (0.005 g dye per 50 mL water). At given intervals, small aliquots were withdrawn and analysed using UV spectrophotometer to monitor the decrease in intensity of absorption peak relating to % degradation of the chosen dye (Table 3).3. Results and discussion
3.1. Chemistry
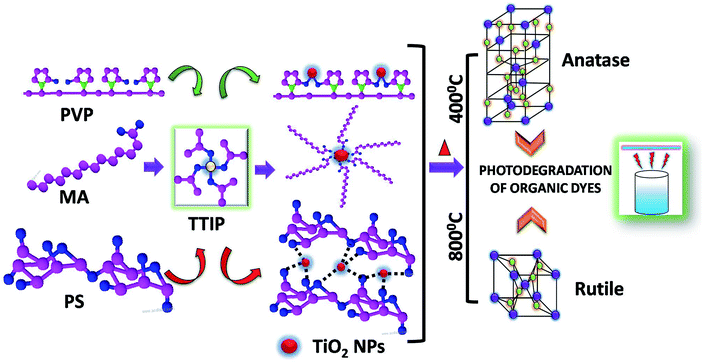
The reaction of alcoholic solution of Titanium tetra isopropoxide (TTIP) in presence of myristic acid, polyvinyl pyrrolidone and potato starch leads to the formation of TiO2 nano-particles capped with respective surfactant.During the course of reaction, TTIP gets converted to titanium dioxide through the loss of water molecules and formation of isopropanol as by-product. The growth and nucleation of TiO2 nanoparticles was controlled by the respective capping agent present in the reaction mixture. It was assumed that, the nanoparticles formation proceeds via micelle formation in presence of MA, while in case of polymeric surfactant, nanoparticles remain embedded in polymer network of PVP and PS. Anatase TiO2 was obtained below 400 °C which was then converted to rutile phase by sintering at 800 °C. Both Anatase and rutile TiO2 were employed as photocatalyst in the degradation of various organic dyes. The overall schematic representation is depicted in Scheme 1.
3.2. Optical studies
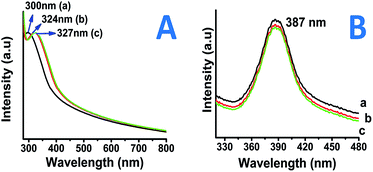
Fig. 1A shows the UV-Visible spectra of all the three type of as-prepared TiO2 nano-particles i.e. coated with (a) PVP, (b) starch and (c) myristic acid. The absorption for as prepared nanoparticles was found to be in the range of 300–327 nm depending on the surfactants used. PVP capped nano-particles showed higher band gap than the starch and myristic acid capped particles for as prepared nanoparticles (Fig. 1A).It is known that, anatase TiO2 has an absorbance wavelength of 385 nm. In the current measurement, the onset of absorption was observed at about 320–330 nm for the as-prepared nanoparticles resulting in a bandgap of >3.78 eV which is close to those reported for the anatase TiO2 nanoparticles. Fig. S1(I and II)† shows the absorption spectrum of the nanoparticles sintered at 400 °C and 800 °C, respectively. The nanoparticles sintered at 400 °C were observed to show absorbance at 324–342 nm (Fig. S1I†) which exhibit a bandgap in the range of 3.62–3.82 eV which is still in good agreement with bulk TiO2 bandgap energies whereas the particles which were sintered at 800 °C found to show higher absorbance values 360–370 nm (Fig. S1II†) with band gap energies in the range of 3.35–3.38 nm also in near accordance to the reported values for the rutile phase nano-titania particles.27 Illumination below this wavelength has adequate energy to stimulate the electrons present in the valence band and therefore, also getting absorbed by the TiO2 particles. While, on the other hand, light with wavelength in excess of the band gap energy (towards the longer wavelength) will not get absorbed by the TiO2 particles. Thus, TiO2 particles can be said to be an excellent UV absorber.28 In order to understand the luminescence properties of so-prepared nanoparticles, the photoluminescence analysis also been employed.
In the present study, it was observed that the emission band for nanoparticles was about 387 nm for all the nanoparticles prepared via different surfactants. Light emitting properties in nano-titania may arise due to presence of surface plasmons (presence of Ti–OH).29 The emission band in the present case was observed at about 385 nm (∼3.23 eV). Fig. 1B shows Stokes shift of 60–67 nm with reference to absorption band (λ (em) 387; λ (ex) @ 320 nm). This therefore rules out the emission in the visible light range due to absence of free Ti–OH states. The other two samples e.g. PS–TiO2 and MA–TiO2 similarly showed emission bands in the expected range. The band-gap calculations along with optical wavelengths are presented in Table 1.
| Optical property | PVP TiO2 | Starch TiO2 | MA TiO2 |
|---|---|---|---|
| Abs. wavelength (nm) | 300 | 324 | 327 |
| Em. wavelength (nm) | 387 | 387 | 387 |
| @Band-gap (eV) | 4.13 | 3.83 | 3.80 |
3.3. XRD studies and effect of temperature
XRD measurement of the samples was carried out for understanding the particle diameter as well as other information related to the crystal structure of the so-prepared nano particles. The XRD of as-prepared TiO2 capped with potato starch, myristic acid and PVP when analyzed, did not reveal any diffraction peak and the signal to noise ratio was much higher in the diffraction pattern. The peaks were not clear possibly due to highly amorphous nature. However, upon sintering at 100 °C and 200 °C some peaks were resolved in all the samples. The temperature showed only marginal changes in the physical appearance of the powder (Fig. S2†).Effect of temperature was subsequently studied to understand various properties related to crystal structure, shape and size of the nano-Titania. Debye–Scherrer equation (A)30 was used for various calculations (D = 0.9λ/β![[thin space (1/6-em)]](https://www.rsc.org/images/entities/char_2009.gif) cos
cos![[thin space (1/6-em)]](https://www.rsc.org/images/entities/char_2009.gif) θ (i); where, D is the diameter of crystallite, λ being the X-ray wavelength of CuKα, θ is Bragg's angle that is converted to radian (180/π) and β full width at half of maximum intensity). As-prepared nano-particles were sintered at higher temperature to understand effect of temperature on particle size, crystal structure and morphology. In case of the TiO2 sintered at 400 °C, the diffraction peaks were observed at 2θ value corresponding to (101), (112), (200), (211), (118) and (204) crystal planes respectively which are in accordance with standard data for anatase crystal structure31 (Fig. 2). The particle size increased with increase in temperature without any signature of change in the crystal structure. The size was estimated to be about 38.0, 8.36 and 5.0 nm respectively for PVP, MA and PS coated nano-titania (Table S2†). The study indicated that, starch capped nano-particles were the smallest in size when sintered at 400 °C. The absence of a peak at 2θ 27° indicated that the sample is free from the rutile phase.32 It is has been described often and is true indeed that with increase in crystallinity, the particle/cluster size will increase reducing surface area and dispersibility.33,34 The d-spacing at 101 plane was estimated to be 0.35 nm which matches well with the reported value for anatase.
θ (i); where, D is the diameter of crystallite, λ being the X-ray wavelength of CuKα, θ is Bragg's angle that is converted to radian (180/π) and β full width at half of maximum intensity). As-prepared nano-particles were sintered at higher temperature to understand effect of temperature on particle size, crystal structure and morphology. In case of the TiO2 sintered at 400 °C, the diffraction peaks were observed at 2θ value corresponding to (101), (112), (200), (211), (118) and (204) crystal planes respectively which are in accordance with standard data for anatase crystal structure31 (Fig. 2). The particle size increased with increase in temperature without any signature of change in the crystal structure. The size was estimated to be about 38.0, 8.36 and 5.0 nm respectively for PVP, MA and PS coated nano-titania (Table S2†). The study indicated that, starch capped nano-particles were the smallest in size when sintered at 400 °C. The absence of a peak at 2θ 27° indicated that the sample is free from the rutile phase.32 It is has been described often and is true indeed that with increase in crystallinity, the particle/cluster size will increase reducing surface area and dispersibility.33,34 The d-spacing at 101 plane was estimated to be 0.35 nm which matches well with the reported value for anatase.
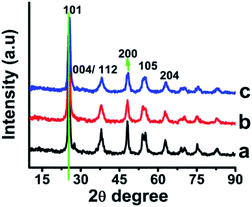 | ||
| Fig. 2 XRD of TiO2 nanoparticles coated with (a) PVP, (b) myristic acid (c) potato starch sintered at 400 °C. | ||
The XRD patterns should exhibit intense diffraction peaks at 27°, 36° and 55° in addition to several low intensity peaks for rutile phase of TiO2. Indeed, these relevant peaks were found when the anatase TiO2 was sintered at 800 °C indicating complete conversion to rutile phase. The average crystallite size of PVP, MA and PS coated rutile TiO2 was measured from the XRD peaks using the Scherrer's formula and was found to be 74 nm, 51 nm and 76 nm respectively (Table S3,† Fig. 3). Anatase TiO2 nanoparticles after sintering at 400 °C retained smaller size (below 40 nm) as compared with the rutile TiO2 nanoparticles where the particle size increased to many fold so much so that 5.0 nm starch coated anatase TiO2 turned 75 nm rutile TiO2. The estimated d-spacing of 0.32 nm at 110 plane was found lower in rutile phase as against 0.35 nm of anatase indicating high degree of clustering.
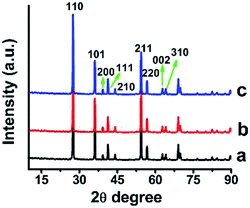 | ||
| Fig. 3 XRD of TiO2 nanoparticles sintered at 800 °C: transformation of anatase phase to rutile phase (a) PVP (b) myristic acid (c) potato starch coated TiO2. | ||
3.4. XPS studies
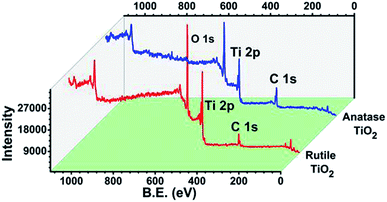
The XPS analysis of the anatase and rutile titania was carried out and surface states of the samples were revealed. The spectrum after the complete scan of the samples is depicted in Fig. 4 revealing the presence of Ti 2p, O 1s and C 1s surface states of anatase and rutile titania. In order to investigate the surface properties of anatase and rutile titania, high resolution spectra of Ti 2p, O 1s and C 1s peaks was recorded (Fig. 5(i)). The peaks obtained for Ti 2p were symmetric, sharp and intense indicating the presence of Ti4+ surface states. The peak obtained near 468 eV corresponds to the Ti 2p1/2 state while other peak near 462 eV confirms the presence of Ti 2p3/2 state. In the case of rutile titania same nature of the curve was obtained explaining the presence of Ti 2p1/2 and Ti 2p3/2 surface states in Fig. 5(ii). However, the intensity of the peaks was high as compared to the anatase titania confirming the phase purity of the sample. The careful comparison of the Ti 2p3/2 peak of anatase and rutile titania revealed the shift of about 0.199 eV in case of rutile titania. The shift obtained could be due to oxygen richness. As per the previous reports the shift of the Ti 2p3/2 peak towards the lower value corresponds to the oxygen vacancies or defects due to the high temperature treatment as well as weakening of the Ti–O–Ti bond at higher temperature.35 However, in the present findings shift to the higher value of binding energy even after heat treatment at about 800 °C confirm the absence of the oxygen vacancies or defects on the surface of rutile titania. Therefore, it is considered that possibly due to the trapping of the oxygen in to the crystal structure of the rutile titania makes it oxygen rich efficient material for the photocatalysis.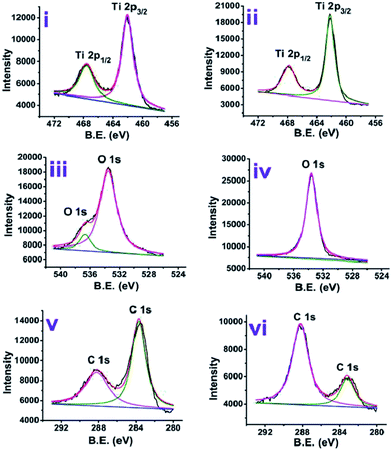 | ||
| Fig. 5 High resolution XPS analysis of anatase (i, iii and v) and rutile (ii, iv and vi) titania for (i and ii) Ti 2p, (iii and iv) O 1s and (v and vi) C 1s chemical states. | ||
Two different chemical states of oxygen are revealed from the Fig. 5(iii). Generally, oxygen atom in O 1s form is believed to be compiled of 3–5 different oxygen species like O–H, Ti–O, C–O, H–O–H etc.36 Anatase phase of the titania shows that there are two different states of oxygen owing to two different peaks (Fig. 5(iii)). Peak near 536 eV may correspond to the presence of hydroxyls on the surface possibly because of the small amount of non-decomposed organics or presence of Ti–OH while peak near 533 eV can be attributed to the lattice oxygen.
Rutile phase titania was also analysed for the surface investigation and it was observed that, only one peak near 534 eV appeared confirming the absence of the surface hydroxyl groups and presence of only lattice oxygen species (Fig. 5(iv)). The deviation in the peak position can be due to the difference in particle size of rutile titania and oxygen content in it.36
In case of C 1s chemical state of carbon, two asymmetric peaks were obtained. The peak near 288.19 eV corresponding to the carbon species from C![[double bond, length as m-dash]](https://www.rsc.org/images/entities/char_e001.gif) O while other peak near 283.7 eV related to the C–C bond. The comparison of the both peaks in case of anatase (Fig. 5(v)) and rutile (Fig. 5(vi)) titania reveals that the change in the intensities of these. The higher intensity peak at 283.7 eV in case of anatase titania could be due to C–C bond because of presence of surfactant molecules while low intensity peak near 288.19 eV could be due to decrease in the C–O content. Exactly reverse trend was obtained in case of rutile titania where the suppression of peak for C–C bond could be due to further loss of surfactant and increase in C
O while other peak near 283.7 eV related to the C–C bond. The comparison of the both peaks in case of anatase (Fig. 5(v)) and rutile (Fig. 5(vi)) titania reveals that the change in the intensities of these. The higher intensity peak at 283.7 eV in case of anatase titania could be due to C–C bond because of presence of surfactant molecules while low intensity peak near 288.19 eV could be due to decrease in the C–O content. Exactly reverse trend was obtained in case of rutile titania where the suppression of peak for C–C bond could be due to further loss of surfactant and increase in C![[double bond, length as m-dash]](https://www.rsc.org/images/entities/char_e001.gif) O peak intensity possibly due to gaining of oxygen from the atmosphere. The peak positions and percentage area under the curve of anatase and rutile titania are presented in Table S4.†
O peak intensity possibly due to gaining of oxygen from the atmosphere. The peak positions and percentage area under the curve of anatase and rutile titania are presented in Table S4.†
3.5. Electron microscopy
The spherical surface morphology was observed by the SEM analysis of the 400 °C sintered TiO2 nanoparticles prepared using various surfactants that show regular agglomeration suggesting the presence of the surfactants in molten state even after sintering, additionally the particle size was found to be around 60 nm that are in agreement to the average particle size calculated from the XRD data using the Scherrer's formula. The residual remains even after high temperature sintering may be the reason for the agglomeration as observed in the SEM micrographs (Fig. S3 and S4†). The EDS analysis, provided information of Ti and O peaks that signifies potentially pure TiO2 particles (Fig. S3 and S4†). The ratio between Ti and Oxygen suggest that, the samples are slightly richer in oxygen but this eventually shall be evaporated off during the sintering process at higher temperature. The increase in sintering temperature resulted in more clarity in particle shape and morphology as the surfactants present in the sample was evaporated at this temperature completely leading to more clustering. Nonetheless, the spherical morphology was retained by the samples with indeed hinting towards more accurate ratio between the titanium and oxygen (Fig. S4†).Fig. 6 shows TEM images of TiO2 nanoparticles capped by myristic acid that were sintered at 400 °C and 800 °C. The sample was selected as an example for the analysis because of the reason that a maximum crystallinity can be observed in this sample. As-prepared sample often lead to agglomerated particles quite close to amorphous in nature so much information about their lattices is difficult to obtain.
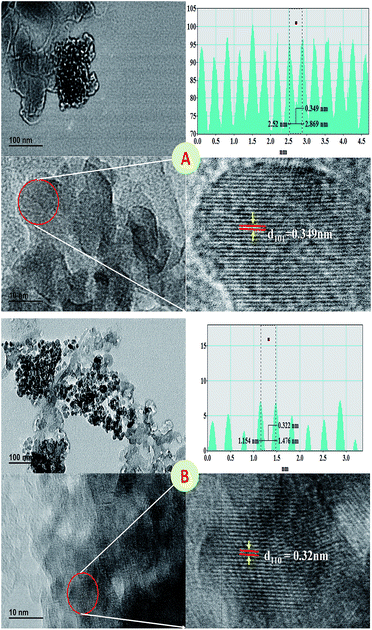 | ||
| Fig. 6 TEM of myristic acid capped anatase TiO2 sintered at 400 °C (A) and 800 °C (B) with the line profile plot. | ||
Indeed, it was observed that the TEM images showed slightly elongated spherical particle and characteristics of the crystalline nature. The X-ray diffraction pattern also signifies the crystalline nature of the sintered nanoparticles. It was observed that, the particles were with usual agglomeration due to the presence of the slight capping of myristic acid which also causes elongation. The particle size was observed to be less than ∼15 nm and ∼37 nm for anatase and rutile phase titania nanoparticles respectively and closely matching with the estimated size from XRD (Table S2 and S3†). The lattice fringes calculated as 0.35 nm and 0.32 nm which are in good agreement with the previous reports for anatase and rutile phase titania nanoparticles respectively.37,38
3.6. FTIR studies
Fourier transform infra-red spectroscopic analysis was employed in order to understand the interaction of nanoparticles with capping agents and effect of temperature. The FTIR spectra of the titanium nanoparticles calcined at various temperatures is shown in Fig. S5† and values for various functionalities are presented in Table S5.† The peaks observed in the range of 500 to 900 cm−1 can be attributed to the characteristic vibrational modes of TiO2.20 The absorption peak near 3342 cm−1 was attributed to the presence of stretching mode of hydroxyl groups mostly present with titania nanoparticles or in surfactants.39,40 The main peaks due to C–H symmetric and asymmetric stretching, C![[double bond, length as m-dash]](https://www.rsc.org/images/entities/char_e001.gif) O stretching and C–O stretching frequencies were observed near 2920 cm−1, 1638 cm−1, 1050 cm−1 respectively. The presence of peak at 1519 cm−1 in case of titania NPs sintered at 100 °C clearly differentiate and confirms the presence of N–C stretching as the TiO2 nanoparticles are capped with PVP. The temperature applied in the present study result in the decomposition of the capping/surfactant which is further given by loss of carboxylate group resulting in the formation of gaseous CO2 (ref. 12) and therefore, weak intensity or very smooth nature of the IR spectra were obtained indicating loss organic moieties from the surface of titania. The peaks are well resolved and intense in case of the titania sintered at 100° and 200 °C as compared to the samples sintered at 400° and 800 °C and therefore, exact peak identification becomes difficult. The broad peak near 850 cm−1 indicates the Ti–O stretching vibrations. The peak observed near 1626 cm−1 corresponds to the interaction between the Ti–O network and the ionised COO of the myristic acid.39–41 All major peaks from the IR spectrum of titania sintered at 800 °C (Fig. S5IV†) are disappeared indicating complete evaporation of the surfactant molecules from titania surface. The two strong peaks observed near 850–500 cm−1 and 3450–3300 cm−1 were assigned to the Ti–O and OH stretching modes respectively.
O stretching and C–O stretching frequencies were observed near 2920 cm−1, 1638 cm−1, 1050 cm−1 respectively. The presence of peak at 1519 cm−1 in case of titania NPs sintered at 100 °C clearly differentiate and confirms the presence of N–C stretching as the TiO2 nanoparticles are capped with PVP. The temperature applied in the present study result in the decomposition of the capping/surfactant which is further given by loss of carboxylate group resulting in the formation of gaseous CO2 (ref. 12) and therefore, weak intensity or very smooth nature of the IR spectra were obtained indicating loss organic moieties from the surface of titania. The peaks are well resolved and intense in case of the titania sintered at 100° and 200 °C as compared to the samples sintered at 400° and 800 °C and therefore, exact peak identification becomes difficult. The broad peak near 850 cm−1 indicates the Ti–O stretching vibrations. The peak observed near 1626 cm−1 corresponds to the interaction between the Ti–O network and the ionised COO of the myristic acid.39–41 All major peaks from the IR spectrum of titania sintered at 800 °C (Fig. S5IV†) are disappeared indicating complete evaporation of the surfactant molecules from titania surface. The two strong peaks observed near 850–500 cm−1 and 3450–3300 cm−1 were assigned to the Ti–O and OH stretching modes respectively.
3.7. Raman analysis
According to Ohsaka, anatase TiO2 has six Raman active modes (A1g + 2B1g + 3Eg)42 with Raman peaks centred at 144 cm−1 (Eg), 197 cm−1 (Eg), 399 cm−1 (B1g), 513 cm−1 (A1g), 519 cm−1 (B1g), and 639 cm−1 (Eg). Raman spectrum of anatase phase TiO2 NPs is shown in Fig. S6(III)† where, Raman active prominent peaks are positioned at 138–142, 305, 510, 624 cm−1. Other bands observed with the little noise are attributed to the vibrational modes of the capping agent specifically peaks near 500–750 cm−1 were assigned to the ring breathing vibrations and C–C skeletal stretch.Similarly, it is reported that rutile phase also has six (four symmetric and two antisymmetric) Raman active modes but the values may shift with respect to temperature and nature of material. Raman shifts of rutile phase of TiO2 are observed at 218, 434 and 599 cm−1 respectively (Fig. S6(IV)).† In the present case it appears that only major symmetric peaks were observed.
It is further reported that, with decrease in particle size, Raman bands shift towards higher wavenumber (blue shift) with their intensities marginally decrease and vice versa. Indeed, in our findings too, the intensities are weak thereby implying the variation in particle size which in fact correlate well with the data obtained from other analyses. It was observed that, with an increase in sintering temperature from 400 °C to 800 °C Raman peaks related to anatase phase gets suppressed and evolution of new peaks characteristics of rutile takes place. In the present study only four clear peaks were obtained, in addition to signature of other small peaks.
3.8. TGA analysis
The percentage (%) wt loss in the titania nanoparticles (anatase and rutile) have been depicted in Fig. S7.† The % weight loss from the TGA analysis is found to be occurring in four phases. Both phases show four stage decomposition process with ∼22% wt loss in case of anatase titania nanoparticles and only ∼7% wt loss in case of rutile titania nanoparticles. The % wt loss observed near 100 °C (16.21%) was considered due to the moisture content present in the sample. The organics present over the surface of the nanoparticles decomposed in temperature range of 160–630 °C (5.39%). The % wt or mass loss in the range of 630–800 °C for the anatase phase titania was assumed because of conversion of amorphous carbon to gaseous carbon (0.79%) and finally char remains in the nanoparticles. However, in the case of rutile phase titania nanoparticles the evaporation in the range 25–220 °C (4.53%) corresponds to the loss of the moisture trapped. The organic moieties present on the surface gets removed in 220–440 °C temperature range (1.43%). 0.94% wt loss in the final stage was assumed due to the complete removal of organics and formation of char. Similar observations have been found in the literature also.433.9. BET analysis
Specific surface area of the various TiO2 nanoparticles sintered at 400 °C and 800 °C was measured by use of BET analyzer. With reference to the results obtained (Table 2), one can conclude that, potato starch coated nanoparticles have larger surface area with the smallest particle size (calculated using BJH formula; TBET = 6000/(ρ × Sw) (in nm), where TBET – average size of particle, Sw – the surface area of the nanoparticles in m2 g−1, and ρ is the theoretical density in g cm−3) and crystallite size (calculated from Scherrer formula). The comparative pictorial presentation is presented in Fig. S8.†| Sample | BET SSA (m2 g−1) | Particle size (nm) BET | Crystallite size (nm) from XRD | |||
|---|---|---|---|---|---|---|
| 400 °C | 800 °C | 400 °C | 800 °C | 400 °C | 800 °C | |
| A | 22.79 | 15.11 | 64 | 88.21 | 37.71 | 74 |
| B | 61.05 | 10.26 | 23 | 129.92 | 8.36 | 76 |
| C | 86.12 | 13.46 | 16 | 99.03 | 5.0 | 51 |
The surface area for rutile phase nano titania particles was found to be lower than that of anatase phase nanoparticles, it was generally observed that there was a systematic decrease in surface area for both types of titania with temperature. Decrease in surface area and increase in particle size with respect to temperature has been documented widely for metal oxide nano-particles especially for titania and similar trend is observed in present case which already proved from XRD results.12,13
3.10. Photocatalytic activity of anatase and rutile
 | (1) |
 | (2) |
The photocatalytic activity of the nanoparticles was measured by photocatalytic decomposition of organic dyes (methylene blue, methyl orange, rhodamine B, carmine indigo and eriochrome black T) with anatase TiO2 and rutile TiO2. The structures and chemical properties of organic dyes used in present study are given in Table S6.†45–49 Fig. S9†50,51 shows typical decomposition of methylene blue dye during the degradation process and the band gap energy level diagram of anatase and rutile titania.
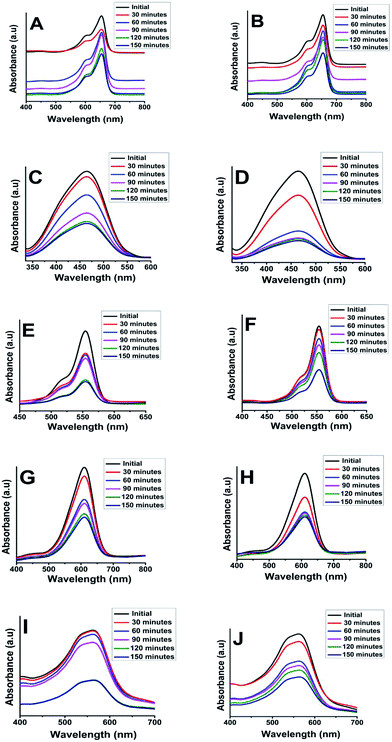
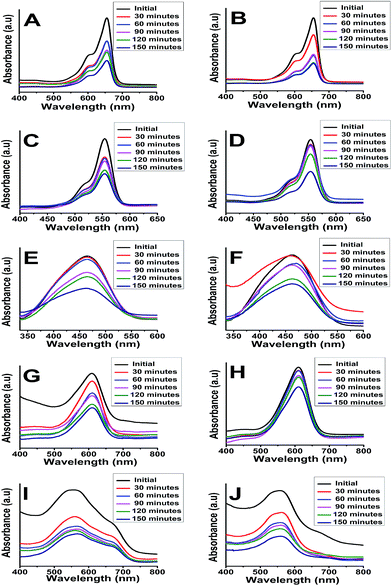
The dyes were irradiated under short and long wavelength UV lamps with frequency of 254 nm and 365 nm. Fig. 7A–J illustrate a typical measurement of the organic dyes absorbance after irradiation under short wavelength of 254 nm UV lamp versus reaction time. From Fig. 7A, C, E, G and I, it was found that the anatase phase was more effective in degrading the organic dyes when compared to the rutile phase of TiO2. The data are summarized in Table 3.
| Dye | Time (min) | Degradation efficiency (%) (anatase TiO2) | Degradation efficiency (%) (rutile TiO2) | Rate (k) (min−1) (anatase TiO2) | Ea (kJ mol−1) (anatase TiO2) | Rate (k) (min−1) (rutile TiO2) | Ea (kJ mol−1) (rutile TiO2) |
|---|---|---|---|---|---|---|---|
| MB | 120 | 88.51 | 77.00 | 0.0733 | 6519.00 | 0.0540 | 7281.31 |
| MO | 150 | 80.89 | 61.60 | 0.0490 | 7523.70 | 0.0444 | 7769.62 |
| RB | 150 | 70.88 | 57.61 | 0.0444 | 7769.62 | 0.0418 | 7920.16 |
| IC | 150 | 57.76 | 55.90 | 0.0547 | 7249.18 | 0.0544 | 7262.90 |
| EBT | 150 | 65.64 | 55.65 | 0.0588 | 7068.87 | 0.0565 | 7168.41 |
A major absorbance peak of methylene blue is located at 664 nm, due to conjugated system of hetero-poly aromatic linkage containing sulphur and nitrogen as hetero atoms (Fig. 7A and B). However, the solution of MB exhibited a dual absorbance at 664 and 615 nm because of n to π* (presence of lone pair of electrons on the nitrogen atom) and π to π* (conjugated system of the double bonds in aromatic rings) electronic transitions.
The absorbance of MB solution before exposure to UV light and anatase phase TiO2 catalyst the absorbance of MB decreased sharply after 30 min indicating that TiO2 anatase phase has good degrading capability. MB was degraded completely after irradiating for 120 min by anatase TiO2 however; it was only degraded to the tune of 77% after 150 min when rutile TiO2 was employed. Similar observations have been reported by other researchers for photocatalytic degradation of MB using TiO2.52
Similarly, the photocatalytic activity of anatase and rutile titania nanophase powders for the degradation of methyl orange having absorbance at 560 nm due to n to π* and π to π* electronic transitions showed decrement in its absorbance value which was recorded as 0.3 a.u. initially. The 80% degradation was recorded in 150 min for the anatase titania while for rutile, it was around 62% degradation within the same time duration. The higher photocatalytic activity was obtained for anatase phase titania particles while rutile phase particles showed about two times greater absorbance of the dye under similar condition thus confirming the poor catalytic performance in comparison to anatase phase. It is anticipated that, due to the optimum size quantization effect in anatase phase titania greater photocatalytic activity might result due to enhanced band-gap and higher surface area due to smaller particle size. The degradation of methyl orange dye has been affected by bigger particle size after sintering as in rutile phase particles became much bigger in their size domain and the oxygen content too decreased from over their surface as compared to anatase titania particles because of evaporation of surfactant molecules from the surface of catalyst (Fig. 7C and D). Guo et al. also described matching trend of photocatalytic degradation of methyl orange using silica-titania.53 Subsequently, the other dyes were also tested e.g. photocatalytic activity of anatase and rutile phase TiO2 nanoparticle was evaluated by monitoring the degradation efficiency of RB in aqueous solution with UV absorbance at around 475 nm. As shown in Fig. 7(E and F) the degradation efficiency of RB was found to be 71% for anatase titania photocatalyst and 57% for nanophase TiO2 rutile particles. This study indicates that, the phase pure anatase is good enough to degrade this organic dye because of the excess oxygen over its surface which is responsible for the oxidation of the RB in presence of short UV light. Ma et al. have also reported studies on degradation of RB describing preparation and photocatalytic activity of TiO2 loaded in char powder wherein they reported only 33% of the dye degradation.54 However, in present findings 70% degradation efficiency was obtained for degradation of RB this might be due to the presence of more oxygen content as described above as well as smaller particle size obtained during the synthesis of titania.
Similarly, Fig. 7(G and H) presents the changes in the UV-Vis spectra of the indigo carmine dye under UV light irradiation with this anionic dye. According to the reports photocatalyst has to be doped for better efficiency of degradation.55 However, in present study anatase catalyst shown good (66%) degradation efficiency as compared with the previous reports. These results showed that, even though both the photocatalysts degraded IC dye to some extent, there was no any effect of smaller or bigger sized particles as well as oxygen content on degradation performance. The above observations emphasizing that, incomplete degradation of indigo carmine was observed even after UV light irradiation for 150 min with TiO2 (anatase and rutile) as a catalyst. Similar observation was also reported earlier suggesting the degradation of this dye is only 55.4%. In our findings nano TiO2 photo-catalyst showed enhancement in the degradation of dye by near about 2.6% (58%).
The spectrum of eriochrome black T (EBT) in the visible region exhibits the main band with a maximum at 575 nm (Fig. 7I and J). The decrease in the intensity of absorption peaks of eriochrome black T at 150 min indicated a systematic degradation of dye with time. It was found that about 66% of EBT was decomposed with anatase phase while about 56% was affected by rutile phase. However, there are some reports describing, anatase TiO2 is not efficient in degrading this anionic dye, hence it has to be doped for better efficiency of degradation.56 However, in present study anatase catalyst shown good (66%) degradation efficiency as compared with the previous reports (Table 3).
As far as the mechanism of the degradation is concerned it was assumed that, the slow electron hole pair recombination rate is the prime requirement of the semiconductor nanoparticles for successful photocatalysis. Nano TiO2 when under irradiation by UV initiates photocatalytic process via electrons and holes mechanism due to electronic excitation within TiO2. The energy higher than the band-gap of TiO2 i.e. 3.2 eV (λ < 385 nm), can directly excite the nanoparticles.56,57 According to some literature reports, the holes and electrons generated during photolysis can oxidize the organic compounds and their reactions with water or hydroxides results in oxidizing all of them to ˙OH radicals. Similarly, photogenerated electrons will reduce the dye or may react with the absorbed O2 on the surface of nano-particles to form superoxide radical anion O2−˙. Overall degradation process can be summarized as below eqn (3)–(10) (where hv = photons, h = holes and e = electrons)57–59 and presented in Scheme 2.
| TiO2 + hv (UV) → TiO2 (eCB− + hVB+) | (3) |
| TiO2 (hVB+) + H2O → TiO2 + H+ + ˙OH | (4) |
| TiO2 (hVB+) + OH− → TiO2 + ˙OH | (5) |
| TiO2 (eCB−) + O2 → TiO2 + O2−˙ | (6) |
| O2−˙ + H˙ → HO2˙ | (7) |
| Dye + OH˙ → degradation products | (8) |
| Dye + hVB+ → oxidation products | (9) |
| Dye + eCB− → reduction products | (10) |
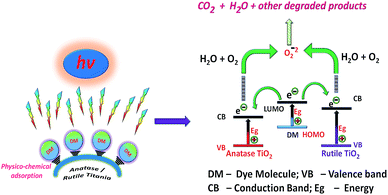 | ||
| Scheme 2 Pictorial representation of the degradation of organic dyes in presence of anatase and rutile titania photocatalyst. | ||
Fig. S10(A–E)† represents the plots of absorbance peak values versus time. From Fig. S10(F)† one can understand the degradation efficiency and a comparison can be made between anatase and rutile. It has been observed that, almost in every case anatase phase shows greater photocatalytic efficiency than rutile however, in case of degradation of indigo carmine it was observed that rutile titania was as effective as anatase titania.
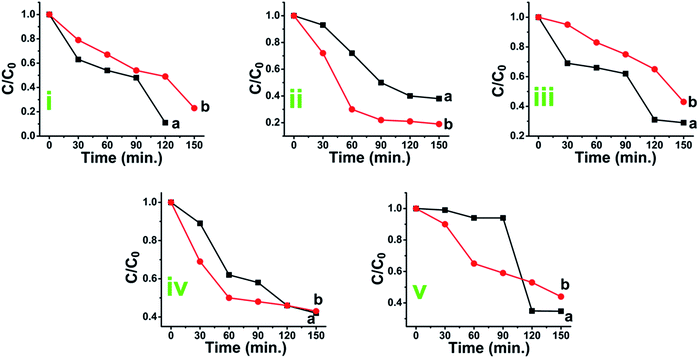
C/C0 vs. time plots are presented in Fig. 8 which shows the rate of degradation with time and brings more clarity in understanding of the photocatalytic performance of anatase or rutile titania. The anatase TiO2 is found to be more effective in degrading the dyes than the rutile phase TiO2 except in case of IC degradation. The photocatalytic degradation efficiency of anatase TiO2 is observed to be 88.5%, 80.89%, 70.88%, 57.76% and 65.64% while for the rutile TiO2, it is marginally lower at 77%, 61.6%, 57.51%, 55.90% and 55.65% for methylene blue, methyl orange, rhodamine B, indigo carmine, and eriochrome black T respectively.
Reaction kinetics was studied to understand the order of photocatalytic degradation reaction and it was established that the degradation of the dye follows the first order kinetics which is given by the following equation:60
| C = C0e−kt | (11) |
 | (12) |
Based on the eqn (11) and (12), rate constant (k) was calculated for MB, MO, RB, CI and EBT were found to be 0.0733 min−1, 0.0490 min−1, 0.0444 min−1, 0.0547 min−1 and 0.0588 min−1, respectively for anatase titania while 0.0540 min−1, 0.0444 min−1, 0.0418 min−1, 0.0544 min−1 and 0.0565 min−1 for rutile titania nanophase particles respectively. Rate constant study shows that the degradation rate of the IC was only marginally different using anatase and rutile titania (Fig. S12A†).
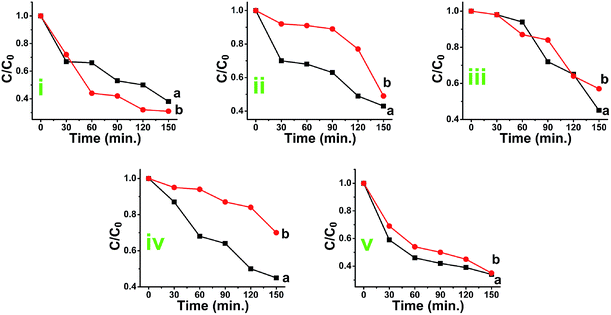
The plots of absorbance peak values (taken from Fig. 9) versus time are given in Fig. S11(A–E).† The photocatalytic degradation efficiency of anatase TiO2 was observed to be 64%, 56.36%, 54.85%, 54.66% and 65.09% while for the rutile TiO2, it was lower as 62%, 50.63%, 42.98%, 29.67% and 64.93% for methylene blue, methyl orange, rhodamine B, indigo carmine, and eriochrome black T respectively [Fig. S11(F)†]. The comparative graph of the rate constant of dye degradation is presented in Fig. S12B.† The analytical data for degradation of various dyes is depicted in Table 4. The energy of activation for degradation of EBT also found to be near about equal. The data are summarized in Table 4.
| Dye | Time (min) | Degradation efficiency (%) (anatase TiO2) | Degradation efficiency (%) (rutile TiO2) | Rate (k) (min−1) (anatase TiO2) | Ea (kJ mol−1) (anatase TiO2) | Rate (k) (min−1) (rutile TiO2) | Ea (kJ mol−1) (rutile TiO2) |
|---|---|---|---|---|---|---|---|
| MB | 150 | 64.00 | 62.00 | 0.0439 | 7797.87 | 0.0436 | 7814.98 |
| MO | 150 | 56.36 | 50.63 | 0.0487 | 7539.02 | 0.0433 | 7832.20 |
| RB | 150 | 54.85 | 42.98 | 0.0468 | 7638.29 | 0.0512 | 7414.13 |
| IC | 150 | 54.66 | 29.67 | 0.0554 | 7217.45 | 0.0461 | 7675.89 |
| EBT | 150 | 65.09 | 64.93 | 0.0552 | 7226.48 | 0.0553 | 7221.96 |
Based on the eqn (11) and (12), rate constant (k) was calculated for degradation of all organic dyes and were found to be 0.0439 min−1, 0.0487 min−1, 0.0468 min−1, 0.0554 min−1 and 0.0552 min−1, respectively for anatase titania while 0.0436 min−1, 0.0433 min−1, 0.0512 min−1, 0.0461 min−1 and 0.0553 min−1 for rutile titania against methylene blue, methyl orange, rhodamine B, indigo carmine, and eriochrome black T respectively. Rate constant study shows that the degradation rate of the EBT was almost equal when both anatase and rutile titania was compared (Table 4).
3.11. Photocatalytic activity of the recycled TiO2
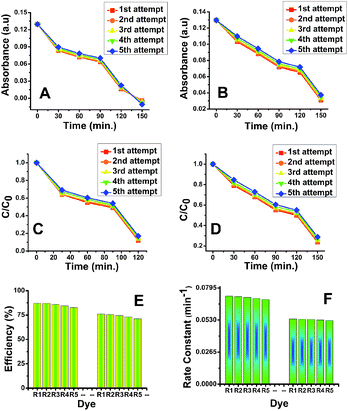
After finishing photocatalytic reaction, both phases of TiO2 catalysts were recycled via proper treatment. These TiO2 deposits were washed out, heated at 100 °C and then reused (5 times) for the degradation of the fresh MB solution. The degradation of MB using recovered titania was monitored using UV-Visible spectroscopy and results are presented in Fig. S13.† The plots of absorbance peak values vs. time (Fig. 11A and B) and C/C0 vs. time (Fig. 11C and D) clearly confirms the efficient degradation of MB during the each attempt. The degradation efficiency (%) (Fig. 11E) was marginally same as that of fresh TiO2 photocatalyst however, the photocatalytic activity of recovered catalyst was found to be slightly lower with increasing the photocatalytic time and number of cycles. The rate constants values at each attempt for both phases are presented in Fig. 11F. The results obtained indicate the effective photodegradation of MB with the recycled anatase and rutile phase nano TiO2.4. Conclusions
The titania nanoparticles were prepared using a simple and environmental friendly sol gel process using three different surfactants viz. PVP, MA and PS. The heat treatment of so-prepared nanoparticles and its characterization study revealed formation of phase pure anatase nanoparticles at 400 °C while rutile titania phase nanoparticles were obtained at 800 °C. A systematic study has been carried out for examining the photocatalytic activity of these anatase and rutile titania nanoparticles revealing efficient photocatalytic degradation of various organic dyes. Anatase phase titania (88–65%) showed enhanced degradation ability in comparison to rutile phase (77–55%) titania nanoparticles against five chosen dyes. Under short UV irradiation except for methylene blue, both phases showed almost equal decomposition rate with marginal difference in the degradation rate constant (0.0733–0.0444 min−1 for anatase and 0.0540–0.0418 min−1 for rutile) under normal reaction conditions. When long UV irradiation was employed for MB solution, the degradation efficiency observed to be around 64 and 62% for anatase and rutile phase titania which was comparatively less than photodegradation carried out under short UV. Under long UV irradiation EBT showed maximum efficiency (near about 65%) for anatase and rutile titania which was highest among other dyes. Recycling of this catalyst revealed degradation efficiency about 78–83% for anatase and 69–74% for rutile titania nanoparticles emphasizing the reuse of such catalyst for several times.Conflict of interest
The authors declare no competing financial interest.Acknowledgements
The authors are grateful to the Vice Chancellor, DIAT for providing facility for the fulfilment of this research. Funding received from CARS Project from Naval Materials Research Laboratory (NMRL), DRDO, India is gratefully acknowledged. PKK dedicates this article to his Wife-Poonam Khanna and children-Devesh and Tanaya.References
- H. Lachheba, E. Puzenata, A. Houasb, M. Ksibib, E. Elalouib, C. Guillarda and J. M. Herrmann, Appl. Catal., B, 2002, 39, 75–90 CrossRef.
- R. J. Baptista and Brooklyn, N. York Dye Ind., 2014, 7–13.
- (a) E. A. Sweeney, J. K. Chipman and S. J. Forsythe, Environ. Health Perspect., 1994, 102, 119–122 CrossRef CAS PubMed; (b) Y. Anjaneyulu, N. Sreedhara Chary and D. Samuel Suman Raj, Rev. Environ. Sci. Biotechnol., 2005, 4, 245–273 CrossRef CAS.
- (a) K. Ioannis Konstantinou and A. A. Triantafyllos, Appl. Catal., B, 2004, 49, 1–14 CrossRef; (b) K. Hashimoto, H. Irie and A. Fujishima, Jpn. J. Appl. Phys., 2005, 44, 8269–8285 CrossRef CAS.
- (a) R. Thiruvenkatachari, S. Vigneswaran and I. S. Moon, Korean J. Chem. Eng., 2008, 25, 64–72 CrossRef CAS; (b) H. A. Walter and Z. Tang, Chemosphere, 1995, 31, 4157–4170 CrossRef; (c) N. Zhang, M. Q. Yang, S. Liu, Y. Sun and Y.-J. Xu, Chem. Rev., 2015, 115, 10307–10377 CrossRef CAS PubMed.
- (a) A. Weir, P. Westerhoff, L. Fabricius, K. Hristovski and N. von Goetz, Environ. Sci. Technol., 2012, 46, 2242–2250 CrossRef CAS PubMed; (b) N. Serpone, D. Dondi and A. Albini, Inorg. Chim. Acta, 2007, 360, 794 CrossRef CAS.
- (a) L. B. Reutergardh and M. Iangphasuk, Chemosphere, 1997, 35, 585–596 CrossRef CAS; (b) N. Sadrieh, A. M. Wokovich, N. V. Gopee, J. Zheng, D. Haines, D. Parmiter, P. H. Siitonen, C. R. Cozart, A. K. Patri, S. E. McNeil, P. C. Howard, W. H. Doub and L. F. Buhse, Toxicol. Sci., 2010, 115, 156–166 CrossRef CAS PubMed.
- I. K. Konstantinou and T. A. Albanis, Appl. Catal., B, 2004, 49, 1–14 CrossRef CAS.
- S. K. Pathak, A. Abate, P. Ruckdeschel, B. Roose, K. C. Gödel, Y. Vaynzof, A. Santhala, S. I. Watanabe, D. J. Hollman, N. Noel, A. Sepe, U. Wiesner, R. Friend, H. J. Snaith and U. Steiner, Adv. Funct. Mater., 2014, 24, 6046–6055 CrossRef CAS.
- J. Yu, J. Low, W. Xiao, P. Zhou and M. Jaroniec, J. Am. Chem. Soc., 2014, 136, 8839–8842 CrossRef CAS PubMed.
- Z. Xuming, H. Kaifu, W. Hairong, Z. W. Chu and K. Paul, J. Nanosci. Nanotechnol., 2011, 11, 11200–11205 CrossRef.
- P. K. Khanna, N. Singh and S. Charan, Mater. Lett., 2007, 61, 4725–4730 CrossRef CAS.
- S. C. Pillai, P. Periyat, R. George, D. E. McCormack, M. K. Seery, H. Hayden, J. Colreavy, D. Corr and S. J. Hinder, J. Phys. Chem. C, 2007, 111, 1605–1611 CAS.
- (a) J. F. Jacobs, I. van de Poel and P. Osseweijer, Nanoethics, 2010, 4, 103–113 CrossRef PubMed; (b) M. Q Yang, N. Zhang, M. Pagliaro and Y. J Xu, Chem. Soc. Rev., 2014, 43, 8240–8254 RSC; (c) C. Han, M. Q. Yang, B. Weng and Y. J. Xu, Phys. Chem. Chem. Phys., 2014, 16, 16891–16903 RSC.
- (a) T. Ohno, K. Sarukawa and M. Matsumura, J. Phys. Chem., 2001, 105, 2417–2420 CrossRef CAS; (b) T. Luttrell, S. Halpegamage, J. Tao, A. Kramer, E. Sutter and M. Batzill, Sci. Rep., 2014, 4, 4043 Search PubMed.
- (a) Y. Li, Z. Qin, H. Guo, H. Yang, G. Zhang, S. Ji and T. Zeng, PLoS One, 2014, 9, 1–19 Search PubMed; (b) S. Shen, X. Wang, T. Chen, Z. Feng and C. Li, J. Phys. Chem. C, 2014, 118, 12661–12668 CrossRef CAS.
- Y. Liu, Y. Liu, J. Lin, H. Tan and C. Zhang, J. Adhes. Sci. Technol., 2014, 28, 1773–1782 CrossRef CAS.
- S. Zhou, Q. Xu, J. Xiao, W. Zhong, N. Yu, S. R. Kirk, T. Shu and D. Yin, Res. Chem. Intermed., 2015, 41, 7785–7797 CrossRef CAS.
- (a) K. Vidhya, M. Saravanan, G. Bhoopathi, V. P. Devarajan and S. Subanya, Appl. Nanosci., 2014, 5, 235–243 CrossRef; (b) F. Parrino, G. Camera-Roda, V. Loddo, V. Augugliaro and L. Palmisano, Appl. Catal., B, 2015, 178, 37–43 CrossRef CAS.
- (a) A. Goel and N. Rani, Eur. J. Inorg. Chem., 2012, 2, 67–73 Search PubMed; (b) S. Liu, Z. R. Tang, Y. Sun, J. C. Colmenares and Y. J. Xu, Chem. Soc. Rev., 2015, 44, 5053–5075 RSC.
- (a) P. Velusamy, S. Pitchaimuthu, S. Rajalakshmi and N. Kannan, J. Adv. Res., 2014, 5, 19–25 CrossRef CAS PubMed; (b) W. X. Li, J. Aust. Ceram. Soc., 2013, 49, 41–46 CAS; (c) L. LinsebiglerAmy, L. Guangquan and J. T. Yates Jr, Chem. Rev., 1995, 95, 735–758 CrossRef.
- (a) F. Dong, S. Guo, H. H. Wang, X. Li and Z. Wu, J. Phys. Chem. C, 2011, 115, 13285–13292 CrossRef CAS; (b) K. Hashimoto, H. Irie and A. Fujishima, Jpn. J. Appl. Phys., 2005, 44, 8269–8285 CrossRef CAS; (c) M. C. Lee and W. Choi, J. Phys. Chem. B, 2002, 106, 11818–11822 CrossRef CAS.
- (a) T. Berger, M. Sterrer, O. Diwald, E. Knözinger, D. Panayotov, T. L. Thompson and J. T. Yates Jr, J. Phys. Chem. B, 2005, 109, 6061–6068 CrossRef CAS PubMed; (b) T. L. Thompson and J. T. Yates, Top. Catal., 2005, 35, 197–210 CrossRef CAS; (c) K. Ishibashi, Y. Nosaka, K. Hashimoto and A. Fujishima, J. Phys. Chem. B, 1998, 102, 2117–2120 CrossRef CAS.
- N. Xu, Z. Shi, Y. Fan, J. Dong, J. Shi and M. Z. C. Hu, Ind. Eng. Chem. Res., 1999, 38, 373–379 CrossRef CAS.
- (a) L. B. Xiong, J. L. Li, B. Yang and Y. Yu, J. Nanomater., 2012, 2012, 13 Search PubMed , Article ID 831524; (b) C. C. Wong and W. Chu, Environ. Sci. Technol., 2003, 37, 2310–2316 CrossRef CAS PubMed.
- J. Kwon, S. J. Kim and J. H. Park, Nanoscale, 2015, 7, 10745 RSC.
- (a) S. Paul and A. Choudhury, Appl. Nanosci., 2013, 839–847 Search PubMed; (b) H. Yang, S. Zhu and N. Pan, J. Appl. Polym. Sci., 2004, 92, 3201 CrossRef CAS.
- M. Pelaez, N. T. Nolan, S. C. Pillai, M. K. Seery, P. Falaras, A. G. Kontos, P. S. M. Dunlope, J. W. J. Hamilton, J. A. Byrne, K. O'Shea, M. H. Entezari and D. D. Dionysiou, Appl. Catal., B, 2012, 125, 331–349 CrossRef CAS.
- M. C. Mathpal, P. Kumar, A. K. Tripathi, R. Balasubramaniyan, M. K. Singh, J. S. Chung and A. Agarwala, New J. Chem., 2015, 39, 6522–6530 RSC.
- (a) T. J. Trentler, T. E. Denler, J. F. Bertone, A. Agrawal and V. L. Colvin, Evaluation, 1999, 121, 1613–1614 CAS; (b) S. Bagheri, K. Shameli and S. B. A. Hamid, J. Chem., 2013, 2013, 1–5 CrossRef.
- (a) D. H. Hanaor and C. C. Sorrell, J. Mater. Sci., 2011, 46, 855–874 CrossRef CAS; (b) M. J. Gázquez, J. P. Bolívar, R. Garcia-Tenorio and F. Vaca, Mater. Sci. Appl., 2014, 05, 441–458 Search PubMed.
- M. Hema, Y. Arasi, P. Tamilselvi and R. Anbarasan, Chem. Sci. Trans., 2012, 2, 239–245 CrossRef.
- M. R. Hasan, S. B. Abd Hamid, W. J. Basirun, Z. Z. Chowdhury, A. E. Kandjani and S. K. Bhargava, New J. Chem., 2015, 39, 369–376 RSC.
- K. Suttiponparnit, J. Jiang, M. Sahu, S. Suvachittanont, T. Charinpanitkul and P. Biswas, Nanoscale Res. Lett., 2011, 6, 1 Search PubMed.
- (a) H. Berger, H. Tan and F. Levy, J. Cryst. Growth, 1993, 130, 108 CrossRef CAS; (b) S. Liu, J. Yu and M. Jaroniec, J. Am. Chem. Soc., 2010, 132(34), 11914–11916 CrossRef CAS PubMed.
- H. Jensen, A. Soloviev, Z. Li and G. Erik App, Surf. Sci., 2005, 246, 239–249 CrossRef CAS.
- J. Pan, G. Liu, G. Q. Lu and H. M. Cheng, Angew. Chem., Int. Ed., 2011, 50, 2133–2137 CrossRef CAS.
- X. Wang, G. Liu, L. Wang, J. Pan, G. Q. (Max) Lu and H. M. Cheng, J. Mater. Chem., 2011, 21, 869 RSC.
- P. Prasannalakshmi, N. Shanmugam, N. Kannadasan, K. Sathishkumar, G. Viruthagiri and R. Poonguzhali, J. Mater. Sci.: Mater. Electron., 2015, 1–10 Search PubMed.
- R. Beranek and H. Kisch, Photochem. Photobiol. Sci., 2008, 7, 40 CAS.
- M. M. Ba-Abbad, A. A. H. Kadhum, A. B. Mohamad, M. S. Takriff and K. Sopian, Int. J. Electrochem. Sci., 2012, 7, 4871 CAS.
- T. Ohsaka, F. Izumi and Y. Fujiki, J. Raman Spectrosc., 1978, 7, 321–324 CrossRef.
- S. Latthe, S. Liu, C. Terashima, K. Nakata and A. Fujishima, Coatings, 2014, 4, 497–507 CrossRef.
- (a) C. Chen, J. Liu, P. Liu and B. Yu, Adv. Chem. Eng. Sci., 2011, 1, 9–14 CrossRef CAS; (b) M. Menzinger and R. Wolfgang, Angew. Chem., 1969, 6, 438–444 CrossRef.
- J. Tschirch, R. Dillert, D. Bahnemann, B. Proft, A. Biedermann and B. Goer, Res. Chem. Intermed., 2008, 34, 381–392 CrossRef CAS.
- T. Chen, Y. Zheng, J. M. Lin and G. Chen, J. Am. Soc. Mass Spectrom., 2008, 19, 997–1003 CrossRef CAS PubMed.
- P. Wilhelm and D. Stephan, J. Photochem. Photobiol., A, 2007, 185, 19–25 CrossRef CAS.
- M. Vautier, J. Catal., 2001, 201, 46–59 CrossRef CAS.
- I. Kazeminezhad and A. Sadollahkhani, Mater. Lett., 2014, 120, 267–270 CrossRef CAS.
- A. Houas, Appl. Catal., B, 2001, 31, 145–157 CrossRef CAS.
- D. Shiri, A. Verma, C. R. Selvakumar and M. P. Anantram, Sci. Rep., 2012, 2, 1–10 Search PubMed.
- R. Zuo, G. Du, W. Zhang, L. Liu, Y. Liu, L. Mei and Z. Li, Adv. Mater. Sci. Eng., 2014, 2014, 1–7 CrossRef.
- Y. Guo, S. Yang, X. Zhou, C. Lin, Y. Wang and W. Zhan, J. Nanomater., 2011, 2011, 1–9 Search PubMed.
- M. Ma, W. Guo, Z. Yang, S. Huang and G. Wang, J. Nanomater., 2015, 2015, 538275 Search PubMed.
- J. Luan, M. Chen and W. Hu, Int. J. Mol. Sci., 2014, 15, 9459 CrossRef CAS PubMed.
- P. Singla, M. Sharma, O. P. Pande and K. Singh, Appl. Phys. A, 2013, 1–8 Search PubMed.
- A. Aleboyeh, H. Aleboyeh and Y. Moussa, Dyes Pigm., 2003, 57, 67–75 CrossRef CAS.
- I. Arslan, J. Hazard. Mater., 2001, 85, 229–241 CrossRef CAS PubMed.
- M. Neamtu, A. Yediler, I. Siminiceanu, M. Macoveanu and A. Kettrup, Dyes Pigm., 2004, 60, 61–68 CrossRef CAS.
- S. Kalpagam and T. Kannadasan, J. Chem., Biol. Phys. Sci., 2014, 4, 1936–1944 CAS.
Footnote |
| † Electronic supplementary information (ESI) available: UV, weight loss upon sintering, tabulated XRD and XPS, SEM/EDS, FTIR, BET, TGA etc. See DOI: 10.1039/c5ra20861k |
| This journal is © The Royal Society of Chemistry 2016 |

