Experimental and theoretical studies of 4,6-diamino-2-mercaptopyrimidine as a copper inhibitor in 3.5 wt% NaCl solution
Zhi Cheng,
Shi Mo,
Jing Jia,
Ji Feng,
Hong Qun Luo* and
Nian Bing Li*
Key Laboratory of Eco-Environments in Three Gorges Reservoir Region (Ministry of Education), School of Chemistry and Chemical Engineering, Southwest University, Chongqing 400715, PR China. E-mail: linb@swu.edu.cn; luohq@swu.edu.cn; Fax: +86 23 68253237; Tel: +86 23 68253237
First published on 29th January 2016
Abstract
The inhibition effect of 4,6-diamino-2-mercaptopyrimidine (DAMP) as a copper corrosion inhibitor in 3.5 wt% NaCl solution was investigated by weight loss, electrochemical impedance spectroscopy, and potentiodynamic polarization. The inhibition efficiency increased with increasing DAMP concentration in the range of 1.0 to 2.0 mM DAMP and decreased with increasing temperature. The obtained results showed that DAMP inhibited both the anodic and cathodic currents and the maximum inhibition efficiency reached 93.2% at 2.0 mM DAMP. The inhibition performance of DAMP was confirmed by SEM and EDS. Quantum chemical calculations revealed that the DAMP molecule was adsorbed on the copper surface in a paralleled way through S and N atoms and the pyrimidine ring. Adsorption of DAMP was found to obey the Langmuir adsorption isotherm.
1. Introduction
As a traditional industrial metal material, copper has been extensively used in marine surroundings due to its mechanical properties and thermal conductivities. Nevertheless, in an aggressive environment, the presence of complexing agents, such as chloride ions, will accelerate the corrosion of copper and its alloys, which may bring about great losses to the economy and human beings. Currently, numerous effective methods have been taken to alleviate the corrosion of copper and its alloys.1–7 Among them, the use of inhibitors is a cost-effective and practical choice to protect copper and its alloys in marine medium. Particularly those organic compounds, which mainly contain either N, O, S atoms or π-bonds, have attracted a lot of attention as inhibitors for the aqueous corrosion of copper.8–11 Organic molecules, which can donate electrons to unoccupied d-orbitals of metal atoms to form coordinate covalent bonds and can also accept free electrons from the metal surface by using their anti-bonding orbitals to form feedback bonds, demonstrate excellent corrosion inhibition as inhibitors.12–15 Unfortunately, many widely used inhibitors are harmful to humans, hazardous to environment and difficult to be degraded by microorganism. Therefore, it is necessary to develop green and high-efficiency organic molecules as new and better copper inhibitors. To the best of our knowledge, there are no specific researches with respect to the corrosion inhibition of 4,6-diamino-2-mercaptopyrimidine (DAMP) as a copper inhibitor so far. In view of these facts, DAMP was researched as a copper inhibitor in our study for the first time.DAMP is a non-poisonous, economical and eco-friendly medical intermediate that has been commonly used in biological field.16,17 It consists of a mercapto group, two amino groups and a nitrogen-containing six-membered heterocyclic ring. The lone electron pairs of heteroatoms and the π electrons of pyrimidine ring can significantly facilitate the adsorption of inhibitor molecule to copper surface.18 To sum up, the adsorption of an inhibitor on a metal surface relies on the structure of the inhibitor itself, the nature of the metal surface, the adsorption mode, and the characteristics of the surrounding environment.19
The aim of this paper is to explore the inhibition effect of DAMP as a corrosion inhibitor for copper in 3.5 wt% NaCl solution using weight loss measurement, electrochemical impedance spectroscopy (EIS) and potentiodynamic polarization. The surface morphologies were observed by scanning electron microscopy (SEM) and the compositions of the copper surfaces were detected by energy dispersive spectrometer (EDS). Quantum chemical calculation using density functional theory (DFT) was employed to explain the experimental results obtained in this study and to give further insight into the inhibition action of DAMP on the copper surface.
2. Experimental
2.1. Chemicals and materials
DAMP (95.0%) was purchased from Chemical Industry Co., Ltd, Tokyo, Japan. Absolute ethanol and sodium chloride were of analytical reagent grade and were purchased from Aladdin Reagent Company, China. The copper electrode with 99.99% purity and the platinum electrode were obtained from Xianren Instrument Co., Ltd, Shanghai, China.2.2. Weight loss measurements
The specimens with a rectangular shape of 2.5 cm × 1.5 cm × 0.5 cm were polished using different grades of SiC emery paper (Grade no. 800, 1200, 1500, and 2000), rinsed and degreased with ultrapure water and absolute ethyl alcohol in ultrasonic bath, respectively. Subsequently, they were dried with nitrogen at room temperature and weighed. The weight loss operations were performed in a 500 mL vessel at ambient temperature for 60 days. The specimens were then taken out and washed with ultrapure water in the ultrasonic bath for 5 min. Finally, the samples were thoroughly dried and weighed.2.3. Electrochemical measurements
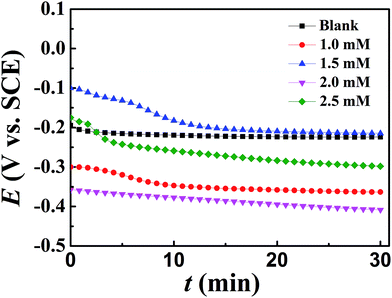
The electrochemical experiments were carried out using an Autolab electrochemical workstation (Netherlands) at 298 K. The working electrode, with an exposed area of 1 cm2 was then immersed in the test solution for half an hour to attain a steady state of open circuit potential vs. saturated calomel electrode (SCE). Impedance measurements were conducted among a frequency ranging from 100 kHz to 10 mHz and with an AC voltage amplitude of 5 mV at open circuit potential. Potentiodynamic polarization curves were recorded by altering the electrode potential automatically from −600 to 100 mV at a scan rate of 1 mV s−1.2.4. Surface characterizations
The morphologies of specimens were examined by a SEM at 20 kV after immersed in 3.5 wt% NaCl solution with and without addition of 2.0 mM DAMP for 7 days. The EDS was also applied to analyze element content variation on the copper surface. All these tests were carried out at room temperature.2.5. Theoretical calculation
Density functional theory has become an attractive theoretical method because it can give exact basic vital parameters for even huge complex molecules with low cost.20–22 Several quantum chemical methods have been carried out to correlate the inhibition efficiency of the inhibitor with its molecular properties.23–25 The reactive abilities of the inhibitors are closely linked to their frontier molecular orbitals (MO), including highest occupied molecular orbital (HOMO) and lowest unoccupied molecular orbital (LUMO), and other parameters such as energy gap (ΔE) and dipole moment (D). The adsorption energy Eads between the DAMP molecule and copper surface was acquired by the following formula:10| Eads = Etotal − ECu − EDAMP | (1) |
3. Results and discussion
3.1. Weight loss measurement
The inhibition effect of copper in 3.5 wt% NaCl solution containing different concentrations of DAMP at room temperature was studied by weight loss measurements. The inhibition efficiency (ηw) of DAMP in the corrosion of copper was calculated as follows:
 | (2) |
 | (3) |
As shown in Fig. 1, it is noticeable that the corrosion rate decreases dramatically whereas the inhibition efficiency increases considerably when DAMP is added to the solution. Then, the inhibition efficiency (ηw) keeps increasing, reaching 93.2% at 2.0 mM DAMP, while the corrosion rate (Vcorr) decreases slightly from 1.0 to 2.0 mM, reaching its lowest point at 2.0 mM. The increase of ηw and decrease of Vcorr may originate from the increased adsorption and coverage of DAMP on the copper surface with increasing inhibitor concentration. However, the inhibition efficiency begins to decline and the corrosion rate increases slightly when the concentration is enhanced, which mean that 2.0 mM DAMP is the relatively suitable concentration. These results indicate that the adsorption of DAMP on copper surface dramatically inhibits the dissolution of copper and hence the weight loss of copper is highly reduced.
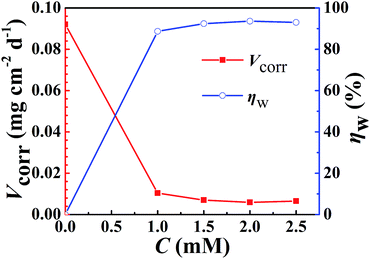 | ||
| Fig. 1 Inhibition efficiencies for copper in 3.5 wt% NaCl solution with different concentrations of DAMP at room temperature. | ||
3.2. Electrochemical studies
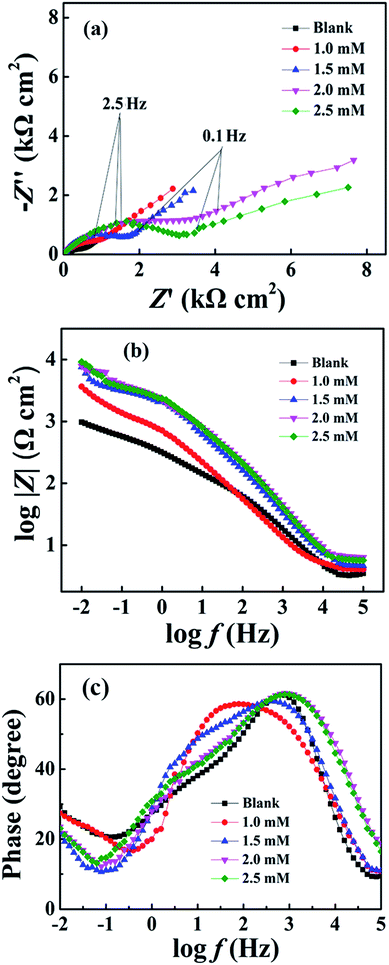 | ||
| Fig. 3 EIS results in 3.5 wt% NaCl solution with different concentrations of DAMP: (a) Nyquist plots and (b and c) Bode plots. | ||
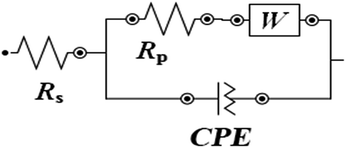
The data were analyzed by the equivalent circuit presented in Fig. 4. And the fitting results shown in Fig. 5 reveal that this equivalent circuit can describe the result well. Obviously, this equivalent circuit with one time constant is suitable for the system, especially for the plots obtained from various concentrations of inhibitor. In this study, Rs represents the solution resistance, Rp corresponds to the polarization resistance, and W represents the Warburg impedance. Because the interface of the electrode did not act as a real capacitor, a constant phase element (CPE) was used in the circuit plot to obtain a better fitting. The impedance of CPE (ZCPE) is expressed as follows:29–31
 | (4) |
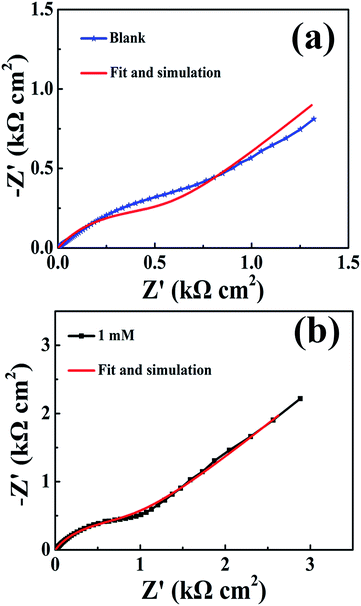 | ||
| Fig. 5 Nyquist plots and fittings for copper in 3.5 wt% NaCl solution (a) without DAMP and (b) with 1.0 mM DAMP at 298 K. | ||
The following equation was adopted to calculate the inhibition efficiency (ηp) according to the polarization resistance:
 | (5) |
The fitted equivalent circuit parameters for copper are exhibited in Table 1. The great enhancement of Rp indicates that the transportation of charge at the interface of copper electrode is significantly impeded. This may result from the reduction of available areas for the copper dissolution reaction with increasing DAMP molecules adsorbed on the electrode surface. Simultaneously, the Y0 values in CPE fall down with increasing the inhibitor concentration, which may be because the film on the copper is becoming thicker and thicker and the local dielectric constant is decreasing. Also, it is clear that among the different DAMP concentrations, all the values of n bigger than that in the blank solution, demonstrates that the surface of copper becomes more uniform and less rough. This behaviour should be attributed to the fact that more and more inhibitor molecules were adsorbed on the electrode surface.35–37 Moreover, the decline of W implies that the diffusion of soluble copper species and dissolved oxygen were also inhibited to some extent. From Table 1, the maximum inhibition efficiency (ηp) is found to be 90.3% when the concentration of DAMP is 2.0 mM.
| C (mM) | Rs (Ω cm2) | Estimated error% | Rp (Ω cm2) | Estimated error% | CPE | W | |||||
|---|---|---|---|---|---|---|---|---|---|---|---|
| Y0 × 10−5 (Ω−1 cm−2 sn) | Estimated error% | n | Estimated error% | Y0 × 10−4 (Ω−1 cm−2 sn0.5) | Estimated error% | ηp (%) | |||||
| Blank | 3.96 | 8.341 | 399 | 7.526 | 69.1 | 8.654 | 0.63 | 6.524 | 31.8 | 5.234 | — |
| 1.0 | 1.95 | 1.247 | 2509 | 1.372 | 27.76 | 0.815 | 0.76 | 0.619 | 14.49 | 0.344 | 84.1 |
| 1.5 | 1.48 | 1.985 | 3218 | 1.214 | 8.24 | 0.754 | 0.70 | 0.542 | 10.21 | 1.162 | 87.6 |
| 2.0 | 1.39 | 1.612 | 4113 | 1.182 | 4.82 | 0.985 | 0.67 | 0.985 | 7.74 | 1.857 | 90.3 |
| 2.5 | 1.44 | 1.522 | 3804 | 1.231 | 4.54 | 1.489 | 0.75 | 0.562 | 6.82 | 2.496 | 89.5 |
 | (6) |
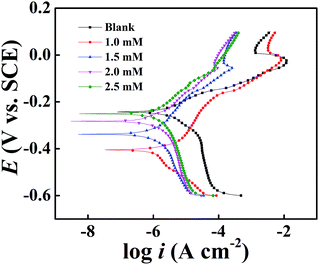 | ||
| Fig. 6 Potentiodynamic polarization curves for copper in 3.5 wt% NaCl solution with different concentrations of DAMP. | ||
| C (mM) | Ecorr (mV per SCE) | bc (mV per decade) | ba (mV per decade) | icorr (μA cm−2) | ηi (%) | θ |
|---|---|---|---|---|---|---|
| Blank | −243 | 662 | 460 | 26.56 | — | — |
| 1.0 | −405 | 86 | 214 | 3.347 | 87.4 | 87.4 |
| 1.5 | −338 | 369 | 181 | 2.444 | 90.8 | 90.8 |
| 2.0 | −251 | 485 | 139 | 2.337 | 91.2 | 91.2 |
| 2.5 | −224 | 490 | 136 | 2.329 | 91.2 | 91.2 |
Easily discerned from Fig. 6, both anodic and cathodic current densities are decreased dramatically after the addition of DAMP to the 3.5 wt% NaCl solution and the inhibition becomes more remarkable with increasing DAMP concentration, illustrating that DAMP typically acts as a mixed inhibitor. Not only the oxidative dissolution of copper but also the rate of oxygen diffusion is hindered because of the addition of DAMP to the corrosion solution.
In addition, available from the illustration, there are obvious transforms in the anodic regions, which reveal that DAMP has a huge effect on anodic reactions and inhibits the oxidation of copper. Meanwhile, the change of cathodic curves indicates that DAMP works primarily at electronic sink areas to hinder the exodus of copper ions, and secondarily as a cathodic inhibitor, prevents the oxygen reduction.38 The change of bc and ba (Table 2) with increasing inhibitor concentration also reveals that DAMP inhibits both the anodic and cathodic reactions.28 Furthermore, during the anodic and cathodic regions, the nearly paralleled Tafel lines demonstrate that the dissolution of copper and oxygen diffusion are dramatically restrained. In addition, it is clear from Fig. 7 that the curve of 2.0 mM DAMP exhibits typical Tafel behavior in both anodic and cathodic regions. These results manifest that DAMP is a good inhibitor for copper in 3.5 wt% NaCl solution.
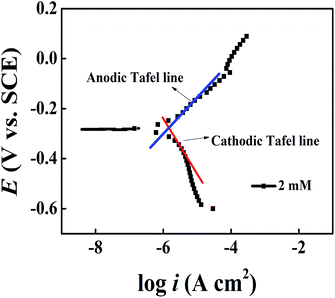 | ||
| Fig. 7 Tafel extrapolation of anodic and cathodic polarization curve in 3.5 wt% NaCl solution with 2.0 mM DAMP at 298 K. | ||
It should be aware of that when the concentration of DAMP is 1.0 mM, the presence of inhibitors contributes to a shift of corrosion potential towards the cathodic direction compared to the results obtained in the absence of inhibitor. At the same time, the cathodic corrosion current density drops down sharply and the slope of anode also changes impressively. This indicates that DAMP also acts as a mixed inhibitor even at this concentration but the current density will decline continuously with increasing concentration, which may result from the insufficiency of inhibitor on the surface of copper. As the concentration of inhibitor increases, the corrosion potential shifts towards positive direction and anodic, as well as cathodic current density, decreases gradually. This phenomenon may be attributed to the adsorption of DAMP molecules, which weakens the attack of chloride ions to copper through coating a protective film on the copper surface. This protective film almost isolates the copper from the corrosive medium. In this way, copper is well preserved.
Moreover, pitting corrosion in polarization curves during anodic region should be attributed to the formation and instability of CuCl. Apparently, the curve of copper in blank solution displays a prominently high peak current density (ipeak) at a potential of around −50 mV (SCE) and subsequently the current density, duo to the formation of CuCl that could impede the attack of corrosive media in solution, drops from the ipeak to a minimum value with increasing potential. But the current density increases again with increasing potential because of the poor stability of CuCl. In contrast, the curves of copper containing DAMP in the corrosive circumstance presents a much smaller ipeak, which indicates that the formation of CuCl is greatly inhibited. It also reveals that only few CuCl-2 produced on the copper surface.10 Owing to the adsorption of DAMP, the pitting corrosion on anodic region has been dramatically hindered when the concentration is beyond 2.0 mM DAMP. All of these may be explained by the adsorption of DAMP on the electrode surface, which inhibits the electrons transfer at the interface of copper and solution. Compared with the curve (Fig. 6) of copper in solution without inhibitor, the decline of ipeak value should be attributed to the decrease of attack caused by chloride ion on the copper surface due to the adsorption of inhibitors.39
Table 2 shows that the inhibition efficiency increases with increasing DAMP concentration from 0 to 2.0 mM. Apparently, higher inhibitor concentration leads to more compact monolayer. As a consequence, it can effectively inhibit the copper corrosion caused by chloride ions. The inhibition efficiency reaches a maximum value, 91.2%, at the concentration of 2.0 mM DAMP.
Besides, the influence of temperature on the corrosion performance of copper in the presence of 2.0 mM was investigated in the temperature range of 298–328 K using potentiodynamic polarization measurement. The relevant parameters obtained are listed in Table 3. It is evident that the current density increases and hence the corrosion efficiency decreases markedly with increasing temperature. This is because the desorption of inhibitors is accelerated with increasing temperature. This behaviour offers proofs that physisorption plays a leading role in the process of DAMP adsorption on copper surface.
| C (mM) | T (K) | Ecorr (mV per SCE) | icorr (μA cm−2) | ηi (%) |
|---|---|---|---|---|
| 2.0 | 298 | −251 | 2.310 | 91.2 |
| 308 | −253 | 4.982 | 81.2 | |
| 318 | −255 | 7.835 | 70.5 | |
| 328 | −258 | 10.97 | 58.7 |
3.3. Surface morphological observation and analysis
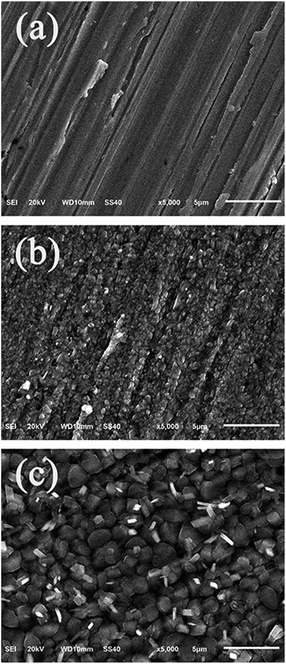
The surface morphologies of the copper specimens immersed in 3.5 wt% NaCl solution for 7 days in the absence and presence of 2.0 mM DAMP were studied by SEM and EDS. The freshly polished copper specimen seems to be smooth and only several stretches and nicks are visible on the surface as shown in Fig. 8a. It can be observed from Fig. 8b that the copper specimen immersed in the corrosive medium for 7 days without DAMP is severely corroded and damaged. The corrosion products practically cover the whole surface so that the surface is extensively roughened and destroyed. In contrast, in the presence of DAMP, it is clear from Fig. 8c that a protective film, due to the adsorption of DAMP, distributes all over the copper surface and shows an irregular stone morphology with particle sizes ranging from 1 to 3 μm in diameter. This compact layer of DAMP clusters, which is indicative for significant physical barrier behaviour of adsorbed inhibitor molecules between the metal and corrosive environment, would isolate copper from corrodents successfully and resist the attack from corrosive medium. In this case, copper would be well protected.Moreover, EDS survey spectra were also carried out to detect which elements were present or disappeared on the copper surface before and after the addition of DAMP to the solution. The corresponding EDS profile analysis results are shown in Fig. 9. It can be seen from Fig. 9a that the corrosion products, depositing on the surface of copper, may mainly be composed of oxides of copper and copper(I) chloride under inhibitor-free conditions.3 In contrast, when the inhibitor is added to the system, the additional signals of C, S, and N were observed from Fig. 9b. These data show that a carbonaceous material containing S and N atoms is covered on the copper surface, which further confirms the overlying inhibitor film of DAMP. Besides, the disappearances of O and Cl signals indicate that this film inhibited the oxidation of Cu and hence retarded the formation of copper(I) chloride and oxides of copper in the NaCl solution. The inhibitor film acts as a barrier to the diffusion of oxygen molecules as well as Cl− ions from solution to copper substrate. This inhibitor film also increases the polarization resistance of the anodic dissolution of copper (Table 1), and slows down the corrosion rate (Table 2). Therefore, DAMP is an efficient inhibitor for copper in 3.5 wt% NaCl solution.
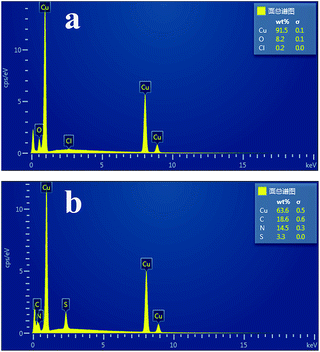 | ||
| Fig. 9 EDS analysis results of copper surface after 7 days immersion in the absence (a) and presence of 2.0 mM DAMP (b) in 3.5 wt% NaCl solution at room temperature. | ||
3.4. Theoretical calculations
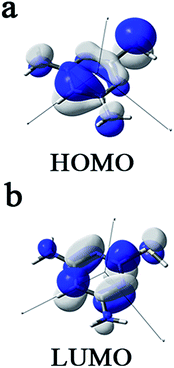
It can be seen from Fig. 10 that DAMP has similar HOMO and LUMO distributions, which are all located on the entire DAMP molecule. This is due to the presence of nitrogen and sulphur atoms together with several π-electrons on the whole molecule. Therefore, the unoccupied d-orbitals of Cu atoms can accept electrons from inhibitor molecules to form coordinate bonds. Likewise, the inhibitor molecules can accept electrons from Cu atoms with their anti-bonding orbitals to form back-donating bonds. In this case, the DAMP molecules can firmly be adsorbed on the copper surface.
Moreover, other quantum chemical parameters were calculated: electronegativity (χinh = 3.120 eV), global hardness (ηinh = 2.922 eV) and the global softness (σinh = 0.342 eV). The fraction of electrons transferred from the inhibitor to copper surface (ΔN) is obtained by using the formula:40
 | (7) |
For copper, the theoretical value of χCu and ηCu are 4.48 and 0 eV.41 The χ parameter is related to the chemical potential, which means that a higher value of χ is associated with better inhibition efficiency. Conversely, lower value of η indicates higher polarizability and higher inhibitive efficiency. Moreover, the value of ΔN, indicating the inhibition achieved from electron donations, is found to be 0.233 eV. If ΔN < 3.6 eV, it is well acknowledged that the inhibition efficiency increases with increasing electron-donation ability to copper surface.41
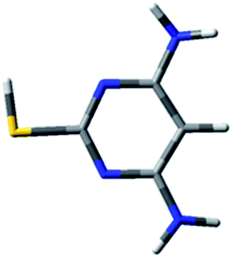
The optimized DAMP molecular structure shown in Fig. 11 displays a typical plane configuration. This kind of configuration can contribute to the largest contact area and the DAMP molecule can be adsorbed on the copper surface at a nearly zero contact angle. It reveals that the DAMP molecule can be parallelly adsorbed on the copper surface through the pyrimidine ring and heteroatoms. Accordingly, the exposed part of copper surface is covered by the coating of DAMP molecules, which prevents corrosive substances, such as chloride ions and water, from getting adsorbed on the copper surface and corroding the copper substrate. Thus, the corrosion inhibition is achieved.
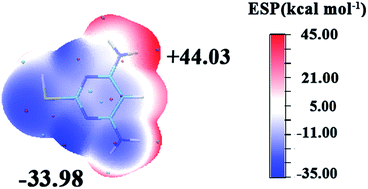
Generally, molecular electrostatic potential (MEP) is closely associated with the electronic density and it is regarded as a very helpful technique in understanding sites for electrophilic attack and nucleophilic reactions.42 The entire electron density surface mapped with molecular electrostatic potential of DAMP is shown in Fig. 12. The negative regions of the MEP are related to nucleophilic reactivity and the positive regions to electrophilic reactivity. It can be seen from the figure that electron rich regions are primarily distributed over the heteroatoms. It could be noticed that DAMP can facilitate the formation of a chelate on copper surface by transferring electrons from DAMP to copper atom d-orbital and forming a coordinate covalent bond through the chemical adsorption. In this way, the copper acting as an electrophile is inclined to attract the negatively charged sites of inhibitor molecules, and the nucleophilic centers of inhibitor molecules are normally heteroatoms with free electron pairs, functional electronegative groups and p-electrons in conjugated double bonds, which are readily available to form chemical bonds.43
 | (8) |
 | (9) |
ΔG0ads = −RT![[thin space (1/6-em)]](https://www.rsc.org/images/entities/char_2009.gif) ln(55.5Kads) ln(55.5Kads)
| (10) |
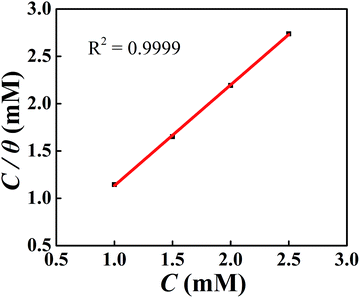
As presented in Fig. 13, the Langmuir adsorption curve of DAMP on plotting C/θ versus C is achieved. The slope of the straight line is close to 1 with a correlation coefficient of 0.9999, suggesting that the adsorption of DAMP on the copper is described well by the Langmuir adsorption isotherm. In the meantime, the value of Kads was calculated to be 14![[thin space (1/6-em)]](https://www.rsc.org/images/entities/char_2009.gif) 566 M−1 for DAMP at 298 K and the ΔG0ads value was −33.70 kJ mol−1. Generally, the value of ΔG0ads around −20 kJ mol−1 or less negative is deemed to be physisorption, which includes electrostatic reaction between the charged metal surface and the charged inhibitor molecules. Meanwhile, that around −40 kJ mol−1 or more negative is regarded as chemisorption, which involves charges sharing or transfer from the inhibitor molecules to the metal surface to form coordinate covalent bonds.50,51 Therefore, the value of ΔG0ads (−33.70 kJ mol−1) in this study signifies that the adsorption of DAMP on the copper in 3.5 wt% NaCl solution is a mixed process, involving both physisorption and chemisorptions.
566 M−1 for DAMP at 298 K and the ΔG0ads value was −33.70 kJ mol−1. Generally, the value of ΔG0ads around −20 kJ mol−1 or less negative is deemed to be physisorption, which includes electrostatic reaction between the charged metal surface and the charged inhibitor molecules. Meanwhile, that around −40 kJ mol−1 or more negative is regarded as chemisorption, which involves charges sharing or transfer from the inhibitor molecules to the metal surface to form coordinate covalent bonds.50,51 Therefore, the value of ΔG0ads (−33.70 kJ mol−1) in this study signifies that the adsorption of DAMP on the copper in 3.5 wt% NaCl solution is a mixed process, involving both physisorption and chemisorptions.
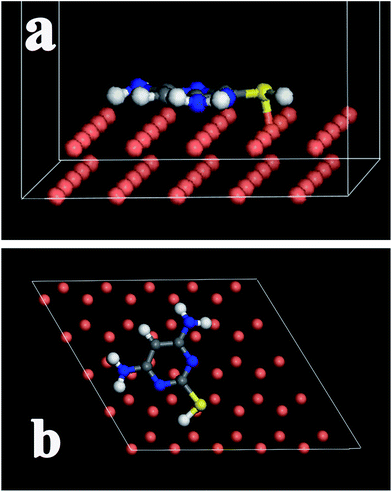 | ||
| Fig. 14 Adsorption model of DAMP molecule on the surface of Cu(1 1 1): (a) the side view and (b) the top view after optimization. | ||
Based on these massive quantum chemical calculations, the mechanism of DAMP adsorption could be concluded. First, DAMP molecule approaches copper surface and is adsorbed on it via the electrostatic interaction between N, S atoms and copper. Subsequently, a strong chemical bond, between S atom and copper, could be formed, which enables DAMP molecule to be firmly adsorbed on copper surface. In this case, copper could be well preserved.
4. Conclusions
The inhibition performance of copper corrosion in 3.5 wt% NaCl solution by DAMP is investigated using a suite of electrochemical methods accompanied with SEM, EDS, and quantum chemical studies. The principal conclusions are shown as follows:(1) DAMP expresses good inhibition for copper corrosion in 3.5 wt% NaCl solution. The optimum concentration of DAMP is 2.0 mM and the maximal value of inhibition efficiency is 93.2%.
(2) Weight loss method shows that DAMP can protect copper efficiently for 60 days.
(3) The potentiodynamic polarization shows that DAMP is a mixed inhibitor for copper in 3.5 wt% NaCl solution. It inhibits both the anodic and the cathodic current to a remarkable extent.
(4) The inhibition efficiency of DAMP decreases with increasing temperature.
(5) Data obtained from EIS suggest that the resistance of copper adsorbed with DAMP is dramatically enhanced compared to that in blank solution.
(6) SEM micrographs indicate that DAMP can efficiently inhibit the corrosion of copper by the adsorption of DAMP on the copper surface. EDS images show that DAMP can inhibit the formation of copper oxides and copper chloride.
(7) Adsorption of DAMP on copper surface follows the Langmuir adsorption isotherm.
(8) Theoretical calculations imply that S and N atoms may serve as the possible adsorption sites linking the molecule and copper. Molecular simulation reveals that DAMP can be adsorbed on the copper surface in a closely parallelled way with S–Cu bond.
Acknowledgements
This work was financially supported by the National Natural Science Foundation of China (No. 21273174) and the Municipal Natural Science Foundation of Chongqing City (No. CSTC-2013jjB00002).References
- Y. Liu, S. Y. Li, J. J. Zhang, J. A. Liu, Z. W. Han and L. Q. Ren, Corros. Sci., 2015, 94, 190–196 CrossRef CAS.
- T. Kosec, Z. Qin, J. Chen, A. Legat and D. W. Shoesmith, Corros. Sci., 2015, 90, 248–258 CrossRef CAS.
- G. Tansuğ, T. Tüken, E. S. Giray, G. Fındıkkıran, G. Sığırcık, O. Demirkol and M. Erbil, Corros. Sci., 2014, 84, 21–29 CrossRef.
- G. Rajkumar and M. G. Sethuraman, Ind. Eng. Chem. Res., 2013, 52, 15057–15065 CrossRef CAS.
- Y. C. Pan, Y. Wen, L. Y. Xue, X. Y. Guo and H. F. Yang, J. Phys. Chem. C, 2012, 116, 3532–3538 CAS.
- Z. Ghelichkhah, S. Sharifi-Asl, K. Farhadi, S. Banisaied, S. Ahmadi and D. D. Macdonald, Corros. Sci., 2015, 91, 129–139 CrossRef CAS.
- K. Zhang, L. Wang and G. Liu, Corros. Sci., 2013, 75, 38–46 CrossRef CAS.
- S. M. Tawfik, J. Mol. Liq., 2015, 207, 185–194 CrossRef CAS.
- C. C. Li, X. Y. Guo, S. Shen, P. Song, T. Xu, Y. Wen and H. F. Yang, Corros. Sci., 2014, 83, 147–154 CrossRef CAS.
- S. Hong, W. Chen, Y. Zhang, H. Q. Luo, M. Li and N. B. Li, Corros. Sci., 2013, 66, 308–314 CrossRef CAS.
- W. H. Li, L. C. Hu, S. T. Zhang and B. R. Hou, Corros. Sci., 2011, 53, 735–745 CrossRef CAS.
- K. R. Ansari, M. A. Quraishi and A. Singh, Corros. Sci., 2015, 95, 62–70 CrossRef CAS.
- Y. Lei, N. Sheng, A. Hyono, M. Ueda and T. Ohtsuka, Corros. Sci., 2013, 76, 302–309 CrossRef CAS.
- T. Lelaidier, T. Leoni, P. Arumugam, A. Ranguis, C. Becker and O. Siri, Langmuir, 2014, 30, 5700–5704 CrossRef CAS PubMed.
- M. Finšgar and D. K. Merl, Corros. Sci., 2014, 80, 82–95 CrossRef.
- E. M. Zayed, M. A. Zayed and M. El-Desawy, Spectrochim. Acta, Part A, 2015, 134, 155–164 CrossRef CAS PubMed.
- Y. Y. Zhao, Y. Tian, Y. Cui, W. W. Liu, W. S. Ma and X. Y. Jiang, J. Am. Chem. Soc., 2010, 132, 12349–12356 CrossRef CAS PubMed.
- R. Herle, S. D. Shetty, U. A. Kini and P. Shetty, Chem. Eng. Commun., 2010, 198, 120–130 CrossRef.
- S. L. Granese, Corrosion, 1988, 44, 322–327 CrossRef CAS.
- M. Li, L. Kou, L. Diao, Q. Zhang, Z. Li, Q. Wu, W. Lu, D. Pan and Z. Wei, J. Phys. Chem. C, 2015, 119, 9782–9790 CAS.
- K. Chaitanya, X. H. Ju and B. M. Heron, RSC Adv., 2014, 4, 26621 RSC.
- M. Li, L. Kou, L. Diao, Q. Zhang, Z. Li, Q. Wu, W. Lu and D. Pan, J. Phys. Chem. A, 2015, 119, 3299–3309 CrossRef CAS PubMed.
- I. B. Obot and N. O. Obi-Egbedi, Corros. Sci., 2010, 52, 657–660 CrossRef CAS.
- A. Y. Musa, A. A. H. Kadhum, A. B. Mohamad, A. A. B. Rahoma and H. Mesmari, J. Mol. Struct., 2010, 969, 233–237 CrossRef CAS.
- T. Arslan, F. Kandemirli, E. E. Ebenso, I. Love and H. Alemu, Corros. Sci., 2009, 51, 35–47 CrossRef CAS.
- A. Döner, A. O. Yüce and G. Kardaş, Ind. Eng. Chem. Res., 2013, 52, 9709–9718 CrossRef.
- P. Wang, C. Liang, B. Wu, N. Huang and J. Li, Electrochim. Acta, 2010, 55, 878–883 CrossRef CAS.
- T. T. Qin, J. Li, H. Q. Luo, M. Li and N. B. Li, Corros. Sci., 2011, 53, 1072–1078 CrossRef CAS.
- H. Ma, X. Cheng, G. Li, S. Chen, Z. Quan, S. Zhao and L. Niu, Corros. Sci., 2000, 42, 1669–1683 CrossRef CAS.
- C. H. Hsu and F. Mansfeld, Corrosion, 2001, 57, 747–748 CrossRef CAS.
- M. A. Amin, J. Appl. Electrochem., 2005, 36, 215–226 CrossRef.
- G. Y. Li, H. Y. Ma, Y. L. Jiao and S. H. Chen, Chem. Soc., 2004, 69, 791–805 CAS.
- R. Solmaz, G. Kardaş, M. Çulha, B. Yazıcı and M. Erbil, Electrochim. Acta, 2008, 53, 5941–5952 CrossRef CAS.
- R. Yıldız, Corros. Sci., 2015, 90, 544–553 CrossRef.
- C. M. Goulart, A. Esteves-Souza, C. A. Martinez-Huitle, C. J. F. Rodrigues, M. A. M. Maciel and A. Echevarria, Corros. Sci., 2013, 67, 281–291 CrossRef CAS.
- Y. Tang, X. Yang, W. Yang, Y. Chen and R. Wan, Corros. Sci., 2010, 52, 242–249 CrossRef CAS.
- R. A. Prabhu, T. V. Venkatesha, A. V. Shanbhag, G. M. Kulkarni and R. G. Kalkhambkar, Corros. Sci., 2008, 50, 3356–3362 CrossRef CAS.
- H. Tian, Y. F. Cheng, W. Li and B. Hou, Corros. Sci., 2015, 100, 341–352 CrossRef CAS.
- E. M. Sherif and S. M. Park, Corros. Sci., 2006, 48, 4065–4079 CrossRef CAS.
- L. Guo, S. T. Zhang, T. M. Lv and W. J. Feng, Res. Chem. Intermed., 2015, 41, 3729–3742 CrossRef CAS.
- A. Zarrouk, B. Hammouti, A. Dafali, M. Bouachrine, H. Zarrok, S. Boukhris and S. S. Al-Deyab, J. Saudi Chem. Soc., 2014, 18, 450–455 CrossRef.
- N. Okulik and A. H. Jubert, J. Mol. Struct.: THEOCHEM, 2006, 769, 135–141 CrossRef CAS.
- D. Daoud, T. Douadi, H. Hamani, S. Chafaa and M. Al-Noaimi, Corros. Sci., 2015, 94, 21–37 CrossRef CAS.
- S. Pournazari, M. H. Moayed and M. Rahimizadeh, Corros. Sci., 2013, 71, 20–31 CrossRef CAS.
- M. Bobina, A. Kellenberger, J. P. Millet, C. Muntean and N. Vaszilcsin, Corros. Sci., 2013, 69, 389–395 CrossRef CAS.
- S. Tu, X. Jiang, L. Zhou, M. duan, H. Wang and X. Jiang, Corros. Sci., 2012, 65, 13–25 CrossRef CAS.
- A. O. Yüce and G. Kardaş, Corros. Sci., 2012, 58, 86–94 CrossRef.
- M. A. Hegazy, A. M. Badawi, S. S. Abd El Rehim and W. M. Kamel, Corros. Sci., 2013, 69, 110–122 CrossRef CAS.
- A. Döner, E. A. Şahin, G. Kardaş and O. Serindağ, Corros. Sci., 2013, 66, 278–284 CrossRef.
- M. A. Hegazy, H. M. Ahmed and A. S. El-Tabei, Corros. Sci., 2011, 53, 671–678 CrossRef CAS.
- W. Chen, S. Hong, H. B. Li, H. Q. Luo, M. Li and N. B. Li, Corros. Sci., 2012, 61, 53–62 CrossRef CAS.
| This journal is © The Royal Society of Chemistry 2016 |

