Silk fibroin as a water-soluble bio-resist and its thermal properties

Junko Morikawaa, Meguya Ryua, Ksenia Maximova*b, Armandas Balčytisbc, Gediminas Seniutinasbc, Linpeng Fand, Vygantas Mizeikise, Jingliang Lid, Xuewen Wangbc, Massimiliano Zamengoa, Xungai Wangd and Saulius Juodkazisbc
aTokyo Institute of Technology, Meguro-ku, Tokyo 152-8550, Japan
bCentre for Micro-Photonics, School of Science, Swinburne University of Technology, John St., Hawthorn, VIC 3122, Australia. E-mail: kmaximova@swin.edu.au
cMelbourne Centre for Nanofabrication (MCN), Australian National Fabrication Facility (ANFF), Clayton, VIC 3168, Australia
dAustralian Future Fibres Research and Innovation Centre, Institute for Frontier Materials, Deakin University, Geelong, VIC 3217, Australia
eResearch Institute of Electronics, Shizuoka University, Naka-ku, Hamamatsu 432-8561, Japan

Received 30th September 2015 , Accepted 5th December 2015

First published on 11th December 2015


Abstract

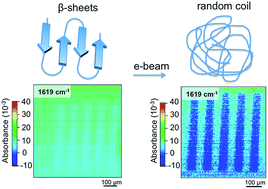
Thermal diffusivity of silk fibroin films, α = (1.6 ± 0.24) × 10−7 m2 s−1, was measured by a direct contact method. It was shown to be reduced down to ∼1 × 10⁻⁷ m2 s−1 in the crystallized phase, consistent with the multi-domain composition of β-sheet assemblies. Crystalline silk with β-sheets was made by dipping into alcohol and was used as a positive electron beam lithography (EBL) resist. It is shown by direct IR imaging of the 1619 cm−1 amide-I C[double bond, length as m-dash]O spectral signature and 3290 cm−1 amide-A N–H stretching band that an e-beam is responsible for unzipping β-sheets, which subsequently results in exposed areas returning to a water soluble state. This makes it possible to develop a water-based biocompatible silk resist and use it in lithography applications. The general principles of protein crystallization, traceable to spectral changes in IR amide bands of silk, can be used as a guide for the creation of new protein EBL resists and to quantify the electron dose required for solubility. Foam formation and laser treatments of silk can provide new approaches in surface functionalization and fabrication of 3D bio-scaffolds.


1 Introduction

Silk is a fascinating biomaterial which exhibits outstanding mechanical properties,1 and low thermal diffusivity.2 It has a millennia-old history of use as a textile material, and it steadily finds novel applications such as in water-soluble negative and positive electron beam lithography (EBL) resists,3 surface enhanced Raman scattering (SERS) sensors,4,5 and photonics,6,7 where its high optical transmissivity in the visible spectral range as well as its optical activity are exploited.8 Hybrid silk-based nanomaterials benefit from its biocompatibility and introduce novel properties such as, for example, bright fluorescence.9 Silk fibroin has been demonstrated as a promising material for numerous medical and bio-medical applications, including tissue engineering,10 biomedical textiles and implants11 and wound healing.12 Its ability to form 3D scaffolds and foams was successfully employed for tissue regeneration purposes.13,14 Due to its bio-compatibility and straightforward functionalization via carboxy –COOH and amino –NH2 moieties15 or tyrosine residues16,17 new bio-medical applications are expected.

The principal structural protein of silk fibroin can be extracted from silk worm cocoons or spider webs using a chemical procedure.18 Water-soluble silk fibroin produced in this way is described by the amorphous structure and random coil conformation. However, non-crystallized fibroin can be transformed into its crystalline form through the formation of β-sheets, thereby making the protein water-insoluble. Crystalline silk fibroin rich in β-sheets is its thermodynamically favored form, however, it was shown that β-sheets can be untangled by ultra-fast heat treatment.19 Mechanisms underlying β-sheet formation and unzipping are of fundamental interest in protein science since they can reveal the processes governing the formation of β-sheet plaques responsible for Alzheimer’s disease.

Nano-patterning of biological molecules at high resolution has always been a challenging task.20 Various top-down and bottom-up approaches have been proposed, including but not limited to nanocontact printing,21 dip-pen nanolithography22 and DNA self-assembly.23 Recent demonstration of electron beam lithography (EBL) patterning using silk resists of both negative and positive varieties will enable a wide range of applications involving the miniaturization and integration of biocompatible nanostructures. However, the electron beam induced modifications of β-sheets in a positive EBL resist have not been explicitly determined.

Another factor that should be taken into consideration during the development of nano-structured materials is their thermal properties. Thermal diffusivity in polymers used for bio-medical and SERS sensors impacts their performance when localized light intensity creates large thermal gradients in the readout regions. Hence, the determination of thermal properties and their control is required for new analytical sensor technology.

Here, thermal properties of silk resist are investigated and thermal diffusivity is measured by means of a direct contact method. Conformational changes of e-beam exposed crystalline regions of β-sheets have been revealed by direct IR spectral mapping at specific protein crystallization related spectral bands. Atomic force microscopy (AFM) of an e-beam exposed positive resist was used to probe changes in the thin film density. The modalities of the formation of silk-based 3D structures are also discussed.

2 Experimental

2.1 Materials and reagents

Silk fibroin was extracted from natural domestically grown silk worm cocoons (Bombyx mori), a gift from the Biomaterials and Tissue Engineering laboratory, Donghua University, China. All other reagents, salts and solvents were purchased from Sigma Aldrich and used without further purification.

2.2 Preparation of silk fibroin solutions, membranes, foams and films

Silk fibroin was regenerated as reported in previous studies.18 Briefly, silk cocoons were boiled in aqueous Na2CO3 solution (0.5%, w/w) three times (30 min each time), and then rinsed thoroughly with warm ultrapure water to obtain sericin-free silk fibers. The degummed dry silk fibers were dissolved in a ternary mixture of CaCl2/H2O/CH3CH2OH with molar ratio of 1[thin space (1/6-em)]:[thin space (1/6-em)]8[thin space (1/6-em)]:[thin space (1/6-em)]2 at 65 °C. Subsequently, the resulting solution was dialyzed against ultrapure water with dialysis tubing cellulose membrane (molecular weight cutoff 14 kDa, Sigma Aldrich) at room temperature for 4 days. Finally, silk fibroin was regenerated by lyophilizing the dialyzed solution.

Aqueous 4–7 wt% fibroin solutions were used to make free standing silk membranes, foams, and resist films by spin coating and drop casting. For bubble-free preparation of silk films and free-standing membranes the solution was centrifuged at 9000 rpm for 10 min to remove bubbles. For the foams, hand shaking of the solution or a desiccator was used. Typical spin coating conditions were: 500 rpm/10 s ramped up in 4 s to 4000 rpm/40 s for a typical resist film used for EBL. After spin coating, the resist was dried at 90 °C for 1 min. The resulting thickness of the resist was ∼100 ± 10 nm. To prevent charging and pattern distortions during EBL exposure a thin layer of e-spacer was spin coated on top of the resist: 2000 rpm/30 s ramped in 4 s, then 3000 rpm/30 s in 4 s with baking at 90 °C for 90 s. Free-standing membranes were prepared.

2.3 Electron beam lithography of silk resists

EBL exposure of silk resists was carried out using a Raith EBPG 5000 plus ES operating at 100 keV. The single write field was 0.5 × 0.5 mm2 and resolution ∼ 0.05 μm. Grating patterns with 50% duty cycles and periods of 100 μm and 2 μm, respectively for IR imaging and AFM investigation, were exposed in a single write field at high 20 nA e-beam current at exposure doses ranging from 600 μC cm−2 to 6100 μC cm−2.

2.4 Characterization

2.4.1 Fourier transform infra-red imaging and spectroscopy. FT-IR imaging measurements were performed with a Spectrum Spotlight 300 (PerkinElmer Inc.), which consists of a Fourier transform infrared spectrometer (Spectrum One, PerkinElmer Inc.), an infrared microscope, an automatic XYZ stage with a sample holder and mercury cadmium telluride (MCT) detectors aligned as an array of a 16 × 1 device. The sample was put on the stage, and infrared absorption images were obtained by raster scanning in XY directions. Infrared spectra were measured with transmission mode, 4000–650 cm−1 spectral region, 4 cm−1 spectral resolution and 16 scans. The imaging pixel size is 6.25 × 6.25 μm2. An attenuated total reflection Fourier transform IR (ATR-FTIR) spectrum of a small size specimen was measured with an Alpha spectrometer (Bruker), using an IRE (Internal Reflection Element) diamond crystal.
2.4.2 Thermal diffusivity measurements. Thermal diffusivity was measured directly in free-standing membranes. The direct measurement of thermal diffusivity was carried out according to ISO22007 industrial standard using ai-Phase apparatus. The contact area through which heat diffusion was measured was 250 × 150 μm2; an inductive coil was used to simultaneously measure the distance between contact pads, hence, the thickness of the film.
2.4.3 Atomic force microscopy. AFM imaging was performed using a Dimension iCon instrument (Bruker) in contact mode.

3 Results

3.1 Silk crystallization and β-sheet formation

A typical powder spectrum of fibroin is shown in Fig. 1. The amide-I band of C[double bond, length as m-dash]O stretching at 1619 cm−1 corresponds to the formation of β-sheets while its component at 1650 cm−1 is due to the C[double bond, length as m-dash]O vibrations in random coils. The prominent 3290 cm−1 band is attributable to amide-A N–H stretching while that at 2927 cm−1 is due to the C–H stretching mode. The amide II band at 1514 cm−1 is due to N–H in-plane bending. By monitoring changes in the β-sheet bands after e-beam exposure, crystallinity changes in silk can be detected. Such IR absorption is a direct and quantitative method to assess the crystallinity of a silk fibroin film; furthermore, fluorescence caused by direct protein absorption at d < 260 nm can be utilized to follow β-sheet formation.24
image file: c5ra20201a-f1.tif
Fig. 1 IR absorption spectrum (λ = 2.5–25 μm window) of silk fibroin powder, exhibiting distinct amide peaks, compared to other bio-materials: cicada wing and human hair. All spectra were measured using the ATR-FTIR method through a diamond window (Alpha-Bruker).

Spin-coated films of aqueous silk fibroin solution were used for creating EBL resist layers on thin (100 μm-thick) cover glass or Au mirror substrates for IR inspection, followed by a drying step on a hot-plate at 90 °C. A simplified method to create β-sheets by dipping the spin coated amorphous fibroin films into a 1[thin space (1/6-em)]:[thin space (1/6-em)]1 ratio MeOH/EtOH mixture overnight at RT was used. After soaking in alcohol, samples were dried in a desiccator and/or hot plate prior to EBL exposure. This procedure is a simpler method compared with keeping silk at elevated temperatures of MeOH and water vapor mixture.3,25 Fig. 2 shows amide-I band spectral changes as β-sheet crystallization occurred.


image file: c5ra20201a-f2.tif
Fig. 2 IR absorption spectrum at the amide-I band for samples spin coated for the EBL exposure: dried at 90 °C/1 min, dipped into or kept in vapor of MeOH/EtOH (1[thin space (1/6-em)]:[thin space (1/6-em)]1) solution for 12 h at 80 °C. The band at 1619 cm−1 is indicative of the formation of β-sheets.

3.2 Silk as a positive EBL resist

A positive silk resist obtained due to formation of crystalline β-sheets was exposed to a 20 keV electron beam at Ie = 500 pA current and De = 3000 μC cm−2 dose. Fig. 3 shows IR imaging of the e-beam exposed as well as subsequently developed silk resist at the vibrational band characteristic of crystalline β-sheets. EBL processing was carried out on a silk film coated over an Au mirror (Fig. 3) as well as over an IR transparent CaF2 substrate with both cases yielding identical results in terms of spectral variations recognizable in silk from IR spectrometry. Optical imaging was shown to reveal actual compositional and chemical changes, which are not related to the thickness of the resist film, as was verified by testing thicker silk membranes, as discussed in the next section.
image file: c5ra20201a-f3.tif
Fig. 3 (a) IR map of the EBL exposed region of a silk positive resist imaged at the 1619 cm−1 β-sheet spectral band. Inset shows an optical image of a sample made on an Au coating with marker lines inscribed using a 355 nm wavelength laser. E-beam exposure conditions: 3000 μC cm−2 dose at 500 pA current. (b) Same sample region as shown in (a) after development in water. Width of the EBL exposed line is 50 μm and the period is 100 μm. Thickness of the resist is ∼100 nm.

The amide-I spectral band is highly sensitive to changes in the vicinity of the oxygen atom in the C[double bond, length as m-dash]O bond, e.g. β-sheet formation via hydrogen bonding between N and O (N–H–O). It is instructive, therefore, to analyse a differential spectrum between as-prepared and e-beam exposed regions. Fig. 4 reveals that the most significant changes are indeed observed at the β-sheet (1619 cm−1) and C–N (3290 cm−1) related spectral bands. Hence, both of those spectral signatures can be used for quantification of e-beam exposure.


image file: c5ra20201a-f4.tif
Fig. 4 Differential IR spectra: intensity difference between the spectra integrated over the e-beam exposed region (2 in inset) and the as-prepared resist region (1 in inset) in the cases after e-beam exposure and after development in water. Inset shows spectral map after development at the 1619 cm−1 β-sheet band.

3.3 Thermal diffusivity

Crystallization of silk fibroin into β-sheets proceeds via the arrangement of polypeptide chains into ordered lamellas held together by hydrogen bonding between O and N on neighboring alternating linear protein segments.19 For creation of a positive EBL resist we used the described above dip and dry approach in order to crystallize amorphous regenerated silk fibroin which initially exhibits a random coil structure (Fig. 1 and 2).

The thermal diffusivity, α, is defined by the thermal conductivity, kc, the mass density, ρ, and the specific heat cp at a constant pressure as α = kc/(ρcp) and was directly measured in our experiments. In turn, kc = ρccp/3 where v is the mean velocity of the thermal energy carriers (phonons), ρc is the phonon density, and Λ = is the mean free path of the phonons defined via the thermal velocity v and average time interval between scattering events, τ. When dimensions of objects become smaller than Λ, which is typically several tens of nanometers, scattering increases, and τ is reduced, causing a decrease in Λ and kc.

Much like other proteins, silk has a high propensity towards the formation of bubbles. Thus, there were bubbles in the drop casted silk membranes prepared for direct contact thermal diffusivity measurements. For comparison, a centrifuged solution of the silk resist was used to make bubble-free films using the same drop casting method. A unique micro-contact heating and micro-thermocouple detection direct measurement method (ai-Phase) of the thermal diffusivity, α, of silk was used to determine the heat transport properties of differently prepared silk films and membranes. The thickness of the free-standing silk film was simultaneously measured using a built-in inductive circuit.

These direct measurements result in a pure silk fibroin membrane thermal diffusivity α ∼ 1.6 × 10⁻⁷ m2 s−1 (Fig. 5(a)), which closely correlates to α values obtained by means of IR imaging. This value was obtained as an average over several measurements from the same location and up to 10 different positions on the sample, thereby corresponding to different local fibroin film thicknesses (Fig. 5(b)). Since smaller 3 mm-diameter sheets were shown to develop cracks at their center, measurements were also carried out on large 22.5 mm-diameter silk samples (Fig. 5(a)). Values of α measured in the crack-free samples had a narrower distribution. This serves to resolve an earlier controversy regarding metal-like temperature diffusivity of silk measured using an indirect method.26 The direct measurement through tens-of-micrometer thick membranes provides the benchmark for other non-contact IR imaging based techniques. Fig. 5 reveals an interesting and unexpected property of decreasing temperature conductivity with increased volume fraction of crystalline phase after treatment in a methanol and ethanol mixture at 80 °C.


image file: c5ra20201a-f5.tif
Fig. 5 (a) Thermal diffusivity, α, plotted against MtOH/EtOH solution treatment duration at 80 °C. The inset shows silk sheets (respectively 3 (left) and 22.5 mm (right) in diameter) with marked locations where contact temperature wave measurements were carried out (ai-Phase). Dashed line represents image file: c5ra20201a-t1.tif (b) The dependence of α on film thickness measured for the 3 mm-diameter sheet after MtOH/EtOH solution treatments of varying duration. Longer treatment duration corresponds to a higher degree of crystallization; contact areas of 250 × 150 μm2 (ai-Phase) were used for the data shown in (a).

4 Discussion

The first study of silk as an EBL resist3 suggested that β-sheet destruction by e-beam exposure was the mechanism underlying positive tone silk resist function. Fig. 6 proves that conjecture, showing explicitly how electron exposure shifts the C[double bond, length as m-dash]O band and changes the width of the N–H band purely due to e-beam induced damage of protein structure. These changes cause the exposed regions to become water soluble, hence, their spectral signatures can be used to determine the required dose.
image file: c5ra20201a-f6.tif
Fig. 6 Electron beam exposure destroys β-sheets. Transmission of a ∼100 nm thick fibroin resist film spin coated onto a transparent CaF2 substrate. Arrows mark spectral variations of the amide-I band as fibroin transitions from a random coil structure to β-sheets, as well as when β-sheets are destroyed during e-beam exposure.

After the e-beam exposure of the silk resist the thickness of the layer decreases by 2–5 nm, with higher doses yielding lower thicknesses (Fig. 7(a) and (c)). Furthermore, the shrinking of the resist after e-beam exposure was observed for both crystallized and amorphous silk layers dried without any modifications, i.e. for both positive and negative resists. After development in water the e-beam exposed silk was completely removed (Fig. 7 (b) and (d)). The fact that e-beam exposure induces shrinking and compacting of the resist instead of swelling makes silk fibroin conducive to applications in high resolution e-beam lithography in both positive and negative tone resist modes.


image file: c5ra20201a-f7.tif
Fig. 7 AFM images of ∼100 nm thick positive silk fibroin resist film (a) after e-beam exposure of a 2 μm period grating pattern at, from left to right, 1100 μC cm−2, 2600 μC cm−2, 4100 μC cm−2 and 6100 μC cm−2 doses. Dark areas correspond to exposed regions. (b) AFM image of grating structure patterned at a 2600 μC cm−2 dose after development in water. (c) Decrease in resist film thickness plotted against e-beam exposure dose. Insets show AFM profiles of corresponding 1 μm wide e-beam exposed lines. (d) AFM profile of a 1 μm wide e-beam exposed line after development in water.

The amide-I IR absorption band which represents contributions of random coils, α-helices, peptide chain turns and bends and β-sheets is abundant in nature, e.g. it is recognizable in the cicada wing IR absorption spectrum (Fig. 2). Controlled creation of protein films with diverse crystallinity opens new possibilities to experiment with bio-compatible resists. The degree of protein crystallization can be controlled by temperature and the duration of heat treatment in vapor of water and alcohols,25 furthermore, it provides a way to tune resist sensitivity to e-beam exposure dose. This in turn can be used for the development of 3D e-beam resists.

We observed a tendency of decreased thermal diffusivity, α ≃ 1 × 10⁻⁷ m2 s−1, in films with a high β-sheet crystalline fraction (Fig. 5(a)). This is unexpected since formation of an ordered crystalline structure usually leads to an increase in Λ and kc. The density of states for phonons is expected to be larger in crystalline β-sheet regions causing augmented density of thermal carriers ρc. However, the multi-domain structure of silk crystallites favors scattering effects and one should expect lower values of α as was verified in experiments (Fig. 5(a)). It was observed that after treatment in MeOH/EtOH solution silk pellets become brittle (see inset in Fig. 5) which is consistent with the multi-domain composition of crystallites in an amorphous matrix. However, there was no clear correlation of the change in thickness of the silk membrane after alcohol solution treatment and the resulting β-sheet formation (Fig. 5(b)).

Silk can also be cast into thin films by forming foams. Foams are interesting due to their thermal insulation properties as well as their possible use as bio-compatible scaffolds. Foams were made from the very same silk solution cast on hydrophobic substrates: fluorinated Al foil or on nano-textured black Si which is hydrophobic due to the nano-needle pattern on its surface. Fig. 8 shows silk foam on black Si. Such foam is easily detachable after drying for a few minutes and can be soaked in MeOH/EtOH solution to induce crystallization, which was confirmed by direct IR imaging at the spectral band of β-sheets. Foams were also prepared by placing drop-casted silk solution with bubbles in a desiccator for 1–2 min at low pressure. Dip-coating of 3D scaffolds prepared by other methods28 into a low viscosity silk solution can prove to be a useful surface modification method.


image file: c5ra20201a-f8.tif
Fig. 8 (a) Photographs of silk foam made on a hydrophobic black-Si27 substrate. Hand-shaken aqueous solution of silk 4% wt was drop-casted onto the surface of black Si and dried. Contact angle was θc ≃ 90° (b) SEM image of laser polymerized silk on a black-Si substrate sputtered with 100 nm of gold. Laser beam λ = 800 nm/τp = 80 fs at 10 mW power and 82 MHz repetition rate was focused using a numerical aperture NA = 0.4 objective lens. Total exposure time was 4 s. Polarisation of the laser beam is marked by an arrow. Inset shows a closeup view of the edge region.

Direct laser heating of drop cast and spin coated silk film (non-crystallized) using λ = 800 nm/τp = 80 fs laser pulses was tested as a possible method to write 3D bio-scaffolds. However, there was no sign of crystallization, usually discernable as an optical contrast change in transmission,29,30 up to the dielectric breakdown intensity under moderate focusing with NA ≃ 0.45 numerical aperture objective lenses; the focal spot was 1.22λ/NA ≃ 2.2 μm in diameter. High 82 MHz repetition rate laser irradiation was used to create thermal accumulation at the focus at a typical scanning speed of 50 μm s−1 at an average power of 50–300 mW. These parameters exceed the typical conditions for laser polymerization in resists by an order of magnitude.30 In all photopolymerization experiments the silk was pure and was dried from an aqueous solution without any photoinitiator doping. The only substrate on which the laser-exposed lines were retrieved after development was black Si. Fig. 8(b) shows a single exposed spot at the same conditions used for line scanning. Silk residue was observed at the tips of the black Si, however, there was no possibility to fabricate genuine 3D micro-structures. Heat induced crystallization is, indeed, not an efficient method to form β-sheets, as was tested by direct heating at 170 °C. It was observed in our earlier studies that an onset of silk oxyluminescence at the visible green-yellow spectral region occurs starting from 180 °C, then it reaches its maximum intensity at 210 °C before thermal degradation at temperatures above 250 °C. We suppose that in the case of the laser irradiation of silk fibroin films the localized nanoscale heating of the material is more likely than the thermal emission of hot electrons thus inducing the conformational transition of the protein.31,32 The large surface area of black Si serving to facilitate adhesion of laser modified regions is also a factor. Spectral properties of such laser treated silk on black Si regions have not yet been measured to identify their crystallinity.

5 Conclusions and outlook

Thermal diffusivity of a silk resist was determined by means of direct contact measurements to be α ≃ 1.6 × 10⁻⁷ m2 s−1, which is typical for biological and synthetic polymers.33,34 Direct measurements confirm IR imaging data2 and rectify earlier statements of metal-like temperature conductivity of silk. As demonstrated previously, further control of the thermal properties of silk can be achieved by loading it with gold nanoparticles.35

IR mapping reveals a generic mechanism of protein crystallization and e-beam induced damage which renders exposed regions water soluble. Thus, various bio-polymers with similar properties could be used as positive resists for e-beam lithography. It was also demonstrated that direct or laser heating is not an efficient method to crystallize silk, however, it could find use in functionalization micro-patterning of gold-coated black Si sensing surfaces for SERS.36,37

Future studies of fibroin harvested from A. pernyi living in the wild, which is structurally different from that of domesticated B. mori investigated here, will reveal the differences in temperature conductivity due to the variations in Ala, Gly, Ser, Tyr, Asp and Arg content.38 The presence of the tripeptide sequence Arg–Gly–Asp is a signature of A pernyi fibroin and is in turn responsible for a special set of interactions with mammalian cells which leads to the promotion of cell adhesion.39 The repeated unit of (Ala)12 contributes to lower crystallinity and decreased β-sheet content of A pernyi fibroin when compared to silk extracted from B. mori.40 This makes the mechanical strength of A. pernyi fibre somewhat inferior to that of B. mori fibres. However, compared to B. mori silk A. pernyi fibroin has superior elasticity and toughness.41,42

Acknowledgements

We acknowledge support from the Bruker distributor in Japan for testing the Alpha spectrometer. SJ is grateful for partial support via the Australian Research Council DP130101205 Discovery project and a research stay support by Tokyo Institute of Technology and Top Global University project of JSPS. JM acknowledges the support of JSPS KAKENHI Grant Number 25420752.

References

  1. C. Jiang, X. Wang, R. Gunawidjaja, Y.-H. Lin, M. K. Gupta, D. L. Kaplan, R. R. Naik and V. V. Tsukruk, Adv. Funct. Mater., 2007, 17, 2229 CrossRef CAS.
  2. R. Fuente, A. Mendioroz and A. Salazar, Mater. Lett., 2014, 114, 1 CrossRef CAS.
  3. S. Kim, B. Marelli, M. A. Brenckle, A. N. Mitropoulos, E.-S. Gil, K. Tsioris, H. Tao, D. L. Kaplan and F. G. Omenetto, Nat. Nanotechnol., 2014, 9, 306 CrossRef CAS PubMed.
  4. C. Guo, G. N. Hall, J. B. Addison and J. L. Yarger, RSC Adv., 2015, 5, 1937 RSC.
  5. T. Aguayo, C. Garrido, R. E. Clavijo, J. S. Gómez-Jeria, C. A. Monasterio, M. Icaza, F. E. Moraga and M. M. C. Vallette, J. Raman Spectrosc., 2013, 44, 1238 CrossRef CAS.
  6. S. Kim, A. N. Mitropoulos, J. D. Spitzberg, H. Tao, D. L. Kaplan and F. G. Omenetto, Nat. Photonics, 2012, 6, 818 CrossRef CAS.
  7. R. Adato, A. A. Yanik, J. J. Amsden, D. L. Kaplan, F. G. Omenetto, M. K. Hong, S. Erramilli and H. Altug, Proc. Natl. Acad. Sci. U. S. A., 2009, 106, 19227 CrossRef CAS PubMed.
  8. Y. N. Chirgadze, S. Y. Venyaminov and V. M. Lobachev, Biopolymers, 1971, 10, 809 CrossRef CAS PubMed.
  9. A. Khalid, R. Lodin, P. Domachuk, H. Tao, J. E. Moreau, D. L. Kaplan, F. G. Omenetto, B. C. Gibson and S. Tomljenovic-Hanic, Biomed. Opt. Express, 2013, 5, 597 Search PubMed.
  10. N. Kasoju and U. Bora, Adv. Healthcare Mater., 2012, 1, 393 CrossRef CAS PubMed.
  11. G. Li, G. Chen, J. He, Y. Han, X. Wang and D. L. Kaplan, Adv. Healthcare Mater., 2015, 4, 1134 CrossRef CAS PubMed.
  12. E.-S. Gil, B. Panilaitis, E. Bellas and D. L. Kaplan, Adv. Healthcare Mater., 2013, 2, 206 CrossRef CAS PubMed.
  13. S. Ghosh, S. T. Parker, X. Wang, D. L. Kaplan and J. A. Lewis, Adv. Funct. Mater., 2008, 18, 1883 CrossRef CAS.
  14. E. Bellas, T. J. Lo, E. P. Fournier, J. E. Brown, R. D. Abbot, E.-S. Gil, K. G. Marra, J. P. Rubin, G. G. Leisk and D. L. Kaplan, Adv. Healthcare Mater., 2015, 4, 452 CrossRef CAS PubMed.
  15. T. Furuzono, K. Ishihara, N. Nakabayashi and Y. Tamada, Biomaterials, 2000, 21, 327 CrossRef CAS PubMed.
  16. G. Freddi, A. Anghileri, S. Samiano, J. Buchert, P. Monti and P. Taddei, J. Biotechnol., 2006, 125, 281 CrossRef CAS PubMed.
  17. A. R. Murphy, P. S. John and D. Kaplan, Biomaterials, 2008, 29, 2829 CrossRef CAS PubMed.
  18. L. Fan, H. Wang, K. Zhang, Z. Cai, C. He, X. Sheng and X. Mo, RSC Adv., 2012, 2, 4110 RSC.
  19. P. Cebe, X. Hu, D. L. Kaplan, E. Zhuravlev, A. Wurm, D. Arbeiter and C. Schick, Sci. Rep., 2013, 3, 1130 CrossRef PubMed.
  20. H. Tran, K. L. Killops and L. M. Campos, Soft Matter, 2013, 9, 6578 RSC.
  21. Z. Haung, S.-K. Kang, M. Banno, T. Yamaguchi, D. Lee, C. Seok, E. Yashima and M. Lee, Science, 2012, 337, 1517 CrossRef PubMed.
  22. K.-B. Lee, J.-H. Lim and C. A. Mirkin, J. Am. Chem. Soc., 2003, 125, 5588 CrossRef CAS PubMed.
  23. P. W. K. Rothemund, Nature, 2006, 440, 297 CrossRef CAS PubMed.
  24. I. Georgakoudi, I. Tsai, C. Greiner, C. Wong, J. deFelice and D. Kaplan, Opt. Express, 2007, 15, 1043 CrossRef CAS PubMed.
  25. X. Hu, K. Shmelev, L. Sun, E.-S. Gil, S.-H. Park, P. Cebe and D. L. Kaplan, Biomacromolecules, 2011, 12, 1686 CrossRef CAS PubMed.
  26. X. Huang, G. Liu and X. Wang, Adv. Mater., 2012, 24, 1482 CrossRef CAS PubMed.
  27. A. Žukauskas, M. Malinauskas, A. Kadys, G. Gervinskas, G. Seniutinas, S. Kandasamy and S. Juodkazis, Opt. Express, 2013, 21, 6901 CrossRef PubMed.
  28. M. Malinauskas, S. Rekštytė, L. Lukoševičius, S. Butkus, E. Balčiūnas, M. Pečiukaitytė, D. Baltriukienė, V. Bukelskienė, A. Butkevičius, P. Kucevičius, V. Rutkūnas and S. Juodkazis, Micromachines, 2014, 5, 839 CrossRef.
  29. T. Kondo, S. Juodkazis, V. Mizeikis, S. Matsuo and H. Misawa, New J. Phys., 2006, 8, 250 CrossRef.
  30. K. K. Seet, V. Mizeikis, S. Juodkazis and H. Misawa, Appl. Phys. Lett., 2006, 88, 221101 CrossRef.
  31. K. K. Seet, S. Juodkazis, V. Jarutis and H. Misawa, Appl. Phys. Lett., 2006, 89, 024106 CrossRef.
  32. K. Ueno, S. Juodkazis, T. Shibuya, V. Mizeikis, Y. Yokota and H. Misawa, J. Phys. Chem. C, 2009, 113, 11720 CAS.
  33. J. Morikawa, A. Orie, T. Hashimoto and S. Juodkazis, Appl. Phys. A, 2009, 98, 551 CrossRef.
  34. J. Morikawa, A. Orie, T. Hashimoto and S. Juodkazis, Appl. Phys. A, 2010, 101, 27 CrossRef CAS.
  35. B. Tang, L. Sun, J. Kaur, Y. Yu and X. Wang, Dyes Pigm., 2014, 103, 183 CrossRef CAS.
  36. G. Gervinskas, G. Seniutinas, J. S. Hartley, S. Kandasamy, P. R. Stoddart and S. Juodkazis, Ann. Phys., 2013, 525, 907 CrossRef CAS.
  37. G. Seniutinas, G. Gervinskas, R. Verma, B. D. Gupta, F. Lapierre, P. R. Stoddart, F. Clark, S. L. McArthur and S. Juodkazis, Opt. Express, 2015, 23, 6763 CrossRef PubMed.
  38. J. He, Y. Cheng, P. Li, Y. Zhang, H. Zhang and S. Cui, Iran. Polym. J., 2013, 22, 537 CrossRef CAS.
  39. S. Yan, C. Zhao, X. Wu, Q. Zhang and M. Li, Sci. China: Chem., 2010, 53, 535 CrossRef CAS.
  40. S. Ling, Z. Qi, D. P. Knight, Y. Huang, L. Huang, H. Zhou, Z. Shao and X. Chen, Biomacromolecules, 2013, 14, 1885 CrossRef CAS PubMed.
  41. S. Du, J. Li, J. Zhang and X. Wang, Mater. Des., 2015, 65, 766 CrossRef.
  42. H. Tao, D. L. Kaplan and F. G. Omenetto, Adv. Mater., 2012, 24, 2824 CrossRef CAS PubMed.

This journal is © The Royal Society of Chemistry 2016
Click here to see how this site uses Cookies. View our privacy policy here.