A new functionalized magnetic nanocomposite of poly(methylacrylate) for the efficient removal of anionic dyes from aqueous media

Ali Pourjavadi*, Azardokht Abedin-Moghanaki and Seyed Amirhossein Nasseri
Polymer Research Laboratory, Department of Chemistry, Sharif University of Technology, Azadi Avenue, P.O. Box 11365-9516, Tehran, Iran. E-mail: purjavad@sharif.edu

Received 29th September 2015 , Accepted 10th January 2016

First published on 14th January 2016


Abstract

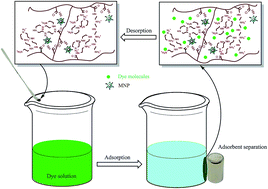
A new magnetic nano-adsorbent was synthesized via the radical polymerization of methyl acrylate on modified Fe3O4 nanoparticles, followed by its functionalization by amidation of the methyl ester groups using pentaethylenehexamine, to create active adsorption sites for removing anionic dyes from aqueous media. Physicochemical properties of the adsorbent were then characterized by SEM, TEM, XRD, FTIR, TGA and CHN analysis. The prepared nanocomposite was used as adsorbent for the removal of anionic dyes, naphthol green B and chromeazurol S, from aqueous solution and assessed in view of the kinetics and isotherm adsorption, and the effect of solution pH, contact time and initial dye concentration on adsorption capacity. Although the pH of the solution influences the surface charge of the adsorbent, in general the adsorption capacity is significant at the studied pH values. Kinetics and isotherm studies of dye adsorption indicated that the adsorption process followed pseudo-second-order kinetic and Langmuir isotherm models, respectively. The prepared adsorbent shows very high efficiency and adsorption capacity in the removal of anionic dyes, which in terms of performance are much better than most of the other adsorbents reported earlier. The maximum adsorption capacities obtained for naphthol green B and chromeazurol S were 1583 and 1348 mg g−1, respectively, at natural pH. Moreover, recycling experiments confirmed that this adsorbent could be regenerated without a significant loss of adsorption ability or weight.


1. Introduction

Nowadays, water and safe water are important to save the earth and their impact on human health is what we need to pay attention to. With population growth and rapid development of science and technology, numerous toxic pollutants like dyes and heavy metal ions are produced and discharged into water, which even in a small amount can cause severe toxic effects in the aquatic environment and human beings by mutagenic, carcinogenic and teratogenic properties.1–4 Among these pollutants, organic dyes are a kind of extremely harmful contaminant that are widely used in various industries such as textiles, plastics, leather, cosmetics and so on.5,6 Most of the dyes are resistant to natural conditions such as photodegradation and biodegradation in the environment, due to their complex aromatic molecular structures.7–9 Therefore, the removal of dyes from the wastewater of industrial effluents before discharging them into the ecosystem is really essential. A variety of techniques have been used to treat dye wastewater that includes photocatalytic degradation,10 chemical coagulation,11,12 electrochemical processes,13–15 chemical oxidation,16 membrane filtration17,18 and adsorption.19–24 Among the above-mentioned treatment processes, adsorption techniques have received a great deal of attention for dye removal due to their low cost and high efficiency.25,26 Moreover, the adsorption process offers simplicity in design, wide adaptability, reusability, and ease of operation.27,28 Therefore, this technique is interesting for the uptake of dyes from wastewater. Adsorption behavior depends highly on the nature of the adsorbent, especially its porosity and surface area.29,30 Many adsorbents have been developed based on activated carbons, clays, zeolites, agricultural wastes and polymeric materials.31–36 Nevertheless, long adsorption time, low adsorption capacity and separation inconvenience limit their applications in practice.37 Therefore, it is an important challenge to prepare novel promising adsorbent for water purification without the above-mentioned problems.

Currently, among the numerous types of adsorbents, magnetic nanoparticles (MNPs) attracted considerable attention as adsorbent materials for organic dyes and heavy metals, due to their high surface area, reusability, convenient separation and high reactivity for contaminant removal.38 Many functionalized MNPs have been developed for the removal of toxic pollutants from water stream. Zhang et al.39 functionalized MNPs with 3-glycidoxypropyltrimethoxysilane and glycine which are able to effectively remove both anionic and cationic dyes from aqueous media. Tong et al.40 modified MNPs by grafting poly(1-vinylimidazole) oligomer and investigated their application as a novel adsorbent to remove Hg(II) from water.

Although many researches have been performed on the use of modified MNP by polymers and small organic molecules as adsorbent, only few studies have been reported for functionalized polymer-based magnetic nanocomposites until now. Functionalized polymer-based magnetic nanocomposites will be more effective adsorbent than MNPs modified by crude polymers or small organic molecules, because of the presence of abundant active sites and large surface area that significantly increase their adsorption capacity. Moreover, it is worth noting that the presence of MNPs in the structure of nancomposite facilitates separation of the adsorbent so that they can be readily separated from dye solution after adsorption process by an external magnetic field. Therefore, in this paper, preparation of a novel nano-adsorbent combining the unique properties of magnetic nanoparticles and a cross-linked basic polymer functionalized by pentaethylenehexamine was reported. The structure of nanocomposite was characterized and its properties were studied in details. The as-prepared adsorbent was used to remove naphthol green B (NG) and chromeazurol S (CA) from water, which are the typical anionic dye pollutants. The kinetic and isotherm analyses and the effect of different experimental conditions on the removal of dyes were also investigated. In addition, regeneration and reusability of the new adsorbent was evaluated.

2. Experimental

2.1. Material

Ferric chloride hexahydrate, ferrous chloride tetrahydrate, ammonia (30%), hydrochloric acid, tetraethyl orthosilicate (TEOS), (3-aminopropyl)trimethoxysilane (APTS), N,N′-methylenebisacrylamide (MBA) and dyes (Fig. S1) were obtained from Merck. 2,2-Azobisisobutyronitrile (AIBN) was purchased from Daejung chemical & metal company in Korea. Analytically pure methyl acrylate (MA) was purchased from East of China Chemical Corporation. Pentaethylenehexamine (PEHA) was from ACROS organics and all solvents were analytical grade.

2.2. Characterization

FT-IR spectra of all samples were obtained on ABB Bommem MB-100 spectrometer using KBr pellet with 5 scan in the range of 4000–400 cm−1. Thermogravimetric analyses (TGA) of samples were recorded from room temperature to 600 °C at a heating rate of 10 °C min−1 under a nitrogen atmosphere by a TGA Q 50 thermogravimetric analyzer. The morphology of products were studied by scanning electron microscope (SEM) Philips, XL30. A TOPCON-002B electron microscope was used for taking transmission electron microscopy (TEM) images. CHN analyses were performed in triplicates by LECO TRUSPEC elemental analyzer. Rigalcu D/Max-3c X-ray diffractometer was used for acquiring XRD pattern. A Perkin Elmer lambda-25 UV-vis spectrometer was employed to determine organic dye concentration in aqueous solution.

2.3. Preparation

Fe3O4 magnetic nanoparticles were prepared according to chemical co-precipitation method reported in previous studies.41 In brief, the resulting Fe3O4 nanoparticles (2 g) were dispersed in 100 mL of an ethanol–water mixture (4[thin space (1/6-em)]:[thin space (1/6-em)]1) by ultrasonication for 10 min. 4 mL of TEOS was then added dropwisely to the suspension at 40 °C under stirring for 30 min. The pH of this mixture was adjusted to 10 by slow addition of ammonium hydroxide and left the solution under stirring for 8 h. As a result, the silica coated nanoparticles (MNP) were magnetically separated and then washed three times with 30 mL of ethanol. The MNP were then modified with APTS to introduce amine groups. Typically, 2 g MNP nanoparticles were re-dispersed in 60 mL toluene by ultrasonication for 10 min prior to the addition of APTS. 4 mL APTS was dropped into the suspension and the mixture was refluxed for 20 h. Finally, Fe3O4@SiO2–functionalized-NH2 nanoparticles (MNP-NH2) was magnetically separated, washed three times with 20 mL of ethanol and dried at 40 °C for using in the next step.

0.5 g of MNP-NH2 nanoparticles were homogenized by ultrasonication in 20 mL chloroform for 10 min. 5 g of methyl acrylate and 0.35 g of MBA in the presence of 0.09 g of AIBN as an initiator agent were then added to the suspension to initiate cross-linking polymerization. The gelation reaction was performed under stirring at 60 °C during 1 h. The resulting magnetic cross linked poly(methylacrylate) (MPM) was magnetically collected and washed two times with 20 mL of methanol to remove excess MA monomers and other excess reactants.

3 g of MPM was milled and dispersed in 20 mL of methanol. An excess amount of PEHA (10 mL) was then added and the mixture was refluxed under continuous stirring for 5 days. The final product (MPM–PEHA) was magnetically separated and washed thoroughly with 20 mL of methanol and then left to dry at 50 °C for 12 h.

2.4. Adsorption and desorption experiment

All the adsorption experiments were carried out using 20 mL dye solution of known concentration and 20 mg of adsorbent with a shaking speed of 300 rpm at room temperature. The effect of pH on the adsorption of MPM–PEHA adsorbent for NG was evaluated in the range of 2–10. The initial pH values of solutions were adjusted using 0.1 M NaOH and HCl solutions. Moreover, adsorption of NG and CA from aqueous solution was investigated in terms of adsorption isotherm with initial dye concentrations in the range of 200–2000 mg L−1 and kinetic with contact time 0–180 min at the natural pH. After treatment, the adsorbent was separated from the solution using a magnet and the residual concentration of dyes determined by the UV-visible spectrophotometer at maximum wavelength of dyes. All experiments were performed in triplicates. Statistical methods were used to determine the mean values and error bars.

In order to study reusability of the MPM–PEHA adsorbent, 0.1 g dye-loaded adsorbent was added to 100 mL mixture of methanol and NaOH (0.05 mol L−1). The mixture was shaken for 120 min to reach desorption equilibrium at room temperature. Then, MPM–PEHA nanocomposite was magnetically separated and washed with water to remove unabsorbed dyes and excess NaOH. 20 mg of regenerated adsorbent was added to 20 mL of the dye solution at the known concentrations for 100 min. This process was repeated five times.

The adsorption capacity (q) and removal efficiency (R) can be calculated by the following equations:

 
image file: c5ra20151a-t1.tif(1)
 
image file: c5ra20151a-t2.tif(2)
where, C0 and C are the initial concentration and the amount of dye left after treatment with adsorbent (mg L−1), respectively, V is the volume of dye solution (L) and W is the mass of the adsorbent (g).

3. Results and discussion

3.1. Preparation and characterization of the adsorbent

A schematic illustration of MPM–PEHA nanocomposite synthesis is shown in Fig. S2. The first step in the synthesis of MPM–PEHA adsorbent involves the formation of magnetic Fe3O4 nanoparticles using a co-precipitation method in an alkaline solution. The Fe3O4 surface is coated by a shielding layer of tetraethyl orthosilicate, which improved its stability against heat and harsh reagents.42 In the next step, the surface of Fe3O4@SiO2 is functionalized with APTS, to covalently attachment of poly(methacrylate) (PMA) onto the surface of MNP via amidation reaction between amine groups of MNP-NH2 and ester groups of poly(methylacrylate). MPM is synthesized by cross-linking radical polymerization of methyl acrylate as a monomer, AIBN as an initiator and MBA as the cross-linking agent in the presence of MNP-NH2 nanoparticles. During the reaction, polymer chains attach to the surface of MNP-NH2 to form a robust shell through the aforementioned amidation reaction.

Finally, PEHA are immobilized on the MPM nanocomposite through the reaction between amine groups of PEHA and ester functionality (–CO2CH3) on the surface of MPM to form MPM–PEHA nanoadsorbent. Immobilization of PEHA on the surface of MPM nanocomposite, provide the desired adsorbent for anionic dyes.

To confirm the structure of products, the reactions were monitored by FTIR, as shown in Fig. 1.


image file: c5ra20151a-f1.tif
Fig. 1 FT-IR spectra of MNP (a), MNP-NH2 (b), MPM (c) and MPM–PEHA (d).

In the spectrum of MNP, the stretching vibrations of Fe–O and Si–O are highlighted at 617 and 1090 cm−1, respectively. APTS coating on the MNP is confirmed by the peaks observed at 1486, 1639 and 2940 cm−1 in Fig. 1b, which are attributed to bending and stretching vibration of NH2 groups and C–H bond, respectively.43 Fig. 1c shows a vibration bond in 1735 cm−1 which is related to ester carbonyl groups of PMA. Finally, conversion of –CO2CH3 groups in the polymer shell to CONH– functionality and formation of the final adsorbent is confirmed by elimination of the ester C[double bond, length as m-dash]O peak and appearance a strong peak at 1655 cm−1 related to the stretching vibration of amide groups (Fig. 1d).

The results of elemental analysis for MNP-NH2, MPM and MPM–PEHA are represented in Table 1. Changing in C, N and H percentages in each step of adsorbent synthesis, indicates the successful immobilization of the organic moieties.

Table 1 The results of CHN analysis for MNP-NH2, MPM, MPM–PEHA
Compound C (%) H (%) N (%)
MNP-NH2 6.1 ± 0.1 1.024 ± 0.003 0.621 ± 0.003
MPM 42.8 ± 0.3 6.07 ± 0.06 0.92 ± 0.03
MPM–PEHA 47.9 ± 0.3 9.11 ± 0.08 23.53 ± 0.25


Thermogravimetric analysis (TGA) of the MNP-NH2, MPM and MPM–PEHA were also investigated over the temperature range of 25–600 °C. The weight loss at around 150 °C is due to the evaporation of adsorbed water molecules. The TGA curve of MNP-NH2 shows 4% weight loss which is attributed to the decomposition of APTS (Fig. 2a). Probing the TGA curves of MPM indicated about 50% increase in weight loss compared to MNP-NH2 which is associated to the degradation of the PMA shell (Fig. 2b). On the other hand, by comparing TGA curves of MPM and MPM–PEHA, it can be found that the loading amount of PEHA on the surface of MPM is about 16% wt (Fig. 2c).


image file: c5ra20151a-f2.tif
Fig. 2 TGA curves of MNP-NH2 (a), MPM (b) and MPM–PEHA (c).

These results implied that the MPM–PEHA nanocomposite was successfully prepared and could be applied to remove the anionic dyes from wastewater.

As illustrated in Fig. 3, the XRD pattern of the synthesized adsorbent reveals the presence and degree of crystallinity of Fe3O4 magnetic nanoparticles. The diffraction peaks are in good agreement with XRD pattern of a standard Fe3O4 sample and indicated that the Fe3O4 microstructures were not changed after all modifications. The broad peak at 2θ = 20° is assigned to the amorphous silica phase in the adsorbent structure.


image file: c5ra20151a-f3.tif
Fig. 3 XRD pattern of the MPM–PEHA nanocomposite.

The morphology of MPM and MPM–PEHA were studied by SEM (Fig. 4a and b and S3). From this study, it was found that the surfaces of both of these compounds are rough and irregular. However, as clearly observed, the surface morphology of nanocomposite was greatly changed after the functionalization by PEHA. The compact and granular structure surface of MPM changed after functionalizing with PEHA in the form of “blooming”. Moreover, TEM was also used to examine the dimension and morphologic features of adsorbent (Fig. 4c and S4). The TEM image of the MPM–PEHA nanocomposite showed a uniform distribution of dark magnetic nanoparticles that are encapsulated by grey polymer shells. The size of MNP particles are varied from 5 to 10 nm.


image file: c5ra20151a-f4.tif
Fig. 4 SEM images of MPM (a) and MPM–PEHA nanocomposite, and TEM image of MPM–PEHA nanocomposite.

3.2. Effect of pH

The pH of dye solution is one of the important parameters in adsorption process. Herein, we studied only the effect of pH on adsorption of NG, as CA color changes by changing the pH. Therefore, the effect of pH on the adsorption capacity of MPM–PEHA for NG was investigated by varying the pH solution from 2 to 10 with constant initial dye concentration of 2000 mg L−1 at room temperature (Fig. 5). As represented in Fig. 5, the adsorption capacity is constant under the acidic condition of less than pH 4, after that the adsorption capacities decreased gradually with increasing pH. As reported in previous studies, the pH of solution affects both the ionization degree of the dye molecules and surface charge of adsorbent.44,45 Accordingly, the functional groups of amine (–NH2, –NH–) on MPM–PEHA adsorbent were protonated to ammonium cations in acidic pH value.46 The protonated amine groups on the MPM–PEHA nanocomposite adsorbed a large number of negatively charged anionic dye molecules in the solution via electrostatic attraction. In contrast, as pH increased, the positively charged adsorption sites on the surface of MPM–PEHA adsorbent decreased, which lead to reduce electrostatic attraction between anionic dye molecules and adsorbent. However, as shown in Fig. 5, a significant absorption due to the presence of hydrogen bonds between the adsorbent and dye molecules in alkaline pH was present.
image file: c5ra20151a-f5.tif
Fig. 5 The effect of pH on adsorption of NG by MPM–PEHA adsorbent.

3.3. Effect of contact time

From an economical point of view, the rate of adsorption process is of great importance in the applications of adsorbent for wastewater treatment systems. It also provided useful information about the productivity and the feasibility of large-scale operations. Therefore, the kinetic experiments were conducted in known dye concentration (2000 mg L−1) for both NG and CA. The effect of contact time on the amount of their removal by MPM–PEHA is depicted in Fig. 6a. As shown in Fig. 6a, the NG and CA were effectively removed from solution during the initial 30 and 15 min, respectively. The adsorption capacity of the dyes reached equilibrium in about 100 min for NG and 80 min for CA, which is in good agreement with the practical applications. The fast dye adsorption process in the initial time is attributed to the availability of more active sites on the adsorbent. But thereafter, rate of dye adsorption decreased due to the occupation of active sites and reduction of diffusion rate of dye molecules into the inner space of MPM–PEHA adsorbent.47
image file: c5ra20151a-f6.tif
Fig. 6 The effect of contact time on adsorption of NG and CA (a), pseudo-first-order (b) and pseudo-second-order (c) kinetic models for NG and CA by MPM–PEHA adsorbent.

In order to accurately evaluate the adsorption behaviors of anionic dyes onto the MPM–PEHA adsorbent, two well-known kinetic models, pseudo-first-order and pseudo-second-order, were applied which elucidated the adsorption kinetic process.48,49

The pseudo-first-order model equation is applied for fitting the adsorption of a liquid/solid system based on solid capacity, which is expressed as:

 
ln(qeqt) = ln[thin space (1/6-em)]qek1t (3)

While, the pseudo-second-order model is used to predict the adsorption behavior during the entire adsorption period and is in accordance with the adsorption mechanism of rate-controlling steps, which can be expressed as following equation:

 
image file: c5ra20151a-t3.tif(4)
where, t (min) is the contact time, qt (mg g−1) and qe (mg g−1) are the adsorption capacities of MPM–PEHA at time t and equilibrium, respectively, while k1 (min−1) and k2 (g (mg−1 min)) are the pseudo-first-order and pseudo-second-order adsorption rate constant, respectively.

The initial adsorption rate (v0) of dyes is also obtained using the pseudo-second-order model according to the eqn (5):

 
v0 = k2qe2 (5)

The fitted curves are shown in Fig. 6b and c, and the calculated results are listed in Table 2. From Fig. 6b and c and the corresponding parameters summarized in Table 2, it was found that the kinetic behavior of anionic dyes adsorption onto the MPM–PEHA adsorbent is more appropriately described by the pseudo-second-order kinetic model due to a higher correlation coefficient (R2). Furthermore, it was also observed that the calculated adsorption capacities by pseudo-second-order model (1695 mg g−1 for NG and 1389 mg g−1 for CA) was closer to the experimental qe values (1583 mg g−1 for NG and 1348 mg g−1 for CA) relative to that derived from the pseudo-first-order model (2176 mg g−1 for NG and 756 mg g−1 for CA). These results revealed that the chemical adsorption in the above-investigated nano-adsorbent may be the rate-limiting step.50

Table 2 Kinetic parameters for pseudo-first-order and pseudo-second-order models
Dye qe,expt (mg g−1) Pseudo-first-order kinetic model Pseudo-second-order kinetic model
k1 (min−1) qe,cal (mg g−1) R2 v0 (mg g−1 min−1) k2 (g mg−1 min−1) qe,cal (mg g−1) R2
NG 1583 0.0393 2176 0.9642 73 2.5 × 10⁻⁵ 1695 0.9974
CA 1348 0.0312 756 0.9707 182 9.4 × 10⁻⁵ 1389 0.9999


3.4. Effect of initial concentration

The effect of initial dye concentration on the adsorption capacity of MPM–PEHA adsorbent was investigated and the results are shown in Fig. 7a. The results revealed that with increasing the initial dye concentration, the equilibrium adsorption capacity of the dye (qe) was dramatically increased. The qe remained nearly constant as the dye solution reached the corresponding concentration. At a lower initial dye concentration, numerous active sites on the surface of adsorbent interacted with dye molecules, which in turn resulted in a significant enhancement of equilibrium adsorption capacity of dyes.
image file: c5ra20151a-f7.tif
Fig. 7 The effect of initial dye concentration on adsorption capacities (a) linear forms of adsorption isotherms: Langmuir (b) and Freundlich (c) models for NG and CA by MPM–PEHA adsorbent.

Adsorption isotherm models were also used to describe the interactive behavior of adsorbent and adsorbate as well as the distribution of adsorbed molecules between the liquid and solid phase.51 Two well-known adsorption isotherms, Langmuir and Freundlich models, were used to describe and analyze the adsorption isotherm.

The Langmuir adsorption isotherm predicts monolayer adsorption occurring on the homogeneous surface of adsorbent with a limited number of uniform binding sites and lack of migration between adsorbents. Langmuir equation is expressed as:

 
image file: c5ra20151a-t4.tif(6)

One of the earliest models in describing the non-ideal and reversible adsorption is Freundlich isotherm. This empirical model can be applied to multilayer adsorption, with non-uniform distribution of adsorption heat and affinities over the heterogeneous surface. The mathematical expression of Freundlich model is expressed as follows:

 
image file: c5ra20151a-t5.tif(7)
where, qe and qmax (mg g−1) are the equilibrium and maximum adsorption capacity of dye on the adsorbent, respectively, Ce (mg L−1) is the concentration at equilibrium and n is the heterogeneity factor. kL and kF are the Langmuir and Freundlich isotherm constants, respectively.

The detailed information of the Freundlich and Langmuir model parameters are summarized in Table 3. As presented in Fig. 7 and Table 3, it was found that the values of R2 for Langmuir isotherm were closer to unity and were better than the Freundlich isotherm for both dyes. These findings may be explained due to the homogeneous distribution of active sites on the surface of MPM–PEHA.5,52 In addition, from the slopes of the linear plots of Ce/qe versus Ce, the maximum adsorption capacities of the MPM–PEHA for NG and CA were calculated (Table 3). These values were in good agreement with the experimental adsorption capacities, and further highlighted applicability of Langmuir model to explain the adsorption behavior of NG and CA on the MPM–PEHA adsorbent.

Table 3 Adsorption isotherm parameters of Langmuir and Freundlich models
Dye Langmuir isotherm model Freundlich isotherm model
qmax (mg g−1) kL (L mg−1) R2 kF (mg1−(1/n) L1/n g−1) n R2
NG 1639 0.0521 0.9902 356.56 3.537 0.8708
CA 1370 0.0408 0.9975 258.58 3.393 0.9361


Furthermore, a comparison of the results obtained within this study and previously reported adsorbents for NG and CA were exhibited in Table 4. Interestingly, it is obvious that the adsorption capacity of MPM–PEHA nanocomposite is considerably higher than the other types of previously reported adsorbents, which is shown that MPM–PEHA is a potential adsorbent for adsorptive removal of NG and CA from aqueous solution.

Table 4 Comparison of MPM–PEHA with some previously reported adsorbents
Adsorbents Dye qm (mg g−1) Time (min) Ref.
Metal hydroxides sludge (MHS) NG 10 15 53
Torreya-grandis-skin-based activated carbon NG 545 180 54
Commercial activated carbon NG 130 30 55
Layered double oxides NG 193 80 56
MPM–PEHA NG 1583 100 This study
Nanotubular halloysite clay CA 35 57
MPM–PEHA CA 1348 80 This study


3.5. Recycling study

The reusability for MPM–PEHA adsorbent was evaluated by comparing adsorption capacity of NG and CA on regenerated and fresh adsorbent (Fig. 8). It was stable (up to 5 adsorption–desorption cycles) without significant decrease of their removal efficiency. Therefore, MPM–PEHA adsorbent can be regenerated and reused for several times. Notably, the presence of magnetic nanoparticles facilitates separation and recovery of MPM–PEHA adsorbent.
image file: c5ra20151a-f8.tif
Fig. 8 Reusability of the adsorbent.

4. Conclusion

In conclusion, a new magnetic nanocomposite (MPM–PEHA) was successfully prepared, in which cross-linked poly(methylacrylate) coated on modified MNPs was functionalized by PEHA, to create further active adsorption sites for removing anionic dyes from aqueous media. The present study on MPM–PEHA nanocomposite highlighted the application of MPM–PEHA as an effective and efficient adsorbent for the removal of anionic dyes from aqueous solution. The maximum adsorption capacities were found to be 1583 mg g−1 and 1348 mg g−1 for NG and CA, respectively, which is higher than the other types of adsorbents reported in the literature. Adsorption behavior was investigated under various conditions, including solution pH, contact time and initial dye concentration. Adsorption capacity increased with increasing initial dye concentration and contact time and decreasing pH. The electrostatic and hydrogen bonding interactions was found to play an important role in the adsorption process. Kinetic and isotherm studies of adsorption clearly indicated that the adsorption process were well-described by pseudo-second-order kinetic and Langmuir isotherm models, respectively. The adsorbent was regenerated and reused up to five cycles of adsorption–desorption and no significant reduction in removal efficiency was observed.

The advantages of using MPM–PEHA nanocomposite as an adsorbent are two fold: it not only acts as an effective and efficient adsorbent for NG and CA compared with the other existing adsorbents, but also separates easily from dye solution after adsorption process by an external magnetic field.

References

  1. H. Gao, T. Kan, S. Zhao, Y. Qian, X. Cheng, W. Wu, X. Wang and L. Zheng, J. Hazard. Mater., 2013, 261, 83–90 CrossRef CAS PubMed.
  2. M. A. Brown and S. C. De Vito, Crit. Rev. Environ. Sci. Technol., 1993, 23, 249–324 CrossRef CAS.
  3. Y. Qu, X. Cao, Q. Ma, S. Shi, L. Tan, X. Li, H. Zhou, X. Zhang and J. Zhou, J. Hazard. Mater., 2012, 223–224, 31–38 CrossRef CAS PubMed.
  4. F. P. van der Zee and S. Villaverde, Water Res., 2005, 39, 1425–1440 CrossRef CAS PubMed.
  5. H. Gao, Y. Wang and L. Zheng, Chem. Eng. J., 2013, 234, 372–379 CrossRef CAS.
  6. V. K. Gupta and Suhas, J. Environ. Manage., 2009, 90, 2313–2342 CrossRef CAS PubMed.
  7. E. Fosso-Kankeu, H. Mittal, S. B. Mishra and A. K. Mishra, J. Ind. Eng. Chem., 2015, 22, 171–178 CrossRef CAS.
  8. X. Liu, L. Yan, W. Yin, L. Zhou, G. Tian, J. Shi, Z. Yang, D. Xia, Z. Gu1 and Y. Zhao, J. Mater. Chem. A, 2014, 2, 12296–12303 CAS.
  9. X. Luo, Y. Zhan, Y. Huang, L. Yang, X. Tu and S. Luo, J. Hazard. Mater., 2011, 187, 274–282 CrossRef CAS PubMed.
  10. P. Madhusudan, J. Zhang, B. Cheng and G. Liu, CrystEngComm, 2013, 15, 231–240 RSC.
  11. S. S. Moghaddam, M. R. A. Moghaddam and M. Arami, J. Hazard. Mater., 2010, 175, 651–657 CrossRef PubMed.
  12. W. Chen, W. Lu, Y. Yao and M. Xu, Environ. Sci. Technol., 2007, 41, 6240–6245 CrossRef CAS PubMed.
  13. A. El Sikaily, A. Khaled, A. E. Nemr and O. Abdelwahab, Chem. Ecol., 2006, 22, 149–157 CrossRef CAS.
  14. A. M. Faouzi, B. Nasr and G. Abdellatif, Dyes Pigm., 2007, 73, 86–89 CrossRef CAS.
  15. H. Khani, M. K. Rofouei, P. Arab, V. K. Gupta and Z. Vafaei, J. Hazard. Mater., 2010, 183, 402–409 CrossRef CAS PubMed.
  16. S. Karthikeyan, V. Gupta, R. Boopathy, A. Titus and G. Sekaran, J. Mol. Liq., 2012, 173, 153–163 CrossRef CAS.
  17. J. Zhu, M. Tian, Y. Zhang, H. Zhang and J. Liu, Chem. Eng. J., 2015, 265, 184–193 CrossRef CAS.
  18. N. Ghaemi, S. S. Madaeni, P. Daraei, H. Rajabi, T. Shojaeimehr, F. Rahimpour and B. Shirvani, J. Hazard. Mater., 2015, 298, 111–121 CrossRef CAS PubMed.
  19. Z. Chen, L. Zhou, F. Zhang, C. Yu and Z. Wei, Appl. Surf. Sci., 2012, 258, 5291–5298 CrossRef CAS.
  20. E. F. Kankeu, H. Mittal, S. B. Mishra and A. K. Mishra, J. Ind. Eng. Chem., 2012, 22, 171–178 CrossRef.
  21. V. Janaki, K. Vijayaraghavan, B. T. Oh, K. J. Lee, K. Muthuchelian, A. K. Ramasamy and S. Kamala-Kannan, Carbohydr. Polym., 2012, 90, 1437–1444 CrossRef CAS PubMed.
  22. H. Kolya and T. Tripathy, Eur. Polym. J., 2013, 49, 4265–4275 CrossRef CAS.
  23. X. Liu, L. Yan, W. Yin, L. Zhou, G. Tian, J. Shi, Z. Yang, D. Xiao, Z. Gu and Y. Zhao, J. Mater. Chem. A, 2014, 2, 12296–12303 CAS.
  24. L. Gao, Y. Wang, T. Yan, L. Cui, L. Hu, L. Yan, Q. Wei and B. Du, New J. Chem., 2015, 39, 2908–2916 RSC.
  25. X. Liu and D. J. Lee, Bioresour. Technol., 2014, 160, 24–31 CrossRef CAS PubMed.
  26. Y. Jia, Q. Jin, Y. Li, Y. Sun, J. Huo and X. Zhao, Anal. Methods, 2015, 7, 1463–1470 RSC.
  27. V. Nair, A. Panigraphy and R. Vinu, Chem. Eng. J., 2014, 254, 491–502 CrossRef CAS.
  28. L. Zhou, C. Gao and W. Xu, ACS Appl. Mater. Interfaces, 2010, 2, 1483–1491 CAS.
  29. V. Gupta and A. Nayak, Chem. Eng. J., 2012, 180, 81–90 CrossRef CAS.
  30. A. Jain, V. Gupta, A. Bhatnagar and Suhas, Sep. Sci. Technol., 2003, 38, 463–481 CrossRef CAS.
  31. V. V. Panic and S. J. Velickovic, Sep. Purif. Technol., 2014, 122, 384–394 CrossRef CAS.
  32. M. N. Mahamad, M. A. A. Zaini and Z. A. Zakaria, Int. Biodeterior. Biodegrad., 2015, 102, 274–280 CrossRef CAS.
  33. M. A. M. Salleh, D. K. Mahmoud, W. A. Karim and A. Idris, Desalination, 2011, 280, 1–13 CrossRef CAS.
  34. K. Zhou, Q. Zhang, B. Wang, J. Liu, P. Wen, Z. Gui and Y. Hu, J. Cleaner Prod., 2014, 81, 281–289 CrossRef CAS.
  35. H. R. Pant, H. J. Kim, M. K. Joshi, B. Pant, C. H. Park, J. I. Kim, K. S. Hui and C. S. Kim, J. Hazard. Mater., 2014, 264, 25–33 CrossRef CAS PubMed.
  36. F. Yu, L. Chen, J. Ma, Y. R. Sun, Q. Li, C. L. Li, M. X. Yang and J. H. Chen, RSC Adv., 2014, 4, 5518–5523 RSC.
  37. H. Gao, S. Zhao, X. Cheng, X. Wang and L. Zheng, Chem. Eng. J., 2013, 223, 84–90 CrossRef CAS.
  38. S. C. N. Tang and I. M. C. Lo, Water Res., 2013, 47, 2613–2632 CrossRef CAS PubMed.
  39. Y. R. Zhang, S. Q. Wang, S. L. Shen and B. X. Zha, Chem. Eng. J., 2013, 233, 258–264 CrossRef CAS.
  40. C. Shan, Z. Ma, M. Tong and J. Ni, Water Res., 2015, 69, 252–260 CrossRef CAS PubMed.
  41. B. Tang, L. Yuan, T. Shi, L. Yu and Y. Zhu, J. Hazard. Mater., 2009, 163, 1173–1178 CrossRef CAS PubMed.
  42. N. Zohreh, S. H. Hosseini, A. Pourjavadi and C. Bennett, RSC Adv., 2014, 4, 50047–50055 RSC.
  43. Y. Tan, M. Chen and Y. Hao, Chem. Eng. J., 2012, 191, 104–111 CrossRef CAS.
  44. G. Z. Kyzas and N. K. Lazaridis, J. Colloid Interface Sci., 2009, 331, 32–39 CrossRef CAS PubMed.
  45. M. Kousha, E. Daneshvar, M. S. Sohrabi, M. Jokar and A. Bhatnagar, Chem. Eng. J., 2012, 192, 67–76 CrossRef CAS.
  46. G. Annadurai, L. Y. Ling and J. F. Lee, J. Hazard. Mater., 2008, 152, 337–346 CrossRef CAS PubMed.
  47. R. Ahmad and R. Kumar, Appl. Surf. Sci., 2010, 257, 1628–1633 CrossRef CAS.
  48. S. Lagergren, K. Sven. Vetenskapsakad. Handl., 1898, 24, 1–39 Search PubMed.
  49. Y. S. Ho and G. McKay, Process Saf. Environ. Prot., 1998, 4, 332–340 CrossRef.
  50. J. B. Zhou, C. Tang, B. Cheng, J. G. Yu and M. Jaroniec, ACS Appl. Mater. Interfaces, 2012, 4, 2174–2179 CAS.
  51. I. Langmuir, J. Am. Chem. Soc., 1916, 38, 2221–2295 CrossRef CAS.
  52. J. Wang, G. Zhao, Y. Li, H. Zhu, X. Peng and X. Gao, Dalton Trans., 2014, 43, 11637–11645 RSC.
  53. M. F. Attallah, I. M. Ahmed and M. M. Hamed, Environ. Sci. Pollut. Res., 2013, 20, 1106–1116 CrossRef CAS PubMed.
  54. W. Dai, H. Yu, N. Ma and X. Yan, Korean J. Chem. Eng., 2015, 32, 335–341 CrossRef CAS.
  55. E. Bezak-Mazur and D. Adamczyk, Rocznik Ochrona Środowiska, 2013, 15, 966–969 Search PubMed.
  56. Z. Feng, N. Zheming, X. Shengjie, L. Xiaoming and W. Qiaoqiao, Chin. J. Chem., 2009, 27, 1767–1772 CrossRef.
  57. Y. Zhao, E. Abdullayev and Y. Lvov, IOP Conf. Ser.: Mater. Sci. Eng., 2014, 64, 012043 CrossRef.

Footnote

Electronic supplementary information (ESI) available. See DOI: 10.1039/c5ra20151a

This journal is © The Royal Society of Chemistry 2016
Click here to see how this site uses Cookies. View our privacy policy here.