
Photoluminescence of Cr3+ in nanostructured Al2O3 synthesized by evaporation using a continuous wave CO2 laser
Anton Kostyukov*a,
Mark Baronskiya,
Alexander Rastorgueva,
Valeriy Snytnikovab,
Vladimir Snytnikova,
Aleksey Zhuzhgova and
Arcady Ishchenkoa
aBoreskov Institute of Catalysis, pr. Lavrentieva 5, Novosibirsk 630090, Russia. E-mail: ant.kostyukov@mail.ru; snyt@catalysis.ru
bNovosibirsk State University, 2 Pirogova Str., Novosibirsk 630090, Russia
First published on 22nd December 2015
Abstract
Laser evaporation of an Al2O3 target by a continuous wave CO2 laser was used to obtain nanostructured Al2O3 condensates with a mean crystallite size of 6 nm, one nominally pure and another doped with chromium at a concentration of 0.2 wt%. Photoluminescence of Cr3+ was observed in all the samples of the Al2O3 condensate. In all the Al2O3 condensates the α-Al2O3 phase, undetectable by XRD and HRTEM, was revealed by Cr3+ probing. Photoluminescence studies with the use of Cr3+ as a probe also revealed the θ- and (γ + δ)-crystal phases of Al2O3; this finding was supported by XRD and HRTEM data.
Introduction
Alumina, being one of the most important materials, is widely used in various fields of science and technology.1 Many studies prove that interest in it has grown after nanostructured Al2O3 was synthesized and its' new properties emerged, increasing the role of the surface. The synthesis of nanostructured Al2O3 has stimulated interest in this material due to the appearance of new properties related to the increasing role of the surface, which has been shown in many studies. Some research demonstrated that the developed surface area of individual nanocrystallites affects the bulk structure, thus changing their properties.2–7Nanostructured Al2O3 can be synthesized by different methods, for example.8–10 In recent years, laser methods have been intensely developing,11–18 especially the ones that use continuous wave CO2 laser.14,15 The application of this type of laser for evaporation has some advantages: monodispersity of the resulting powders and possibility to control the size of nanocrystallites from a few to a few tens of nanometers.14,15
The local structure of materials can be investigated, in particular, by photoluminescence (PL) spectroscopy using structurally sensitive probe ions, for example 3d elements.19–24 This probe can be represented by Cr3+ ion, whose incorporation in the Al2O3 matrix via isomorphic and isovalent substitution for Al3+ ion gives the luminescence typical of the local surroundings. However, strong confinement makes the efficiency of application of Cr3+ ions as probes to reveal the local structure doubtful in the case of the nanostructured systems with the crystallite size smaller than 10 nm.
The aim of the work was to study the nanostructured Al2O3 material obtained by laser evaporation of Al2O3 target using a continuous wave CO2 laser and to examine the photoluminescence of Cr3+ at its natural and impure concentrations in the synthesized material.
Experimental
Preparation of targets for evaporation
The targets were prepared with alumina corresponding to the single-phase γ-Al2O3 that was synthesized by calcination of pseudoboehmite at 550 °C for 4 h. The starting γ-Al2O3 powder was plasticized by incipient wetness impregnation with an aqueous solution of nitric acid to provide a stronger binding of the particles. In our case, the acid modulus was 0.05 = nHNO3/nα-Al2O3. After the impregnation γ-Al2O3 was loaded in a die and formed into pellets at a pressure of 200 kg cm−2. Then the pellets in a crucible were calcined at 1250 °C for 4 h to obtain α-Al2O3. The pellets were 2 cm in diameter and 1 cm in height. To increase chromium concentration in the target, the starting γ-Al2O3 powder was modified with chromium in concentration of 0.5 wt% by incipient wetness impregnation of the γ-Al2O3 with an aqueous solution of nitrate salts Cr(NO3)3 × 9H2O.The single-phase η-Al2O3 synthesized by calcination of bayerite at 550 °C for 4 h was used to analyze XRD data of Al2O3 condensates.
Synthesis of nanostructured Al2O3
Samples of nanostructured Al2O3 were obtained by condensation of alumina vapor in flowing helium in the evaporation-condensation chamber. A gas-dust flow with Al2O3 particles was then filtered where the settled nanoparticles were collected and, after opening the chamber, analyzed by physicochemical methods. During the synthesis, helium pressure in the evaporation chamber was 0.1 atm. Al2O3 vapor was generated over the boiling zone with the diameter less than 0.5 mm during evaporation of α-Al2O3 targets by a continuous wave CO2 laser. The Al2O3 melting zone was less than 2 mm in diameter. According to pyrometric measurements, the temperature on the target surface in the boiling zone reached 3350 °C, while the Al2O3 temperature in the melting zone was in a range of 2300–2500 °C. At a distance of several millimeters from the target and 30 mm from the quartz wall of the chamber, the average gas temperature in the flow was 180–240 °C. A laser input power was 95 W. The power density at the target surface was 5.6 × 10⁴ W cm−2. A speed of the target surface with respect to the beam was adjusted in a range of 0.1–10 cm s−1. Details of the method and a comprehensive description of the experimental unit for the synthesis of nanomaterials can be found in ref. 14.Methods of research
Elemental chemical analysis was performed by the X-ray fluorescence method on an ARL – Advant'x analyzer with a Rh anode of the X-ray tube. The detection limit of the instrument was 0.01 wt%.X-ray diffraction analysis (XRD) was carried out on a Bruker D8 diffractometer with CuKα radiation and a reflected beam graphite monochromator. Diffraction patterns of the samples were obtained by scanning over the 2θ angular range of 10–75° with a step of 0.05° and accumulation time of 3 s.
The morphology was characterized using high resolution transmission electron microscopy (HRTEM) on a JEM-2010 electron microscope at accelerating voltage 200 kV and resolution 1.4 Å. The samples were deposited on a copper grid by dispersing the solid phase suspension in alcohol with an ultrasonic disperser.
Comprehensive thermogravimetric analysis (TGA) was carried out on a NETZSCH (Germany) derivatograph in a temperature range of 20 to 1000 °C at a heating rate of 10 °C min−1 using the 30 mg samples.
Photoluminescence (PL) spectra and photoluminescence excitation (PLE) spectra of Al2O3 samples were measured on a FLSP920 (Edinburgh Instruments) fluorimeter using a continuous wave Xe lamp and Cary Eclipse (Varian) spectrofluorimeter equipped with Xe flash lamp. The measurement range was 600–900 nm for PL spectra and 350–675 nm for PLE spectra. To measure PL spectra at a higher resolution, an instrument with an MDR-23 monochromator and FEU-100 photomultiplier was employed.25 A continuous wave semiconductor laser with the 532 nm wavelength and 60 mW output power served as the excitation source. The samples were placed in a quartz cell and exposed to frontal irradiation. All the PL and PLE spectra were recorded in the signal accumulation mode. PL spectra were corrected for the spectral distribution of photomultiplier sensitivity, and PLE spectra – for the wavelength distribution of lamp intensity. All the measurements were made at room temperature. For all the cells, PL and PLE spectra were recorded with due regard for their possible contribution to the spectra of the test samples.
Results
XRD data of starting pseudoboehmite compounds and γ-Al2O3 are presented and analyzed in ref. 8. According to XRD data, the target is represented by single α-Al2O3 and has a distinct crystal structure with the rhombic lattice [ICDS Collection Code 73724]. The α-Al2O3 target consists of bulk microcrystals with the size from 500 nm to a few micrometers.The XRD study of the alumina condensate samples (Fig. 1) demonstrates the hkl index reflexes common for the low-temperature γ- and η-Al2O3 modifications of boehmite, pseudoboehmite or bayerite origin respectively.26–28
 | ||
| Fig. 1 Diffraction patterns of the Al2O3 condensate samples nominally pure and doped with 0.2 wt% chromium, γ-Al2O3 (starting powder), η-Al2O3 and α-Al2O3. | ||
It should be noted that the Al2O3 condensates contain an X-ray amorphous phase that shows up as a broad diffuse halo in the area of angles 2θ = 25–40°. This halo is not observed in the low-temperature γ-, η-phases and high-temperature θ-, δ-, κ-Al2O3 phases, obtained by boehmite, pseudoboehmite and bayerite ignition.26–28 The coherent scattering region is measured 40 Å according to the peak of 440 for the synthesized Al2O3 samples.
As shown by the elemental analysis, the resulting condensate of Al2O3 vapor was nominally pure at the detection limit of the X-ray fluorescence method. In the Al2O3 condensate doped with chromium, the chromium concentration was 0.2 wt%.
According to HRTEM data, electron microscopy images of the Al2O3 condensate show mostly the spherically symmetric 3D nanocrystals with the size of 3 to 10 nm (Fig. 2), the 6 nm particles being most abundant. Interplanar spacings in the high resolution images indicate the presence of both the θ-, δ-, κ-Al2O3 phases and the amorphous alumina phase. Those phases were identified according to the #PDF47-1771 (θ-Al2O3), #PDF46-1131 (δ-Al2O3) and #PDF52-0803 (κ-Al2O3) databases.
 | ||
| Fig. 2 The morphology (a and b) and microstructure (c) of the nominally pure Al2O3 condensate. | ||
In a temperature range of 67–200 °C, a thermogram of the Al2O3 condensate (Fig. 3) shows a broad endothermic effect caused most likely by dehydration in the amorphous component. The indicated endo effect is accompanied by a 13.55 wt% weight loss. Along with this, the heating curve demonstrates a broad diffuse exothermic effect with a maximum at 282 °C, which is related to crystallization of the amorphous phase. As seen from the thermogram (Fig. 3), the total weight loss for the studied sample is 18.26 wt%, 13.55 wt% of which corresponds to the content of the amorphous component.
 | ||
| Fig. 3 Comprehensive thermal analysis of the Al2O3 condensate (a weight loss, wt%). | ||
Results of luminescence studies
Fig. 4 displays PL spectra of the starting γ-Al2O3 sample and α-Al2O3 target, which were obtained upon excitation at λex = 532 nm.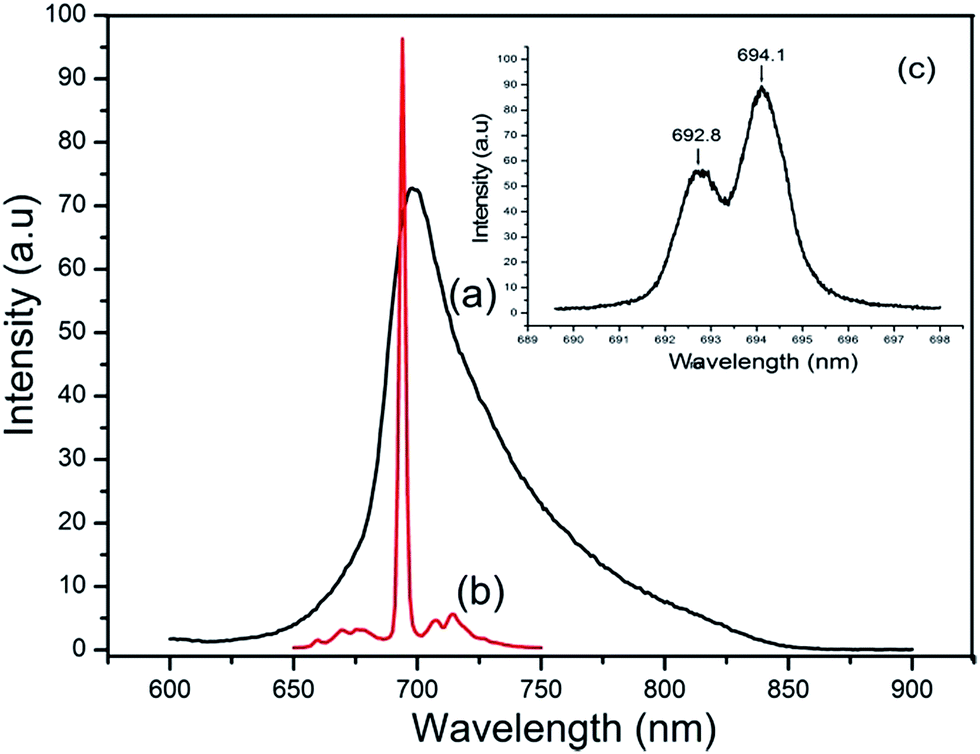 | ||
| Fig. 4 PL spectrum of Cr3+ in the starting γ-Al2O3 powder (a) and α-Al2O3 target (b) at λex = 532 nm. A spectral slit of 5 nm; Cary Eclipse. The insert shows PL of α-Al2O3 target (c) upon laser excitation at λex = 532 nm. A spectral slit of 0.2 nm. | ||
As seen from Fig. 4, the PL spectrum of γ-Al2O3 is represented by a compound asymmetric curve with a pronounced maximum at λmax = 698 nm and a monotonically decreasing shoulder in the region of 700–850 nm. The PL spectrum of α-Al2O3 shows a well recognizable photoluminescence with a maximum at 694 nm (Fig. 4), which can safely be assigned to the known resonance transition 2E → 4A2 in Cr3+ ions of the α-Al2O3 matrix (the R1 (694.1 nm) and R2 (692.8 nm) lines in the insert, Fig. 4c).17,19–24
PLE spectra were recorded for γ-Al2O3 (λmax = 698 nm) and α-Al2O3 (λmax = 694 nm) (Fig. 5).
 | ||
| Fig. 5 PLE spectra of Cr3+ in the starting γ-Al2O3 (a) at λmax = 698 nm and α-Al2O3 target (b) at λmax = 694 nm. A spectral slit of 5 nm; Cary Eclipse. | ||
PLE spectrum of γ-Al2O3 shows the pronounced broad bands in two regions, “blue” (350–475 nm) and “green” (500–625 nm), respectively, with the maxima at 432 and 566 nm (Fig. 5, curve a). PLE spectrum of α-Al2O3 shows the bands known for Cr3+:Al2O3 with the maxima at 405 and 562 nm (Fig. 5, curve b), which correspond to the 4T1 → 4A2 and 4T2 → 4A2 transitions.8,23
The nanostructured Al2O3 condensate not modified with chromium has PL in a range of 680–710 nm. Its PL intensity is much weaker as compared to that of Cr3+ in α-Al2O3 (Fig. 6). A comparison of the intensities revealed a difference by three orders of magnitude. The PL spectrum has distinct maxima at 687, 693.5 and 699.3 nm, which are well reproducible at decomposition of the initial spectrum into Gaussian components, Fig. 6.
 | ||
| Fig. 6 PL spectrum of Cr3+ in undoped Al2O3 condensate upon laser excitation at λex = 532 nm. A spectral slit of 0.33 nm. | ||
An increase in the chromium concentration of Al2O3 condensate to 0.2 wt% strongly increases the intensity of PL signal upon excitation at 560 nm, Fig. 7.
 | ||
| Fig. 7 PL spectrum of Cr3+ in Al2O3 condensate doped with 0.2 wt% chromium, λex = 560 nm. A spectral slit of 1 nm; FLSP920. | ||
Decomposition of the PL spectrum (Fig. 7) into four Gaussians gives quite a good fit between approximating and experimental curves. The corresponding maxima of the Gaussians are observed at 682, 694, 698 and 713 nm. The excitation spectrum was recorded for the PL band with a maximum at 694 nm (Fig. 8). As seen from Fig. 8, the PL excitation spectrum for this sample is represented by two broad bands with the maxima at 417 and 568 nm.
 | ||
| Fig. 8 PLE spectrum of Cr3+ in Al2O3 condensate doped with 0.2 wt% chromium for the band with λmax = 694 nm. A spectral slit of 5 nm; Cary Eclipse. | ||
Discussion
According to XRD data, substantial changes in the structure of Al2O3 condensates occur after evaporation of the target (Fig. 1). The reflections from the starting α-Al2O3 completely disappear in the diffraction pattern. There appear the diffraction peaks from the low-temperature γ- and η-Al2O3. The HRTEM data, Fig. 2, also testify to considerable changes in the morphology of the synthesized Al2O3 samples. The TGA method made it possible to estimate quantitatively the amorphous phase, which is observed on XRD and HRTEM images. The two thermal TGA effects have been examined in detail (Fig. 3): the broad endothermic effect at a temperature range of 67–200 °C and the broad exothermic effect of a maximum at 282 °C. The endothermic effect is determined by the removal of molecular water and OH groups from the amorphous phase. The exothermic effect indicates the crystallization of the amorphous phase. It would be appropriate to compare those two thermal effects in a nanostructured condensate with the TGA data obtained for Al2O3 synthesized by ‘flash’ method. As long as the ‘flash’ method involves hydroxide dehydration in nonequilibrium conditions29–31 which are also common for the laser evaporation method. Thus comparing the TGA data with the data presented in other studies29–31 allows us to distinguish the features of the amorphous phase in nanostructured Al2O3 condensates. Dehydration of the amorphous phase occurs at a more narrow temperature range (Fig. 3) and its' crystallization occurs at 282–300 °C whereas alumina products obtained by ‘flash’ methods require 500 °C more for crystallization.Our earlier studies of the starting γ-Al2O3 showed that PL with λmax = 698 nm is caused mostly by octahedrally coordinated Cr3+ ions (uncontrolled impurity) in the γ-Al2O3 matrix with the corresponding nonuniformly broadened 2E → 4A2 transition.8 The concentration of Cr3+ ions in the samples of α-Al2O3 target obtained from γ-Al2O3 was 10−4 wt%, as estimated by the PL method.8 Thus, it would be natural to expect PL of Cr3+ ions to occur in the samples of Al2O3 condensate produced by laser evaporation, even without the deliberate doping of the starting target.
In Fig. 6, PL spectra of undoped Al2O3 condensate show the bands with λmax = 687, 693.5 and 699.3 nm. The maxima of these bands agree well with the data on PL of Cr3+ ions in nanostructured Al2O3 samples (the size of nanocrystallites strongly exceeding 10 nm) that were synthesized by different methods and had different phase composition.8,19–22,32,33 These studies demonstrated that PL maxima of Cr3+ are observed at 682 and 686 nm for θ-Al2O3 (the R1θ,2θ lines), 692 and 694 nm for α-Al2O3 (the R1α,2α lines), and 698 and 710 nm for (γ + δ)-Al2O3. Thus, PL at 687 and 699.3 nm (Fig. 6) can be attributed to the 2E → 4A2 transition in Cr3+ ions in the θ- and (γ + δ)-Al2O3 phases, respectively. The manifestation of all these phases completely agrees with the XRD and HRTEM data. Naturally, PL with the maximum at λmax = 693.5 nm should be attributed to PL of Cr3+ ions in the α-Al2O3 matrix. However, the α-Al2O3 phase was not revealed by XRD and HRTEM studies. A possible reason is that the size of α-Al2O3 crystallites cannot be detected by X-ray diffraction analysis. According to the known published data, the detection of α-Al2O3 with the nanocrystallite size below 10 nm is a nontrivial fact.9,34 So, to validate the assignment of the band with λmax = 693.5 nm to the luminescence of Cr3+ exactly in α-Al2O3, Fig. 9 displays the PL spectrum in the region of supposed characteristic R lines. The spectrum was obtained in the signal accumulation mode. Scanning was made with a step Δλ = 0.01 nm and accumulation time for each point equal to 10 s.
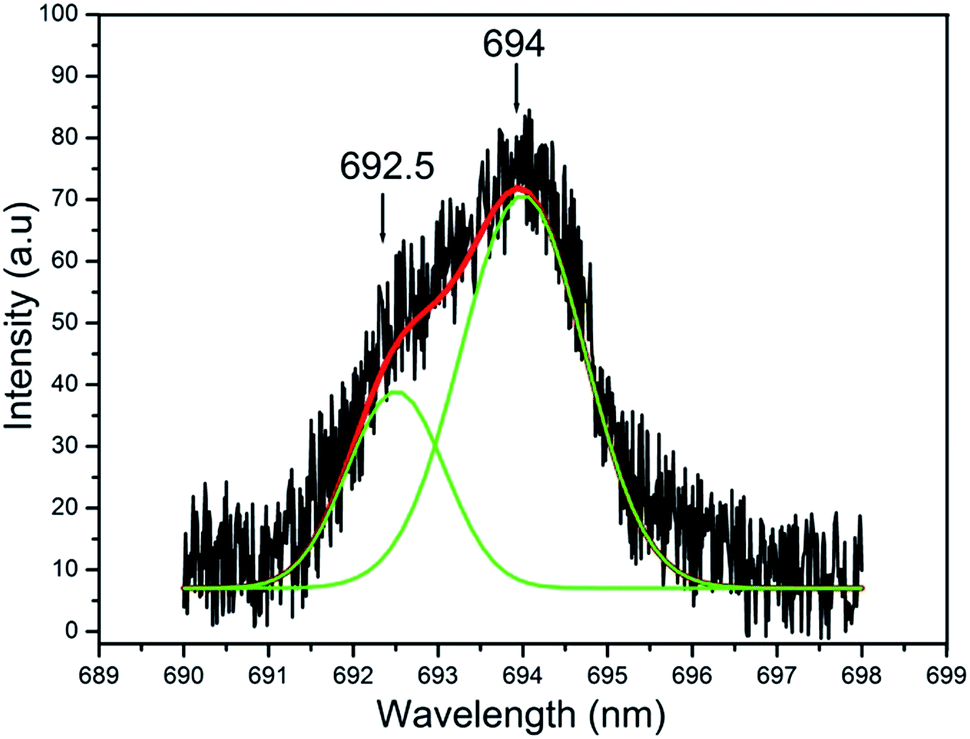 | ||
| Fig. 9 PL spectrum of Cr3+ in undoped Al2O3 condensate upon laser excitation at λex = 532 nm. A laser power at the sample location is 60 mW. A spectral slit of 0.2 nm. | ||
As shown in Fig. 9, decomposition of the PL spectrum into two Gaussian components gives a good fit between experimental and approximating curves. The wavelengths corresponding to the components' maxima are 692.5 and 694 nm.
The difference between maxima of the Gaussians is 1.5 nm (31 cm−1). This value is close to 29 cm−1 (Fig. 4c) that corresponds to splitting of the excited 2E level in Cr3+:α-Al2O3 (the R1,2 lines), which is typical of the bulk material.22,35,36 Formally, a comparison of positions of the R1,2 lines in Fig. 9, their intensity ratios and close semiwidths for the bulk samples35,36 and those tested in our work suggests that exactly the α-Al2O3 phase is observed in the nanostructured sample. At the same time, noteworthy is an increased ΔR1,2 interval and a minor short-wavelength shift of each component of the lines in comparison with macrocrystalline α-Al2O3 (Fig. 4). The shifts are equal to 0.3 nm (6.2 cm−1) and 0.1 nm (2 cm−1) for R1 and R2, respectively. The excitation spectrum of undoped sample was not obtained due to weak emission of Cr3+; such spectrum could be an additional argument for attribution of the PL band at 693.5 nm (Fig. 6) to the luminescence of Cr3+:α-Al2O3.
According to the elemental analysis, an increase in the chromium concentration of the target to 0.5 wt% raises its concentration in the condensate to 0.2 wt%. This is accompanied by a growth in PL intensity of Cr3+ in the condensate as compared to PL intensity of Cr3+ in the undoped sample. It should be noted that the increasing concentration of almost 103 times does not lead to a proportional increase in the PL intensity. The efficiency of Cr3+ PL happened to be much lower than that in the target with completely crystallized α-Al2O3 phase. As shown by a comparison of PL intensity of Cr3+ in undoped target (the Cr3+ concentration of 10−4 wt%) with that in the condensate obtained from this target, the difference in the concentrations is three orders of magnitude. Evidently, this indicates that a major part of chromium resides in the X-ray amorphous phase and does not luminesce. It cannot be ruled out also that a part of chromium has the charge state different from 3+ and does not manifest itself in the spectral region under consideration. In the PL spectrum (Fig. 7), a broad band with the maximum at 713 nm can be attributed to the allowed 4T2 → 4A2 transition in Cr3+ ions.8
The PL excitation spectrum, Fig. 8, for Al2O3 condensate with 0.2 wt% chromium was recorded for the band with λmax = 694 nm (the R1,2 lines) of Cr3+ in α-Al2O3. The corresponding bands in the “blue” (350–475 nm) and “green” (500–600 nm) regions can be assigned to the 4T1 → 4A2 and 4T2 → 4A2 transitions, respectively. One can see that the excitation PL spectrum in Fig. 8 differs from the excitation PL spectra of Cr3+ in α-Al2O3 and γ-Al2O3 that are displayed in Fig. 5 (curves a and b). First of all, the differences are observed in positions of the maxima of the “blue” (4T1 → 4A2) and “green” (4T2 → 4A2) lines.
On one hand, it is impossible to make a complete comparison of the excitation PL spectra of Al2O3 condensate with the PL spectra of Cr3+ reported in the literature. The difficulty is related mostly to differences in the size of Al2O3 crystallites. On the other hand, assuming the feasibility of such a comparison, positions of the maxima of the 4T1 and 4T2 bands can be used to estimate the crystal field strength of the nearest surroundings of chromium ions.8,35,36 Indeed, studies on the effect of pressure on the position of transitions in Cr3+ ions showed that the spectroscopic changes are most pronounced at the vibrational energy levels 4T1 and 4T2.37,38 In our case, the high-wavelength shift observed in PL excitation spectra indicates a weakening of the field strength. In addition, there are slight but noticeable changes in the R lines, Fig. 4c and 9. Their positions and interline distances qualitatively testify to changes in the crystal field strength.
Thus, laser evaporation of Al2O3 target by a continuous wave CO2 laser makes it possible to obtain the nanostructured α-Al2O3 phase. The formation mechanism of the condensate is likely to produce strong differences between PL excitation spectra of nanocrystalline and macrocrystalline α-Al2O3 phases. Further studies are needed to elucidate the mechanism of evaporation, condensation and unusual luminescence properties of nanostructured Al2O3.
Conclusions
Laser evaporation with a continuous wave CO2 laser was used to obtain the Al2O3 condensate with the mean crystallite size of 6 nm, both nominally pure and doped with chromium at a concentration of 0.2 wt%. The XRD and HRTEM studies revealed the θ- and (γ + δ)-Al2O3 crystal phases and the X-ray amorphous phase. Cr3+ probing confirmed the presence of these phases and detected the α-Al2O3 phase, which is undetectable by XRD and HRTEM. It was found that position of the resonance transition 2E → 4A2 (the R1,2 lines) in nanostructured α-Al2O3 phase is close to the values corresponding to macrocrystalline α-Al2O3 phase; in the excitation spectrum, the bands attributed to the 4T1 → 4A2 and 4T2 → 4A2 transitions are shifted toward lower energies.Acknowledgements
The study was supported by the Russian Foundation for Basic Research (Project no. 14-03-31704 young_a) and Basic budgetary financing. The authors wish to acknowledge Yuri P. Tsentalovich (International Tomography Center SB RAS) for the provision of a FLSP920 (Edinburgh Instruments) fluorimeter, I. Yu. Molina for carrying out X-ray diffraction analysis and G. S. Litvak for carrying out comprehensive thermogravimetric analysis.References
- L. D. Hart, Alumina Chemicals: Science and Technology Handbook, Wiley, 2006, p. 617 Search PubMed.
- A. I. Gusev, Nanomaterials, nanostructures and nanotechnologies, Fizmatlit, Moscow, 2nd edn, 2009, p. 416 Search PubMed.
- A. A. Rempel, Russ. Chem. Rev., 2007, 76(5), 435 CrossRef CAS.
- Y. Li and W. Shen, Chem. Soc. Rev., 2014, 43, 1543 RSC.
- Q. Zhang, E. Uchaker, S. L. Candelaria and G. Cao, Chem. Soc. Rev., 2013, 42, 3127 RSC.
- P. Serp and K. Philippot, Nanomaterials in Catalysis, Wiley, 2013, p. 516 Search PubMed.
- N. Uvarov and V. Boldyrev, Russ. Chem. Rev., 2001, 70, 265 CrossRef CAS.
- A. Rastorguev, M. Baronskiy, A. Zhuzhgov, A. Kostyukov, O. Krivoruchko and V. Snytnikov, RSC Adv., 2015, 5, 5686 RSC.
- R. M. Laine, J. C. Marchal, H. P. Sun and X. Q. Pan, Nat. Mater., 2006, 5, 710 CrossRef CAS PubMed.
- T. E. Bell, J. M. Gonzalez-Carballo, R. P. Tooze and L. Torrente-Murciano, J. Mater. Chem. A, 2015, 3, 6196 CAS.
- Y. A. Kotov, V. V. Osipov, M. G. Ivanov, O. M. Samatov, V. V. Platonov, E. I. Azarkevich, A. M. Murzakaev and A. I. Medvedev, Tech. Phys., 2002, 72(11), 76 Search PubMed.
- H.-D. Kurland, J. Grabow and F. A. Muller, J. Eur. Ceram. Soc., 2011, 31, 2559 CrossRef CAS.
- J. Lam, D. Amans, F. Chaput, M. Diouf, G. Ledoux, N. Mary, K. Masenelli-Varlot, V. Motto-Ros and C. Dujardina, Phys. Chem. Chem. Phys., 2014, 16, 963 RSC.
- V. N. Snytnikov, V. N. Snytnikov, D. A. Dubov, V. I. Zaikovskii, A. S. Ivanova, V. O. Stoyanovsky and V. N. Parmon, J. Appl. Mech. Tech. Phys., 2007, 48(2), 172 CrossRef.
- E. Muller, C. Oestreich, U. Popp, G. Michel, G. Staupendahl and K.-H. Henneberg, KONA, 1995, 13, 79 CrossRef.
- G. Williams and G. Coles, J. Mater. Chem., 1998, 8(7), 1657 RSC.
- C. Pan, S.-Y. Chen and P. Shen, J. Cryst. Growth, 2008, 310, 699 CrossRef CAS.
- H.-D. Kurland, J. Grabow and F. A. Muller, J. Eur. Ceram. Soc., 2011, 31, 2559 CrossRef CAS.
- D. M. Lipkin, H. Schaffer, F. Adar and D. R. Clarke, Appl. Phys. Lett., 1997, 70, 2550 CrossRef CAS.
- G. T. Pott and W. H. J. Stork, Catal. Rev.: Sci. Eng., 1975, 163 CAS.
- A. B. Kulinkin, S. P. Feofilov and R. I. Zakharchenya, Phys. Solid State, 2000, 42(5), 857 CrossRef CAS . Translated from Fizika Tverdogo Tela, 2000, 42(5), 835.
- V. N. Snytnikov, V. O. Stoyanovskii, T. V. Larina, O. P. Krivoruchko, V. A. Ushakov and V. N. Parmon, Kinet. Catal., 2008, 49(2), 291 CrossRef CAS.
- G. Rani and P. D. Sahare, Adv. Powder Technol., 2014, 25, 767 CrossRef CAS.
- A. Patra, R. E. Tallman and B. A. Weinstein, Opt. Mater., 2005, 27, 1396 CrossRef CAS.
- M. Sorokin, V. V. Kaichev and A. L. Timoschin, et al., Instrum. Exp. Tech., 2001, 22(3), 375 CrossRef.
- J. Gangwar, B. Kumar Gupta, S. K. Tripathi and A. K. Srivastava, Nanoscale, 2015, 7, 13313 RSC.
- S. V. Tsybulya and G. N. Kryukova, Phys. Rev. B: Condens. Matter Mater. Phys, 2008, 77, 024112 CrossRef.
- B. C. Lippens and J. J. Steggerda, Physical and Chemical Aspects of adsorbents and catalysts, ed. B. G. Linsen, Acad press, London, 1970, vol. 4, p. 232 Search PubMed.
- V. J. Ingram-Jones, R. C. T. Davies, J. C. Southern and S. Salvador, J. Mater. Chem., 1996, 6, 73 RSC.
- Y. Y. Tanashev, E. M. Moroz, L. A. Isupova, A. S. Ivanova, G. S. Litvak, Y. I. Amosov, N. A. Rudina, A. N. Shmakov, A. G. Stepanov, I. V. Kharina, E. V. Kul'ko, V. V. Danilevich, V. A. Balashev, V. Y. Kruglyakov, I. A. Zolotarskii and V. N. Parmon, Kinet. Catal., 2007, 48(1), 153 CrossRef CAS.
- R. A. Buyanov, O. P. Krivoruchko and B. P. Zolotovskii, Izv. Sib. Otd. Akad. Nauk SSSR, Ser. Khim. Nauk, 1986, 4, 39 Search PubMed.
- W. Qingzhe, D. M. Lipkin and D. R. Clarke, J. Am. Ceram. Soc., 1998, 81(12), 3345 CrossRef.
- L. Trinkler, B. Berzina, Z. Jevsjutina, J. Grabis, I. Steins and C. J. Baily, Opt. Mater., 2012, 34, 1553 CrossRef CAS.
- J. M. McHale, A. Auroux, A. J. Perrotta and A. Navrotsky, Science, 1997, 277, 788 CrossRef CAS.
- D. T. Sviridov, R. K. Sviridova and Y. F. Smirnov, Optical Spectra of Transition Metal Ions in Crystals, Nauka, Moscow, 1976, p. 266 Search PubMed.
- I. B. Bersuker, Electronic Structure and Properties of Transition Metal Compounds: Introduction to the Theory, Wiley, 2nd edn, 2010, p. 759 Search PubMed.
- N. H. Chen and I. F. Silvera, Rev. Sci. Instrum., 1996, 67(12), 4275 CrossRef CAS.
- W. Duan, G. Paiva, R. M. Wentzcovitch and A. Fazzio, Phys. Rev. Lett., 1998, 81(15), 3267 CrossRef CAS.
| This journal is © The Royal Society of Chemistry 2016 |