Zirconium-promoted hydrothermal synthesis of hierarchical porous carbons with ordered cubic mesostructures under acidic aqueous conditions

Anfeng Zhanga, Keke Houb, Haiyang Duana, Wei Tanb, Chunshan Song*ac and Xinwen Guo*a
aState Key Lab of Fine Chemicals, PSU-DUT Joint Center for Energy Research, School of Chemical Engineering, Dalian University of Technology, Dalian 116024, P. R. China. E-mail: Guoxw@dlut.edu.cn; Fax: +86-0411-86986134; Tel: +86-0411-86986133
bChambroad Chemical Industry Research Institute Co., LTD, Binzhou, Shandong, P. R. China
cEMS Energy Institute, PSU-DUT Joint Center for Energy Research, Department of Energy & Mineral Engineering, Department of Chemical Engineering Pennsylvania State University, University Park, Pennsylvania 16802, USA. E-mail: csong@psu.edu; Fax: +1-814-865-3573; Tel: +1-814-863-4466

Received 21st September 2015 , Accepted 17th December 2015

First published on 22nd December 2015


Abstract

The zirconium-promoted hydrothermal synthesis of hierarchical porous carbons with ordered cubic mesostructures (Im3m) under acidic aqueous conditions was first presented using F127 as a template, pre-synthesized resol as carbon precursor, hydrochloric acid as catalyst and zirconium oxychloride as an assistant agent. The effects of the zirconium oxychloride assistant, acid concentration, hydrothermal treatment time and treatment conditions on the structural properties of the hierarchical porous carbons were investigated. The results indicate that the zirconium polyoxo oligomers in the acid synthesis solution can suppress the condensation of the resols at a moderate rate around the micelles of F127 to form mesosporous carbon. Under hydrothermal conditions, zirconium polyoxo oligomers could interact with the polyethylene (PEO) chains of F127 through hydrogen bonding, increasing the hydrophilic/hydrophobic volume ratio and the interfacial curvature to promote the phase transformation of the mesostructure from 2-D hexagonal to 3-D body-centered cubic. With suitable acid concentration (1.0–3.0 M), hierarchical porous carbons with ordered cubic mesostructures can be synthesized in 8 h on a large scale. After activation with KOH, the equilibrium CO2 adsorption capacities of the resulting materials at 1 atm were in the range of 3.3–4.1 mmol g−1 at 25 °C and 4.8–6.6 mmol g−1 at 0 °C.

Introduction

Ordered mesoporous carbons (OMCs) have attracted much attention because of their specific structural features and chemical stability under non-oxidizing conditions along with their possible application in electrochemical double-layer capacitors (EDLCs), semiconductors, separation, adsorption, gas storage and catalyst supports.1–4 Since the first report in 1999,5 efforts have been made to develop efficient routes for the large-scale synthesis of OMCs. Although nanocasting is a powerful method to prepare OMCs,3,6,7 it is fussy, time-consuming and costly, mainly due to the complicated and tedious synthesis procedures involving the pre-synthesis of hard templates followed by the impregnation with carbon precursors, carbonization, and template removal.

Recently, the soft-template procedure, which directly uses amphiphilic surfactants (e.g., Pluronic F127 and P123) as templates and oligomers of phenols (e.g., phenol, resorcinol, and phloroglucinol) and formaldehyde as the carbon precursors, has become a more popular, attractive and efficient method. The oligomer prepared by the reaction of phenols with formaldehyde has a high density of hydroxyl groups, which can provide the driving force for self-assembly with the PEO blocks of the template.8–11 The strong interaction between the template and the phenolic oligomers is the key factor in the successful synthesis of OMCs. According to this strategy, Zhao's group developed a powerful step-by-step EISA process to synthesize OMCs with various symmetries via the self-assembly of tri-block block copolymers (e.g. Pluronic F127, P123 and F108) and the base-catalyzed phenol/formaldehyde resol.12,13 Dai et al.,14,15 Zhang et al.,16–18 and Yuan et al.19,20 also reported a highly reproducible approach for the synthesis of OMCs by the self-assembly of resorcinol-formaldehyde and block copolymers (e.g., F127) under highly acidic conditions in water/ethanol systems; this synthesis is probably driven by the I+XS+ mechanism and hydrogen bonding. Hao et al. synthesized a serious of ordered hierarchical porous carbon monoliths by combining the chemistry of benzoxazine and the organic–organic self-assembly approach.21,22 However, these methods always involve large amounts of organic solvent, making them industrially unfeasible.

Induced self-assembly in aqueous conditions is an attractive and promising strategy that has been widely used to synthesize ordered mesoporous silicates using water as the solvent. However, only a few reports have referred to the aqueous synthesis of OMCs,23–27 mainly because of the difficulty in controlling the polymerization rate of the phenolic oligomers around the surfactant micelles under aqueous conditions. As a successful example, under basic aqueous conditions (pH = 8–9), in which resols have a relatively low reactivity, Zhao's group first fabricated a range of OMCs through the cooperative self-assembly of pre-synthesized phenol/formaldehyde resols and triblock copolymer.23,24 By finely adjusting the synthetic conditions, OMCs with a variety of mesostructures (P6mm, Im3m and Fm3m) and even single crystals could be prepared.25 For resorcinol or phloroglucinol, for which the polymerization rate with formaldehyde under aqueous conditions was very difficult to control, the only successful synthesis of OMCs using resorcinol-formaldehyde resin was reported by Lu et al. in the presence of glutamic acid as catalyst.26 However, these aqueous synthetic methods are time-consuming due to the low polymerization rate of the phenol or resorcinol-based resin under the synthetic conditions.

Recently, Lei et al. developed a simple method to synthesize highly ordered cubic Im3m and hexagonal p6mm mesoporous carbons using hexamethylenetetramine (HMT) instead of formaldehyde to react with resorcinol under weakly basic conditions within one day.27 HMT can be hydrolyzed into ammonia and formaldehyde at the suitable temperature or pH value. Thereby, the polymerization rate of resorcinol with formaldehyde can be controlled to match the self-assembly of the surfactant and carbon precursor by exactly controlling the temperature or pH of the synthetic system. Several groups also presented the hydrothermal synthesis of OMCs under weakly basic conditions,28–31 which is also faster and more energy efficient. However, under weakly basic conditions, the pH range of the synthetic solution is very narrow. The synthesis11 of OMCs under highly acidic conditions is still a challenge.

Recently, we have presented an efficient synthesis of OMCs by the cooperative self-assembly of phenol/formaldehyde resol and surfactant F127 under acidic aqueous conditions.32,33 The pre-synthesized phenol/formaldehyde resols have a higher reactivity under acidic conditions and can be rapidly polymerized around the micelles of the template to form highly ordered mesostructures through macrophase separation at 40 °C. Lei et al. reported a strongly acidic aqueous cooperative assembly route to synthesize OMCs using R/HMT as a precursor and P123 as a template.34 However, only OMCs with 2-D hexagonal mesostructures were synthesized by these approaches. The synthesis of OMCs with 3-D cubic mesostructures under acidic aqueous conditions has not been reported.

In this paper, we report a zirconium-promoted hydrothermal synthesis of hierarchical carbons with highly ordered cubic mesostructure under acidic conditions using F127 as a template, pre-synthesized resol as carbon precursor and zirconium oxychloride as an assistant agent. The effects of the zirconium oxychloride assistant, acid concentration, hydrothermal treatment time and treatment conditions on the structural properties of the hierarchical porous carbons and the CO2 adsorption capacities of the resulting materials were investigated.

Experimental

Materials

All materials were of analytical grade and were used as received without any further purification. The poly(propylene oxide)–poly(ethylene oxide)–poly(propylene oxide) triblock copolymer Pluronic F127 (Mw = 12[thin space (1/6-em)]600, EO106PO70EO106) was purchased from Sigma-Aldrich. Other chemicals were purchased from Tianjin Ker-mel Chemical Reagents Development Centre.

Synthesis of OMCs

The phenol/formaldehyde resol was synthesized according to the previous procedure.32 For a typical synthesis, 2 g of F127 was first dissolved in 30 ml of deionized water at 40 °C. Then, 5 g of the synthesized resol solution, 0.2 g of ZrOCl2·8H2O and 5 ml of 2 M acid solution were added. After stirring for 6 h, the clear solution turned into a white homogeneous emulsion. After that, the solution was poured into an autoclave and transferred into an oven at 100 °C for 8 h. The polymeric product was collected by filtration, washed with water and dried at 100 °C. The as-made composite was pyrolyzed under a nitrogen atmosphere at a certain temperature to obtain carbon materials of body-centered cubic symmetry, denoted as OMC1-x-y-z, where x represents the mass ratio of ZrOCl2·8H2O to resol, y represents the acid concentration and z represents the pyrolysis temperature. When the synthetic solution was treated under ambient pressure, a sample with hexagonal mesostructure was obtained, denoted as OMC2-x-y, where x and y mean the same as above. By varying the synthetic conditions, a series of materials could be obtained (seen in Table 1). In all synthesis, the pyrolysis temperature was fixed at 600 °C unless otherwise specified.
Table 1 Synthesis conditions and textural properties of the OMCs
Samplea a0b (nm) SBET (m2 g−1) Vtc (cm3 g−1) Vmd (cm3 g−1) De (nm) Microporous fraction (%)
a Samples pyrolyzed at 600 °C except OMC1-0.04-2-800; OMC1-0.04-2(4), (16), and (24) indicate hydrothermal times of 4, 16, and 24 h, respectively.b The cell parameter a0 = √2d110.c Total pore volume.d Micropore volume.e The mesopore size at the maximum of the pore size distribution curves, as evaluated by QSDFT methods.
OMC1-0.04-2-800 11.2 1033 0.57 0.23 5.9 42
OMC1-0.04-2 11.7 871 0.49 0.11 6.2 22
OMC1-0.02-2 11.7 832 0.47 0.10 6.2 21
OMC1-0.06-2 11.7 830 0.46 0.13 6.2 28
OMC1-0.1-2 11.7 796 0.44 0.14 6.2 32
OMC1-0.04-0.5 11.3 653 0.31 0.21 5.2–7.3 68
OMC1-0.04-1 11.4 731 0.39 0.17 5.2–6.2 44
OMC1-0.04-3 11.7 850 0.47 0.14 6.2 30
OMC1-0.04-2(4) 11.9 777 0.40 0.22 5.2, 6.2 55
OMC1-0.04-2(16) 11.8 779 0.39 0.15 5.4 38
OMC1-0.04-2(24) 11.6 732 0.32 0.28 5.2 88


Activation of the OMCs and adsorption of CO2

Typically, the OMCs were activated as follows: First, the OMCs were impregnated in KOH ethanol solutions (the mass ratio of KOH/carbon was 2[thin space (1/6-em)]:[thin space (1/6-em)]4) and then dried at 60 °C under stirring. The mixture was heated to 700 °C at a ramping rate of 5 °C min−1 under a nitrogen flow, and this temperature was held for 60 min. After cooling to room temperature, the resultant mixture was washed successively with 2 M HCl solution and deionized water. The samples were then dried at 100 °C.

The CO2 adsorption isotherms of the activated OMCs were measured using a Quantachrome Autosorb SI equipment at 0 °C and 25 °C. Prior to each adsorption experiment, the sample was degassed for 8 h at 250 °C to remove the guest molecules from the pores.

Characterization

Powder X-ray diffraction (XRD) patterns were recorded on a Rigaku Smart Lab 9 diffractometer using nickel-filtered CuKα X-rays at a scanning rate of 1° min−1 (45 mV, 200 mA). The d-spacing values were calculated as d = λ/2[thin space (1/6-em)]sin[thin space (1/6-em)]θ. The unit cell parameters were calculated by a0 = 2d100/√3 for the materials with hexagonal mesostructures (p6mm) and a0 = √2d110 for the materials with body-centered cubic mesostructures (Im3m). Transmission electron microscopy (TEM) images were collected on a Tecnai G2 20 S-twin instrument (FEI Company) with an acceleration voltage of 200 kV. The samples for TEM analysis were prepared by dipping carbon-coated copper grids into ethanol solutions of carbon and drying under ambient conditions. Scanning electron microscopy (SEM) investigations were carried out with a HitachiS-4800 instrument. Nitrogen adsorption-desorption data were measured with a Quantachrome autosorb iQ analyzer at 77 K. Prior to the measurements, the samples were degassed at 250 °C for 10 h. The specific surface areas (SBET) were calculated by the Brunauer–Emmett–Teller (BET) method using adsorption data in a relative pressure range from 0.02 to 0.30. The total pore volumes (Vt) were estimated on the basis of the amount adsorbed at a relative pressure of ∼0.995. It has been demonstrated that the conventional Barrett–Joyner–Halenda (BJH) method of pore size analysis is not applicable for ordered mesoporous materials with cage-like pore structures,35 and the drawback of the standard NLDFT methods is that they do not take into account chemical and geometrical heterogeneity of the pore walls and instead assume structure-less, chemically and geometrically smooth surface model.36 Taking into account the molecular-level surface roughness of the carbon materials, the quenched solid density functional theory (QSDFT) model was recently developed and recommended to analyze the pore size distributions of OMCs with cage-like mesostructures.37 The pore size distributions were calculated from adsorption data of the isotherms using the QSDFT method with the cylindrical-spherical adsorption kernel.37 Micropore volume (Vm) and surface area were calculated using the t-plot method.

Results and discussion

Synthesis of hierarchical porous OMCs with cubic symmetry

The synthesis of hierarchical porous OMCs with cubic symmetry was carried out under hydrothermal conditions assisted with zirconium oxychloride and using pre-synthesized phenol/formaldehyde resol as the carbon precursor, F127 as the structure directing agent and HCl as the catalyst. Fig. 1 shows the XRD patterns of the samples carbonized at different temperatures. The sample OMC1-0.04-2-400, pyrolyzed at 400 °C, displays well-resolved reflections that can be indexed to the (110), (200), (211), (220), and (310) planes of the body-centered cubic symmetry (Im3m). After pyrolysis at higher temperatures, the samples OMC1-0.04-2-600 and OMC1-0.04-2-800 (pyrolyzed at 600 °C and 800 °C, respectively) still show three well-resolved peaks, indicating the high thermal stability of the structure. Moreover, with increasing pyrolysis temperature, the corresponding peaks shift to higher angles due to framework shrinkage. The unit cell parameters (a0) of the samples pyrolyzed at 400 °C, 600 °C, and 800 °C are calculated to be 12.7, 11.7 and 11.2 nm, respectively.
image file: c5ra19416d-f1.tif
Fig. 1 XRD patterns of samples pyrolyzed at different temperatures.

The TEM images of the samples OMC1-0.04-2-400 (Fig. 2a–c), OMC1-0.04-2-600 (Fig. 2d–f) and OMC1-0.04-2-800 (Fig. 2g–I) viewed along the [100], [111] and [110] directions further confirm the presence of a highly ordered cubic (Im3m) mesostructure. The corresponding cell parameters estimated from the TEM images are 12.8, 11.4 and 11.4 nm, which are in agreement with the XRD analysis.


image file: c5ra19416d-f2.tif
Fig. 2 TEM images of the pyrolyzed samples viewed along the [100] (a, d, g), [111] (b, e, h) and [110] (c, f, i) directions: (a–c) OMC1-0.04-2-400, (d–f) OMC1-0.04-2-600 and (g–i) OMC1-0.04-2-800.

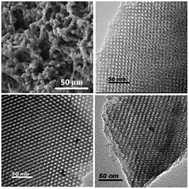
The SEM image (Fig. 3a) of OMC1-0.04-2-600 shows that the sample possesses a fully interconnected macroporous framework constituted by irregular interconnected particles with sizes of ∼5 μm. The macropore sizes estimated from the SEM images are about 3 μm.


image file: c5ra19416d-f3.tif
Fig. 3 SEM images of samples synthesized with different ZrOCl2·8H2O/resol mass ratios: (a) 0.04; (b) 0.06; (c) 0.1; and (d) 0. All the samples were pyrolyzed at 600 °C under nitrogen atmosphere.

The textural properties of the pyrolyzed samples were determined by nitrogen sorption measurements. OMC1-0.04-2-400 possessed a very low surface area (16 cm3 g−1) and poor porosity (0.028 cm3 g−1; Fig. S1). The results were inconsistent with the observation from TG curves (Fig. S2) and TEM images (Fig. 2a–c), which showed that the template decomposed, and ordered mesopores were clearly visible throughout the sample. This may be explained in two ways. One is related to the lower pyrolysis temperature, which results in a less decomposed polymer framework and thus a less developed porosity.26 The other is due to the special cage-like mesopores with narrow windows (pore entrances connecting the cage-like mesopores), which can be easily blocked by the fraction derived from the incompletely decomposed polymer/surfactant composites, thus inhibiting the accessibility of nitrogen to the mesopores. Samples OMC1-0.04-2-600 and OMC1-0.04-2-800 both display typical type-IV nitrogen sorption isotherms with H2-type hysteresis loops and sharp capillary condensation steps at P/P0 = 0.4–0.5 (Fig. 4a), indicating 3-D cage-like mesopores with uniform pore size distributions. In contrast, the BET surface area and pore volume of OMC1-0.04-2-600 reached 871 m2 g−1 and 0.49 cm3 g−1 (Table 1), respectively, due to the continuous decomposition of the surfactant and the component transformation of the framework from polymer to carbon (seen in the TG curves of the as-made sample in Fig. S2), generating open cage-like mesopores and abundant pores. Further increasing the pyrolysis temperature to 800 °C caused the surface area and pore volume to develop further, reaching 1033 m2 g−1 and 0.57 cm3 g−1 (Table 1), respectively. The continuous decomposition of the carbon framework results in plenty of newly generated micropores, the fraction of which reaches 42%.


image file: c5ra19416d-f4.tif
Fig. 4 Nitrogen sorption isotherms (a) and the corresponding pore size distributions (b) of the pyrolyzed samples at different temperatures.

For the materials with large cage-like mesopores and narrow windows, the pore size distributions were determined by the QSDFT method with the cylindrical-spherical adsorption kernel. The adsorption isotherm is always used to determine the cage size, while the window size can be extracted from desorption branch as long as evaporation is controlled by the window restriction.38–42 The capillary evaporation occurs at the lower pressure limit of hysteresis (relative pressure of 0.43), meaning that the sizes of the windows (connecting pores) are below 5 nm.39,43–45 However, due to the lower pressure limit of adsorption-desorption hysteresis (relative pressure of 0.42–0.5 for nitrogen at 77 K), the nitrogen sorption is not suitable for the analysis of pores smaller than 4 nm. In order to obtain more insights into the cage-like mesopore windows of sample OMC1-0.04-2-600, argon sorption measurements were also performed at 87 K and 77 K, for which the lower pressure limits of adsorption–desorption hysteresis are at the relative pressures of 0.38 and 0.30, respectively.39 As shown in Fig. S3, the capillary evaporation in the adsorption–desorption hysteresis of OMC1-0.04-2-600 extends to a lower relative pressure of 0.39 and 0.32 for argon sorption at 87 K and 77 K, respectively, along with that for nitrogen sorption at 77 K, indicating that the pore entrance size is below 4 nm.39

As shown in Fig. 4b, OMC1-0.04-2-600 displays three pore size distributions centered at 2.1, 3.2 and 6.2 nm. According to the above analysis, the first two peaks could be attributed to the windows between the neighboring cage-like mesopores, which are represented by the third peak in the PSDs. When the pyrolysis temperature was increased to 800 °C, the size distribution of the windows remained centered at 2.1 and 3.2 nm. However, a small reduction of 0.3 nm in the size of the cage-like mesopores can be observed for OMC1-0.04-2-800, mainly due to the shrinkage of the framework, in agreement with the XRD analysis (Fig. 1). The fitting errors are 0.09% and 0.078% for OMC1-0.04-2-600 and OMC1-0.04-2-800, respectively, confirming the good agreement between the calculated QSDFT adsorption isotherms and the experimental data (Fig. S4).

Effect of ZrOCl2 on the synthesis of OMCs

During the synthesis of hierarchical porous OMCs with cubic symmetry, the addition of ZrOCl2 is important to control the topologies of the OMCs. When the synthesis was carried out in the absence of ZrOCl2, the products after hydrothermal treatment in the autoclave were divided into two layers.

After pyrolysis at 600 °C under nitrogen, the XRD results (Fig. 5) and TEM images (Fig. S5a–c) show that the materials obtained from the top layer possess a highly ordered mesostructure with body-centered cubic (Im3m) symmetry and irregular morphology (Fig. 3d), while the materials in the bottom of the autoclave are primarily amorphous (Fig. 5). This may be related to the higher condensation rate of the pre-synthesized phenol/formaldehyde resol under acid hydrothermal conditions; thus, a considerable fraction of the resol first cross-linked with each other rather than assembling around the F127 micelles, leading to amorphous materials in the bottom of the autoclave. The yield of the as-made product from the top layer was only 54% (based on resol and F127). Increasing the ZrOCl2 content in the synthetic solution caused the fraction of amorphous materials in the bottom of the autoclave to decrease gradually and disappear completely when the ZrOCl2 content reached 0.02. This suggests that the homogenous product with ordered mesostructure (Fig. 4a) was obtained, and the yield of the as-made sample reached 88% (based on resol, F127 and ZrOCl2·8H2O). As the amount of ZrOCl2·8H2O was increased further, the yield remained almost constant. Therefore, the cross-linking of the resols themselves can be suppressed under the assistance of the zirconium polyoxo oligomers; thus, the condensation of the resol can proceed at a controllable rate around the micelles of the surfactant under hydrothermal conditions, forming a homogenous monolith (Fig. S6). After pyrolysis at 600 °C, the volume of the carbon monolith (OMC1-0.02-2-600) remained at about 54% of the volume of the as-made sample (Fig. S8).


image file: c5ra19416d-f5.tif
Fig. 5 XRD patterns of samples synthesized in the absence of ZrOCl2·8H2O. All the samples were pyrolyzed at 600 °C under nitrogen atmosphere.

Samples with ZrOCl2·8H2O/resol mass ratios varying from 0.02 to 0.1 were analyzed by XRD. The low-angle XRD patterns (Fig. 6a) of the samples display three well-resolved XRD peaks, which can be indexed as the (110), (200) and (211) reflections of a well-ordered body-centered cubic mesostructure. The cell parameter (a0) is almost constant at 11.7 nm for the four samples, indicating that the addition of the zirconium species helps prevent the shrinkage of the framework during high-temperature carbonization. Fig. 6b shows the wide-angle XRD patterns of the samples with different ZrOCl2·8H2O amounts. For OMC1-0.1-2-600, four well-defined diffractions can be observed, which can be indexed as the (101), (110), (112) and (211) reflections of the tetragonal zirconia phase (JCPDs card no. 79-1766). Decreasing the amount of ZrOCl2·8H2O caused the diffraction peaks to become weaker and broader, indicating a gradual decrease in ZrO2 particle size. No obvious diffraction peaks of the tetragonal zirconia phase can be observed in the XRD patterns of OMC1-0.04-2-600. This may be due to the tiny particles uniformly dispersed in the framework of these samples.


image file: c5ra19416d-f6.tif
Fig. 6 Low-angle (a) and wide-angle (b) XRD patterns of samples synthesized with different mass ratios of ZrOCl2·8H2O to resol. All the samples were pyrolyzed at 600 °C under nitrogen atmosphere.

The nitrogen sorption isotherms of the samples synthesized with different amounts of ZrOCl2·8H2O are all typical type-IV curves with a sharp capillary condensation peak at a relative pressure between 0.3-0.5, indicating that the samples have uniform mesopores in the framework (Fig. 7). When the ZrOCl2·8H2O/resol mass ratio was increased from 0.02 to 0.1, all samples had a high BET surface area (797–871 m2 g−1) and large pore volume (0.44–0.49 cm3 g−1) and exhibited similar pore size distributions with the cage-like pore sizes centered at 6.2 nm and window sizes in the range of 2–3.2 nm (Fig. 7). Compared to the sample synthesized without zirconium (Fig. 3d), OMC1-0.04-2-600, OMC1-0.06-2-600 and OMC1-0.1-2-600 possess plenty of macropores in the framework (Fig. 3a–c). Moreover, as can be seen from the SEM images of OMC1-0.04-2-600, OMC1-0.06-2-600 and OMC1-0.1-2-600 (Fig. 3a–c), the macropore size shows an increasing tendency with increasing ZrOCl2·8H2O content.


image file: c5ra19416d-f7.tif
Fig. 7 Nitrogen sorption isotherms (left) and the corresponding pore size distributions (right) of samples with different ZrOCl2·H2O/resol mass ratios: (a) 0.02, (b) 0.04, (c) 0.06 and (d) 0.1. The dv/d[thin space (1/6-em)]log(D) values were vertically offset by 0.25, 0.5 and 0.75 cm3 g−1 nm−1 for b, c and d, respectively. All the samples were pyrolyzed at 600 °C under nitrogen atmosphere.

The effect of acid concentration

The phenol/formaldehyde resol catalyzed by base possesses abundant hydroxymethyl compounds and can be quickly condensed to form highly cross-linked polymers with a 3-D network under acidic conditions.13 The acid concentration in the synthetic solution usually determines the degree of condensation of the synthesized polymer composites, which may influence the structural properties of the final products. The effect of the acid concentration on the mesostructures of the products was investigated (Table 1). The XRD patterns of samples OMC1-0.04-0.5-600, OMC1-0.04-1-600, OMC1-0.04-2-600 and OMC1-0.04-3-600 with acid concentrations of 0.5, 1, 2 and 3 M, respectively, all display three well-resolved peaks, indicating highly ordered mesostructures. However, when the acid concentration decreased to 0.5 M, only one weak and broad diffraction peak can be observed, suggesting a less ordered mesostructure of OMC1-0.04-0.5-600 (Fig. 8).
image file: c5ra19416d-f8.tif
Fig. 8 XRD patterns of samples prepared with different acid concentrations.

The nitrogen sorption isotherms of the samples with different acid concentrations are shown in Fig. 9a. All the samples exhibit type-IV isotherms with a clear capillary condensation step in the relative pressure range of 0.3–0.5, indicating the presence of mesopores in the sample frameworks. Samples OMC1-0.04-3-600 and OMC1-0.04-2-600 display narrow cage-like pore size distributions centered at around 6.2 nm, with the window size in the range of 2-3.2 nm (Fig. 9b). However, with decreasing acid concentration, both the cage-like pores and the pore entrances gradually widened, indicating the gradual deterioration of the structural ordering of the samples prepared, in good agreement with the XRD analysis.


image file: c5ra19416d-f9.tif
Fig. 9 Nitrogen sorption isotherms (a) and the corresponding pore size distributions (b) of samples prepared with different acid concentrations. The dv/d[thin space (1/6-em)]log(D) values were vertically offset by 0.25, 0.5 and 0.75 cm3 g−1 nm−1 for OMC1-0.04-1, OMC1-0.04-2 and OMC1-0.04-3, respectively. All the samples were pyrolyzed at 600 °C under nitrogen atmosphere.

The textural properties of the samples are listed in Table 1. Higher BET surface area and total pore volume can be observed for the samples prepared with higher acid concentrations. The micropore fractions (based on the volume ratio of micropores to total pores) are only 28% and 22% for OMC1-0.04-3-600 and OMC1-0.04-2-600, respectively, indicating that mesopores are predominant in these samples. With decreasing acid concentration, the BET surface area and total pore volume decrease remarkably, and the micropore fraction becomes noticeable, particularly for OMC1-0.04-0.5-600, in which 68% of the total pore volume is contributed by the micropores. This is because the polymer composites prepared at lower acid concentration always have a lower degree of condensation, and large framework shrinkage occurs during the carbonization process, leading to the loss of structural ordering in the final products.

The effect of the hydrothermal treatment time

Fixing the acid concentration at 2 M and the ZrOCl2·8H2O/resol mass ratio at 0.04, a series of samples were prepared by hydrothermal treatment at 100 °C for 4 to 24 h. As shown in Fig. 10, three well-resolved peaks, indexed as (110), (200) and (211) of Im3m symmetry, can be observed in the XRD patterns of all the samples, indicating the formation of highly ordered mesostructures. The calculated unit cell parameters are in the range of 11.3–12.0 nm and decrease with increasing hydrothermal treatment time. This indicates that prolonging the hydrothermal treatment time may enhance the framework condensation.
image file: c5ra19416d-f10.tif
Fig. 10 XRD patterns of samples prepared with different treatment times. All the samples were pyrolyzed at 600 °C under nitrogen atmosphere.

The nitrogen sorption isotherms of all the samples are shown in Fig. 11a. All samples show type-IV isotherms, indicating the presence of mesopores in the framework. The capillary condensation step shifted towards lower relative pressure with increasing treatment time, suggesting that the size of the cage-like mesopores gradually decreased, which can be further confirmed by the pore size distributions of the samples. As shown in Fig. 11b, the cage-like pore sizes of OMC1-0.04-2-600(4) and OMC1-0.04-2-600(8) are centered at 5.8 and 6.2 nm, respectively, whereas those of OMC1-0.04-2-600(16) and OMC1-0.04-2-600(24) are in the range of 4.2–5.5 nm. The cage-like mesopore windows for all the samples were not influenced, and the sizes remain in the range of 2.0–3.2 nm. The textural properties of the samples are listed in Table 1. The BET surface area and total pore volume of OMC1-0.04-2-600(4) are 785 m2 g−1 and 0.41 cm3 g−1, respectively. When the hydrothermal treatment time was prolonged to 8 h, the BET surface are and total pore volume increased to 871 m2 g−1 and 0.49 cm3 g−1, respectively. This may be related to the lower degree of condensation of the polymeric framework at the shorter hydrothermal treatment time of 4 h, causing more severe framework shrinkage during pyrolysis. A low product yield of 64% was obtained at the hydrothermal treatment time of 4 h, also indicating that the phenolic resin in the synthetic solution had not completely cross-linked with each other. By prolonging the hydrothermal treatment time to 8 h, the yield of the products reached ∼88% for OMC1-0.04-2-600(8) and remained constant even as treatment time was extended to 24 h. This suggests that a hydrothermal treatment time of 8 h is sufficient for the fast synthesis of OMCs with cubic symmetry. Further increasing the hydrothermal treatment time led to reductions in the specific area and total pore volume (Table 1) due to the negative effect of the hydrothermal treatment on the interaction between the surfactant and phenolic resin.


image file: c5ra19416d-f11.tif
Fig. 11 Nitrogen sorption isotherms (a) and pore size distributions (b) of samples prepared with different treatment times. The dv/d[thin space (1/6-em)]log(D) values were vertically offset by 0.25, 0.5 and 0.75 cm3 g−1 nm−1 for OMC1-0.04-2-600(8), OMC1-0.04-2-600(16) and OMC1-0.04-2-600(24), respectively. All the samples were pyrolyzed at 600 °C under nitrogen atmosphere.

The effect of the thermal treatment conditions

Interestingly, when the synthesis of mesoporous carbon was transferred from hydrothermal treatment to ambient pressure, the mesophase of the product changed from 3-D cubic to 2-D hexagonal mesostructure. Taking sample OMC2-0.04-2 as an example (pyrolyzed at 600 °C), four clear peaks can be observed in the XRD pattern (Fig. 12A(c)). The d-spacing value ratio of these well-resolved peaks was 1[thin space (1/6-em)]:[thin space (1/6-em)]√3[thin space (1/6-em)]:[thin space (1/6-em)]2[thin space (1/6-em)]:[thin space (1/6-em)]√7, suggesting a 2-D hexagonal mesostructure (P6mm), different from those (Fig. 1) of OMC1-0.04-2-600 synthesized using the same reagent composition under hydrothermal treatment. The ordered stripe-like and hexagonal arrays viewed along the [001] (Fig. 13a) and [110] (Fig. 13b) directions can be clearly observed, further confirming the 2-D hexagonal mesostructure of OMC2-0.04-2.
image file: c5ra19416d-f12.tif
Fig. 12 XRD patterns (A) of the samples prepared with different ZrO2 contents under ambient pressure and pyrolyzed at 600 °C under nitrogen atmosphere: (a) OMC2-0-2; (b) OMC2-0.02-2; (c) OMC2-0.04-2; (d) OMC2-0.1-2. (B) Nitrogen sorption isotherms and the corresponding pore size distribution (inset) of OMC2-0.04-2.

image file: c5ra19416d-f13.tif
Fig. 13 TEM images of sample OMC2-0.04-2 viewed along the [01] (a) and [10] (b) directions.

Sample OMC2-0.04-2 displays a typical type-IV nitrogen sorption isotherm with a clear hysteresis loop and sharp capillary condensation step at P/P0 = 0.4–0.5 (Fig. 12B), indicating mesoporous characteristics with uniform pore size distributions. An H2-type hysteresis loop was observed for OMC2-0.04-2, indicating the blockage of the mesopore channels due to the residue derived from the uncompleted removal of the template agents. Furthermore, considerable framework shrinkage occurred during the carbonization process. The pore size distribution of OMC2-0.04-2 calculated from the adsorption branch of the nitrogen sorption isotherm by the cylindrical adsorption kernel is shown in Fig. 12B (inset); the narrow mesopore size distribution is centered at 4.7 nm.

In aqueous solution, zirconium is thought to exit in the form of polyoxo ions,46,47 which can interact with the PEO group of the template (F127) and also the resol via hydrogen bonding. Based on our previous studies,32,33 the template F127 at the present concentration has a strong tendency to form cylindrical micelles in aqueous media. The co-assembly of the surfactant (F127), resols and zirconium polyoxo species is induced by HCl to form cylindrical core–shell composites, which can gradually pack together to form the 2-D hexagonal mesostructure. Subsequent treatment at 100 °C under ambient pressure causes the resol to polymerize into PF polymers, leading to the macrophase separation of 2-D hexagonal resol/zirconium/F127 composites from the aqueous solution. Samples with different ZrO2 contents (the ZrOCl2·8H2O/resol mass ratio = 0–0.1) display similar XRD patterns (Fig. 12A) to OMC2-0.04-2, indicating that the ZrOCl2·8H2O content does not influence the mesostructure of the sample prepared under ambient pressure.

Under hydrothermal treatment, a mesophase transformation from 2-D hexagonal to 3-D cubic mesostructure occurred at different temperatures. As shown in Fig. S7a, three well-resolved peaks indexed as (110), (200) and (211) of Im3m symmetry can be observed in the XRD patterns of the samples prepared at 90–120 °C under hydrothermal conditions, while the samples prepared at the corresponding temperatures under ambient pressure display well-resolved peaks of P6mm symmetry (Fig. S7b). This result suggests that the mesophase transformation is not temperature-dependent. Therefore, there must be some differences in the interactions among the template (F127), phenolic resol and the zirconium species under the two different thermal treatment conditions, leading to the mesostructural transformation. Generally, the formation of the cage-type cubic mesostructure (Im3m) is related to the higher hydrophilic/hydrophobic interfacial curvature in the micelles of the template.12 Under hydrothermal conditions, the zirconium species in the synthetic system play two crucial roles. First, with the assistance of the zirconium polyoxo species, the condensation of the phenolic resin can be controlled at a moderate rate around the micelles of the template. Second, more zirconium polyoxo ions could interact with the polyethylene (PEO) chains of F127 through hydrogen bonding, leading to the swelling of the hydrophilic volume ratio, thus increasing the hydrophilic/hydrophobic volume ratio and the interfacial curvature. A direct proof is that the ZrO2 content in the carbonized OMC1-0.04-2-600 sample is 14%, which is higher than that for OMC2-0.04-2 (8%, observed from the TG curve in Fig. S8). Hence, we believe that the hydrophilic/hydrophobic interfacial curvature was enhanced when the synthetic solution was treated under hydrothermal conditions compared to under ambient pressure. Therefore, it is reasonable that the mesophase transformation from hexagonal to cubic mesophase occurred under hydrothermal conditions, resulting in materials with body-centered cubic mesostructures.

Large-scale synthesis

Under the suitable conditions, the synthesis can be carried out easily in large quantities. Fig. S9 shows the nitrogen sorption isotherms of OMC1-0.04-2-600 synthesized on a large scale that the synthesis was amplified to 20 times. The sample displays a typical type-IV curve with a narrow pore size distribution. The BET surface area, pore volume and pore size of the large-scale sample are 865 m2 g−1, 0.48 cm3 g−1 and 3.8 nm, respectively, nearly the same as those of the small-batch sample. The micropore fraction is 28%; together with the XRD pattern (Fig. S10), this further indicates that the sample from the large-scale synthesis also possesses a well-ordered mesostructure.

Activation of the OMCs with KOH and adsorption of CO2

In recent years, great efforts have been devoted to the mitigation of carbon dioxide emissions, which has caused significant climate change as a result of global warming and environmental deterioration.48 Among different strategies for CO2 abatement, CO2 capture using porous solid adsorbents has attracted considerable attention.49 Due to the low price, high specific surface area, excellent thermal and chemical stabilities, and low energy requirements for regeneration, porous carbons are regarded as promising adsorbents.50 Herein, the as-made OMCs were activated and used as adsorbents for CO2 capture.

Sample OMC1-0.04-2-600 was activated with KOH and denoted as KOMC1-x, where x means the KOH/carbon mass ratio. As shown in Fig. 14, as the KOH/carbon mass ratio increased from 2 to 4, the XRD peaks of the activated samples become broader, and the intensities decreased obviously, suggesting the degradation of the ordered mesostructure due to the etching of the carbon mesopores by KOH. KOMC1-2 and KOMC1-3 still present three XRD peaks, as in the pattern of the pristine sample OMC1-0.04-2-600, indicating that the mesostructure can be retained when the KOH/carbon mass ratio is lower than 3. However, sample KOMC1-4 shows only one weak peak, which means that the ordered mesostructure was destroyed.


image file: c5ra19416d-f14.tif
Fig. 14 XRD patterns of samples OMC1-0.04-2-600 and the samples activated with KOH.

The nitrogen sorption isotherms of these activated materials were a combination of type I and type IV (Fig. 15). For KOMC1-4, they were almost exclusively type-I isotherms, indicating the degradation of the ordered mesostructure. Both the BET surface area and pore volume are enlarged after activation from the respective values of 775 m2 g−1 and 0.47 cm3 g−1 for OMC1-0.04-2-600 to 1186 m2 g−1 and 0.57 cm3 g−1 for KOMC1-2, 1636 m2 g−1 and 0.73 cm3 g−1 for KOMC1-3, and 2322 m2 g−1 and 1.01 cm3 g−1 for KOMC1-4. Thus, the BET surface area and pore volume increased with increasing KOH/carbon mass ratio (Table 2). The increasing surface area and pore volume can be attributed to the formation of additional micropores due to KOH activation (Fig. 15b). OMC2-0.04-2-600 was also activated at the same condition as OMC1-0.04-2-600. Although the mesostructures were different, similar changes were observed in the micro- and mesostructures (Fig. S11, S12 and Table 2).


image file: c5ra19416d-f15.tif
Fig. 15 Nitrogen sorption isotherms (a) and pore size distributions (b) of OMC-0.04-2-600 and the samples activated with KOH.
Table 2 Textural properties of the activated samples
Sample SBET (m2 g−1) Smicro (m2 g−1) Vt (cm3 g−1) Vmicro (cm3 g−1) Vua (cm3 g−1)
a Vu is the volume of micropores with diameters smaller than 0.7 nm determined from CO2 adsorption isotherms at 1 atm and 0 °C.
OMC1-0.04-2 775 380 0.47 0.14 0.17
KOMC1-2 1186 833 0.57 0.31 0.29
KOMC1-3 1636 1312 0.73 0.48 0.34
KOMC1-4 2322 2100 1.01 0.79 0.27
OMC2-0.04-2 660 243 0.47 0.09 0.14
KOMC2-2 921 474 0.55 0.17 0.23
KOMC2-3 1077 760 0.59 0.31 0.26
KOMC2-4 1459 1283 0.70 0.50 0.31


Fig. 16 shows the CO2 adsorption isotherms of OMC1-0.04-2-600 and the samples activated with KOH. For OMC1-0.04-2-600, the CO2 adsorption was about 3.5 and 2.2 mmol g−1 at 0 °C and 25 °C, respectively. After KOH activation, the CO2 adsorption increased obviously. For KOMC1-2, KOMC1-3 and KOMC1-4, the CO2 adsorptions are 6.0, 6.9 and 6.3 mmol g−1 at 0 °C, and 3.8, 4.1, 3.3 mmol g−1 at 25 °C, respectively. These adsorption values are higher than those of some nitrogen-containing mesoporous carbons51–54 and commercial activated carbons (<2 mmol g−1 at 25 °C).55


image file: c5ra19416d-f16.tif
Fig. 16 CO2 sorption isotherms of OMC1-0.04-2-600 and the samples activated with KOH at 0 °C and 25 °C.

Although KOMC1-4 had the largest pore volume and BET surface area, its CO2 adsorption amount was lower than those of KOMC1-2 and KOMC1-3, suggesting that the BET surface area and total pore volume have little influence on the CO2 adsorption. Based on previous reports,56 ultramicropores (micropores with dimensions below 0.7 nm) are mainly responsible for high CO2 adsorption at low pressure. As can be seen in Fig. 17a, the ultramicropore volumes of KOMC1-3, KOMC1-2 and KOMC1-4 are 0.34, 0.29 and 0.27 cm3 g−1, respectively. Thus, it is not surprising that KOMC1-3, which had the highest volume of ultramicropores, showed the highest CO2 uptake under the same conditions.


image file: c5ra19416d-f17.tif
Fig. 17 Cumulative pore volumes of samples OMC1-0.04-2-600 (a) and OMC2-0.04-2-600 (b) and the activated samples determined from CO2 adsorption isotherms at 0 °C.

In contrast to the samples in the OMC1-0.04-2-600 series, the volumes of ultramicropores in the OMC2-0.04-2-600 series samples increased with increasing KOH/carbon mass ratio (Fig. 17b) because it is difficult to activate OMC2-0.04-2-600 with KOH. The corresponding CO2 uptakes of OMC2-0.04-2-600, KOMC2-2, KOMC2-3, KOMC2-4 are 3.0, 4.8, 5.4, and 6.6 mmol g−1 at 0 °C and 1 atm, and 1.9, 3.2, 3.6, and 3.9 mmol g−1 at 25 °C (Fig. S13), respectively, lower than those of the OMC1-0.04-2-600 series samples under the same activation conditions.

Conclusions

Hierarchical porous carbons with ordered cubic mesostructures (Im3m) were synthesized under acidic aqueous conditions by a zirconium-promoted hydrothermal method using F127 as a template, pre-synthesized resol as carbon precursor, hydrochloric acid as catalyst and zirconium oxychloride as an assistant agent. The zirconium polyoxo oligomers in the synthetic solution can control the condensation of the resols at a moderate rate around the micelles of F127 to form mesosporous carbon. Under hydrothermal conditions, zirconium polyoxo oligomers interact with the polyethylene (PEO) chains of F127 through hydrogen bonding, increasing the hydrophilic/hydrophobic volume ratio and the interfacial curvature to promote the phase transformation from 2-D hexagonal to 3-D body-centered cubic mesostructure. With a suitable acid concentration (1.0–3.0 M), hierarchical porous carbons with ordered cubic mesostructures can be synthesized in 8 h on a large scale. After activation with KOH, the pore volume, especially that of ultramicropores, and the BET surface area increased greatly. The highest CO2 uptake is obtained at 1 atm (6.9 mmol g−1 at 0 °C and 4.1 mmol g−1 at 25 °C) when the OMCs were activated with a KOH/carbon mass ratio of 3.0.

Acknowledgements

This work was financially supported by the National Natural Science Foundation of China 21306018.

References

  1. J. Y. Ying, C. P. Mehnert and M. S. Wong, Angew. Chem., Int. Ed., 1999, 38, 56–77 CrossRef CAS.
  2. E. D. Mark, Nature, 2002, 417, 813–821 CrossRef PubMed.
  3. A. H. Lu and F. Schüth, Adv. Mater., 2006, 18, 1793–1805 CrossRef CAS.
  4. A. Taguchi and F. Schüth, Microporous Mesoporous Mater., 2005, 77, 1–45 CrossRef CAS.
  5. R. Ryoo, S. H. Joo and S. Jun, J. Phys. Chem. B, 1999, 103, 7743–7746 CrossRef CAS.
  6. C. D. Liang, Z. J. Li and S. Dai, Angew. Chem., Int. Ed., 2008, 47, 3696–3717 CrossRef CAS PubMed.
  7. Y. D. Xia, Z. X. Yang and R. Mokaya, Nanoscale, 2010, 2, 639–659 RSC.
  8. P. M. Lipic, F. S. Bates and M. A. Hillmyer, J. Am. Chem. Soc., 1998, 120, 8963–8970 CrossRef CAS.
  9. C. D. Liang, K. L. Hong, G. A. Guiochon, J. W. Mays and S. Dai, Angew. Chem., 2004, 116, 5909–5913 CrossRef.
  10. H. Kosonen, J. Ruokolainen, P. Nyholm and O. Ikkala, Polymer, 2001, 42, 9481–9486 CrossRef CAS.
  11. Y. Wan, Y. F. Shi and D. Y. Zhao, Chem. Mater., 2008, 20, 932–945 CrossRef CAS.
  12. Y. Meng, D. Gu, F. Q. Zhang, Y. F. Shi, H. F. Yang, Z. Li, C. Z. Yu, B. Tu and D. Y. Zhao, Angew. Chem., Int. Ed., 2005, 44, 7053–7059 CrossRef CAS PubMed.
  13. Y. Meng, D. Gu, F. Q. Zhang, Y. F. Shi, L. Cheng, D. Feng, Z. X. Wu, Z. X. Chen, Y. Wan, A. Stein and D. Y. Zhao, Chem. Mater., 2006, 18, 4447–4464 CrossRef CAS.
  14. X. Q. Wang, C. D. Liang and S. Dai, Langmuir, 2008, 24, 7500–7505 CrossRef CAS PubMed.
  15. P. F. Fulvio, R. T. Mayes, J. C. Bauer, X. Q. Wang, S. M. Mahurin, G. M. Veith and S. Dai, Catal. Today, 2012, 186, 12–19 CrossRef CAS.
  16. P. Gao, A. Q. Wang, X. D. Wang and T. Zhang, Chem. Mater., 2008, 20, 1881–1888 CrossRef CAS.
  17. X. C. Zhao, A. Q. Wang, J. W. Yan, G. Q. Sun, L. X. Sun and T. Zhang, Chem. Mater., 2010, 22, 5463–5473 CrossRef CAS.
  18. X. C. Zhao, Q. Zhang, B. S. Zhang, C. M. Chen, A. Q. Wang, T. Zhang and D. S. Su, J. Mater. Chem., 2012, 22, 4963–4969 RSC.
  19. L. Liu, F. Y. Wang, G. S. Shao and Z. Y. Yuan, Carbon, 2010, 48, 2089–2099 CrossRef CAS.
  20. L. Liu, Q. F. Deng, T. Y. Ma, X. Z. Lin, X. X. Hou, Y. P. Liu and Z. Y. Yuan, J. Mater. Chem., 2011, 21, 16001–16009 RSC.
  21. G. P. Hao, W. C. Li, S. Wang, G. H. Wang, L. Qi and A. H. Lu, Carbon, 2011, 49, 3762–3772 CrossRef CAS.
  22. G. P. Hao, W. C. Li, D. Qian, G. H. Wang, W. P. Zhang, T. Zhang, A. Q. Wang, F. Schüth, H. J. Bongard and A. H. Lu, J. Am. Chem. Soc., 2011, 133, 11378–11388 CrossRef CAS PubMed.
  23. F. Q. Zhang, Y. Meng, D. Gu, Y. Yan, C. Z. Yu, B. Tu and D. Y. Zhao, J. Am. Chem. Soc., 2005, 127, 13508–13509 CrossRef CAS PubMed.
  24. F. Q. Zhang, Y. Meng, D. Gu, Y. Yan, Z. X. Chen, B. Tu and D. Y. Zhao, Chem. Mater., 2006, 18, 5279–5288 CrossRef CAS.
  25. D. Gu, H. Bongard, Y. Meng, K. Miyasaka, O. Terasaki, F. Q. Zhang, Y. H. Deng, Z. X. Wu, D. Feng, Y. Fang, B. Tu, F. Schüth and D. Y. Zhao, Chem. Mater., 2010, 22, 4828–4833 CrossRef CAS.
  26. A. H. Lu, B. Spliethoff and F. Schüth, Chem. Mater., 2008, 20, 5314–5319 CrossRef CAS.
  27. D. Liu, J. H. Lei, L. P. Guo, D. Y. Qu, Y. Li and B. L. Su, Carbon, 2012, 50, 476–487 CrossRef CAS.
  28. Y. Huang, H. Q. Cai, D. Feng, D. Gu, Y. H. Deng, B. Tu, H. T. Wang, P. A. Webley and D. Y. Zhao, Chem. Commun., 2008, 23, 2641–2643 RSC.
  29. F. J. Liu, C. J. Li, L. M. Ren, X. J. Meng, H. Zhang and F. S. Xiao, J. Mater. Chem., 2009, 19, 7921–7928 RSC.
  30. L. Liu, F. Y. Wang, G. S. Shao and Z. Y. Yuan, Carbon, 2010, 48, 2089–2099 CrossRef CAS.
  31. D. Liu, J. H. Lei, L. P. Guo and K. J. Deng, Carbon, 2011, 49, 2113–2119 CrossRef CAS.
  32. K. K. Hou, A. F. Zhang, L. Gu, M. Liu and X. W. Guo, J. Colloid Interface Sci., 2012, 377, 18–26 CrossRef CAS PubMed.
  33. K. K. Hou, A. F. Zhang, M. Liu and X. W. Guo, RSC Adv., 2013, 3, 25050–25057 RSC.
  34. D. Liu, L. J. Xia, D. Y. Qu, J. H. Lei, Y. Li and B. L. Su, J. Mater. Chem. A, 2013, 1, 15447–15458 CAS.
  35. P. I. Ravikovitch and A. V. Neimark, Langmuir, 2002, 18, 1550–1560 CrossRef CAS.
  36. A. V. Neimark, Y. Z. Lin, P. I. Ravikovitch and M. Thommes, Carbon, 2009, 47, 1617–1628 CrossRef CAS.
  37. G. Y. Gor, M. Thommes, K. A. Cychosz and A. V. Neimark, Carbon, 2012, 50, 1583–1590 CrossRef CAS.
  38. M. Thommes, R. Köhn and M. Fröba, Appl. Surf. Sci., 2002, 196, 239–249 CrossRef CAS.
  39. M. Kruk and M. Jaroniec, Chem. Mater., 2003, 15, 2942–2949 CrossRef CAS.
  40. M. Thommes, B. Smarsly, M. Groenewolt, P. I. Ravikovitch and A. V. Neimark, Langmuir, 2006, 22, 756–764 CrossRef CAS PubMed.
  41. K. A. Cychosz, X. F. Guo, W. Fan, R. Cimino, G. Y. Gor, M. Tsapatsis, A. V. Neimark and M. Thommes, Langmuir, 2012, 28, 12647–12654 CrossRef CAS PubMed.
  42. J. Landers, G. Y. Gor and A. V. Neimark, Colloids Surf., A, 2013, 437, 3–32 CrossRef CAS.
  43. J. R. Matos, M. Kruk, L. P. Mercuri, M. Jaroniec, L. Zhao, T. Kamiyama, O. Teresaki, T. J. Pinnavaia and Y. Liu, J. Am. Chem. Soc., 2003, 125, 821–829 CrossRef CAS PubMed.
  44. C. Y. Wu, Y. T. Hsu and C. M. Yang, Microporous Mesoporous Mater., 2009, 117, 249–256 CrossRef CAS.
  45. F. Kleitz, T. Czuryszkiewicz, L. A. Solovyov and M. Lindén, Chem. Mater., 2006, 18, 5070–5079 CrossRef CAS.
  46. S. H. Joo, R. Ryoo, M. Kruk and M. Jaroniec, J. Phys. Chem. B, 2002, 106, 4640–4646 CrossRef CAS.
  47. Q. Li, J. Xu, Z. X. Wu, D. Feng, J. P. Yang, J. Wei, Q. L. Wu, B. Tu, Y. Cao and D. Y. Zhao, Phys. Chem. Chem. Phys., 2010, 12, 10996–11003 RSC.
  48. C. Azar, K. Lindgren, E. Larson and K. Möllersten, Clim. Change, 2006, 74, 47–79 CrossRef CAS.
  49. E. S. Kikkinides, R. T. Yang and S. H. Cho, Ind. Eng. Chem. Res., 1993, 32, 2714–2720 CrossRef CAS.
  50. M. Sevilla, P. Valle-Vigón and A. B. Fuertes, Adv. Funct. Mater., 2011, 21, 2781–2787 CrossRef CAS.
  51. J. Wei, D. D. Zhou, Z. K. Sun, Y. H. Deng, Y. Y. Xia and D. Y. Zhao, Adv. Funct. Mater., 2013, 23, 2322–2328 CrossRef CAS.
  52. G. P. Hao, W. C. Li, D. Qian, G. H. Wang, W. P. Zhang, T. Zhang, A. Q. Wang, F. Schüth, H. J. Bongard and A. H. Lu, J. Am. Chem. Soc., 2011, 133, 11378–11388 CrossRef CAS PubMed.
  53. J. H. Yu, M. Y. Guo, F. Muhammad, A. F. Wang, F. Zhang, L. Qi and G. S. Zhu, Carbon, 2014, 69, 502–514 CrossRef CAS.
  54. J. H. Yu, M. Y. Guo, F. Muhammad, A. F. Wang, G. L. Yu, H. P. Ma and G. S. Zhu, Microporous Mesoporous Mater., 2014, 190, 117–127 CrossRef CAS.
  55. M. G. Plaza, K. J. Thurecht, C. Pevida, F. Rubiera, J. J. Pis, C. E. Snape and T. C. Drage, Fuel Process. Technol., 2013, 110, 53–60 CrossRef CAS.
  56. N. P. Wickramaratne and M. Jaroniec, J. Mater. Chem. A, 2012, 1, 112–116 RSC.

Footnote

Electronic supplementary information (ESI) available. See DOI: 10.1039/c5ra19416d

This journal is © The Royal Society of Chemistry 2016