Effects of pH value and temperature on the initiation, promotion, inhibition and direct reaction rate constants of natural organic matter in ozonation

Ee Ling Yonga and Yi-Pin Lin*b
aCentre for Environmental Sustainability and Water Security, Faculty of Civil Engineering, Universiti Teknologi Malaysia, 81310 Skudai, Johor, Malaysia. E-mail: eeling@utm.my
bGraduate Institute of Environmental Engineering, National Taiwan University, No. 1, Sec. 4, Roosevelt Road, Taipei 10617, Taiwan. E-mail: yipinlin@ntu.edu.tw

Received 20th September 2015 , Accepted 9th February 2016

First published on 9th February 2016


Abstract

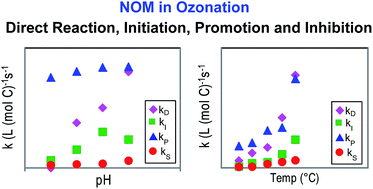
The effects of pH value and temperature on the initiation (kI), promotion (kP), inhibition (kS) and direct ozone reaction (kD) rate constants of natural organic matter (NOM) in water ozonation were investigated in this study. These rate constants were determined using a newly developed method that integrates the classical Rct concept, the transient steady-state hydroxyl radical (˙OH) concentration model and the pseudo first-order ozone decomposition model. Suwannee River fulvic acid (SRFA) was selected as the model NOM. Our results showed that (1) the variation of pH value from 6.5–8.0 had little influence on kP; while kI showed a peak value at pH 7.5, and kS and kD increased with increasing pH, (2) at room temperature, the value of kD is 2.7–5.8 times higher than kI and that of kP is 14–31 times higher than kS at pH 6.5–8.0, indicating that direct ozone reaction and promotion reaction are the dominant pathways for SRFA to react with ozone and ˙OH, respectively, and (3) all rate constants showed a strong dependency on temperature and the activation energies for initiation, promotion, inhibition and direct ozone reaction were determined to be 55.3, 25.6, 50.1 and 49.1 kJ mol−1, respectively. Functional groups in NOM that are potentially responsible for these reactions were discussed. Our results provide deeper insight into the reactions between NOM and ozone/˙OH, and the removal of micropollutants in the ozonation process can be evaluated using the rate constants determined in this study.

1. Introduction

The use of ozone (O3) in advanced drinking water treatment has been increasing over the past several decades. Ozonation is effective both in the inactivation of pathogens1–5 and removal of organic contaminants.6–8 Its use for emerging contaminant degradation in wastewater has also been demonstrated.9–11

O3 is a strong oxidant that selectively attacks the electron-rich moieties of a compound.12 It decomposes in natural water primarily due to its reactions with hydroxide ions (OH) and natural organic matter (NOM).8,13 The reaction between O3 and OH can lead to the formation of the hydroxyl radical (˙OH), a non-selective and stronger oxidant than O3.14,15 Both O3 and ˙OH, therefore, should be considered in the removal of contaminants in the ozonation process.16 NOM is present ubiquitously in natural water systems.17 It can react directly with O3 molecule and participate in reactions characterized as initiation, promotion and inhibition depending on the net production and consumption of ˙OH.13,18,19 Determination of the rate constants of NOM in these reactions is highly desirable because the influences of NOM on the degradation of organic contaminants by ozonation can then be quantified.

We recently developed a new method that can be used to determine the rate constants of NOM in these reactions.20,21 This method requires the addition of different concentrations of an external inhibitor (denoted as S with a second-order rate constant kSS with ˙OH) such as tert-butanol into the experimental solution. By integrating the Rct concept,22 the transient steady-state ˙OH concentration model13 and the pseudo first-order ozone decomposition model,13 the following two equations can be established for a carbonate-free system:

 
image file: c5ra19359a-t1.tif(1)
 
image file: c5ra19359a-t2.tif(2)
where Rct is the ratio of ˙OH exposure to ozone exposure, k1 is the second-order rate constant between OH and O3, [DOC] is the dissolved organic carbon concentration, kI, kP, kS and kD denote the DOC-normalized initiation, promotion, inhibition and direct reaction rate constants of NOM, respectively.

The pseudo-first order rate constant of ozone decomposition (kobs) and the Rct value for each addition of tert-butanol are measured. The values of kI and kS can be determined from the slope and intercept of the plot of 1/Rct vs. kSS[S], respectively (Fig. 1(a)) and those of kP and kD can be determined from the slope and intercept of the plot of kobs vs. Rct, respectively (Fig. 1(b)). This method has been validated with model compounds and the rate constants of three NOM isolates were determined.20,21


image file: c5ra19359a-f1.tif
Fig. 1 Theoretical relationships of (a) 1/Rct vs. kSS[S] and (b) kobs vs. Rct.20,21

Nonetheless, the current development still lacks the fundamental understanding of the behavior of NOM at different pH and temperature. Although these two parameters have been extensively studied in the ozonation process, the information on their effects in the presence of NOM especially on the degradation of organic contaminants are generally limited and qualitative in nature. For instance, it was only known that the removal of organic contaminants in the ozonation process depended strongly on the presence of NOM.23,24 While some contaminants showed effective degradation, those that are more ˙OH-reactive were inhibited.21,25–29 In addition, a change in pH and temperature can greatly influence the specific roles of NOM that affect the removal of organic contaminants but such effects have not been quantitatively reported. A detailed evaluation of the roles of NOM at different pH and temperature, therefore, is important to elucidate the effects of NOM on the degradation of organic contaminants in water ozonation under different environmentally-relevant circumstances.

The objective of this study was to apply the new method to investigate the influences of pH value and temperature on these rate constants of NOM in the ozonation process. The information can improve basic understandings of how NOM responds in terms of these reaction modes to the change of pH value and temperature that can affect the ozone exposure, ˙OH exposure and contaminant removal. The rate constants determined at different temperatures allowed us to calculate the activation energy associated with each reaction mode to explore the thermodynamic characteristics of these NOM reactions. Suwannee River fulvic acid (SRFA), a well-characterized NOM isolate, was used as the model NOM.

2. Materials and methods

2.1. Chemicals

All chemicals used in this study were of 98% purity or greater except for phosphoric acid which was 85% pure, and were used as received. Potassium indigo trisulfonate, para-chlorobenzoic acid (pCBA), sodium thiosulfate and tert-butanol were purchased from Sigma-Aldrich (USA). Hydrochloric acid (HCl), methanol, phosphoric acid, sodium hydroxide (NaOH), sodium hydrogen phosphate and sodium dihydrogen phosphate were supplied by Merck (Germany). All stock and experimental solutions were prepared using ultrapure water produced by Milli-Q Direct 8 Ultrapure Water Systems (Millipore, USA) with a resistivity of 18.2 mΩ cm. Ozone gas generated from pure oxygen by the Anseros ozone generator (model COM-AD-02, Germany) was continuously sparged through a gas-washing bottle containing ultrapure water chilled in an ice bath to acquire fresh aqueous ozone stock solution.30 This generally yielded a concentration of approximately 60 mg L−1 of ozone. Suwannee River fulvic acid (SRFA, 2S101F) purchased from the International Humic Substances Society (IHSS) was dissolved in ultrapure water without pH adjustment and the solution was filtered with a 0.45 μm pore size Whatman (UK) membrane filter before use. The measured carbon content and specific UV absorbance at 254 nm (SUVA254) were 0.47 mg C per mg of SRFA and 5.5 L mg−1 C−1 m−1, respectively.

2.2. Experimental methods

Prior to each experiment, the ultrapure water was pre-ozonated to minimize its ozone demand.15 The pre-ozonated water was acidified with 1.0 M HCl to achieve a pH value of 3.5. The background dissolved inorganic carbon (bicarbonate/carbonate) which could react as an inhibitor was removed by purging the acidified water with nitrogen gas.22 A 1 L screw-top glass bottle equipped with a 10 mL bottle-top dispenser was utilized as the reaction vessel.31

Ozonation of NOM was initiated by adding ozone stock solution into experimental solutions containing phosphate buffer (1.0 mM), tert-butanol (0.03 to 0.3 mM), SRFA (2.0 mg L−1), and the ˙OH probe compound pCBA (0.5 μM) at various pH values (pH 6.5–8.0) and temperatures (12–50.5 °C). Because of the low pCBA concentration employed in the experiments, its ˙OH scavenging capacity was negligible.22 The solution pH was adjusted to the desired pH value using 1.0 M NaOH and HCl under a gentle stream of nitrogen gas. The solution temperature was controlled by immersing the reaction vessel in a water bath connected to a water circulator (Polyscience 9100 series, USA). Samples were taken periodically from the reactor and quenched with indigo solution for ozone and sodium thiosulfate solution for pCBA measurements. The variations of pH value during the experimental period were within ±0.15 unit.

2.3. Analytical methods

Ozone concentration in the stock solution was measured spectrophotometrically at 258 nm (ε = 3100 M−1 cm−1) and that in the experimental solution was determined using the indigo method at 600 nm (ε = 20[thin space (1/6-em)]000 M−1 cm−1).30,32 Both measurements were performed using a Shimadzu UV-1800 (Japan) spectrophotometer. Agilent 1200 series (USA) high performance liquid chromatography system consisting of a variable wavelength detector and Zorbax SB-C18 column (150 × 2.1 mm) was employed to determine the concentration of pCBA. pCBA was eluted using an isocratic mobile phase consisting of methanol (55%) and 10 mM phosphoric acid buffer (45%) at a flow rate of 0.2 mL min−1 and detected at 234 nm at 25 °C.22 The minimum detection limit of pCBA obtained from eight replicates was 0.004 μM. The pH value was measured using a Horiba pH meter (Japan) equipped with an Ag/AgCl pH electrode (Accumet, Cole-Palmer, USA) calibrated with pH 4.0, 7.0 and 10.0 standard buffers (Fisher Scientific, USA). Dissolved organic carbon (DOC) was quantified using the Shimadzu TOC-VCSH analyzer (Japan).

3. Results and discussions

3.1. Effects of pH values

NOM is a heterogeneous macromolecule consisting of a variety of functional groups.33–36 The change of pH value can result in the protonation/deprotonation of certain acidic functional groups and potentially affect the values of kD, kI, kP, and kS of NOM. Ozonation of NOM-containing water typically can be characterized as the initial rapid ozone decomposition and high Rct stage (∼20 s) followed by a relatively slow ozone decomposition and low Rct stage.20,22,37–39 The two-stage ozone decomposition kinetics was also observed in our experiments (Fig. S1). Due to the limitation of the experimental setup in collecting data for the initial stage, the discussion in this paper was focused on the second stage.

Fig. 2 shows the plots of 1/Rct vs. kSS[S] and kobs vs. Rct for pH 6.5 to 8.0 at 21 ± 1 °C with the addition of 0.03–0.3 mM of tert-butanol as the external inhibitor. Linear correlations were found for all pH conditions in both plots, corresponding well to the theoretical correlations shown in Fig. 1. The values of kI, kS, kP and kD calculated from the slope and intercept for each pH value are summarized in Table 1. The value of k1 used in the calculation was 160 M−1 s−1.20,21


image file: c5ra19359a-f2.tif
Fig. 2 (a) 1/Rct vs. (kSS[S]) and (b) kobs vs. Rct plots at various pH value (6.5–8.0). Experimental conditions: SRFA = 2.0 mg L−1, temperature = 21 ± 1 °C, initial ozone concentration = 0.1 mM, tert-butanol = 0.03 to 0.3 mM, pCBA = 0.5 μM and phosphate buffer = 1.0 mM. The error bar represents the standard deviation obtained from triplicate.
Table 1 The second-order rate constants of initiation (kI), inhibition (kS), promotion (kP) and direct ozone reaction (kD) of SRFA at different reaction pH values. Values in the parenthesis indicate the standard deviation calculated from triplicate experiments. Experimental conditions: pH 6.5–8.0, initial ozone concentration = 0.1 mM, tert-butanol = 0.03 to 0.3 mM, pCBA = 0.5 μM, phosphate buffer = 1.0 mM, and temperature = 21 ± 1 °C
pH kI (L mol−1 C−1 s−1) kS (L mol−1 C−1 s−1) kP (L mol−1 C−1 s−1) kD (L mol−1 C−1 s−1)
6.5 0.64 (±0.03) 2.41 (±0.21) × 107 7.54 (±0.66) × 108 3.77 (±0.27)
7.0 1.53 (±0.29) 3.50 (±0.85) × 107 8.32 (±0.92) × 108 4.96 (±0.78)
7.5 3.01 (±0.09) 3.56 (±0.39) × 107 8.37 (±0.82) × 108 8.01 (±0.88)
8.0 2.37 (±0.68) 6.01 (±0.21) × 107 8.44 (±0.90) × 108 9.28 (±0.40)


The value of kI increased 5 times as pH value increased from 6.5 to 7.5 followed by a slight decline from pH 7.5 to 8.0, although the decrease was not statistically significant. Ozone selectively attacks electron-rich functional groups of a compound, such as olefins, amines, and activated aromatic rings12 which are ubiquitous moieties in the NOM macromolecule.36,40 Free amines, deprotonated phenols as well as electron-rich aromatic components have been suggested to be the key moieties in NOM that react as initiators and contribute to the formation of ˙OH in ozonation.9,41 In addition to ˙OH formation via electron transfer, the attack of ozone at the electron-rich aromatic components in NOM may also produce new phenols via the hydroxylation pathway, which has been suggested to be responsible for the continuing ˙OH production after the original reactive sites are consumed.9 The pKa values for simple phenols are typically greater than pH 9.5 except those with halogen and nitro substitutions. The pKa values for protonated amines vary over a wider pH range.12 The complexity of NOM molecule could affect the pKa values of the phenolic and amine groups in its structure. The deprotonated form of the acidic groups and the free amines possessed much greater rate constants with O3 than their protonated counterparts, resulting in the so called “reactivity pK” phenomenon, i.e., a significant variation of rate constant can be observed even at the pH range much less than the pKa values.12 The variation of kI over the pH range investigated in this study, therefore, should be a collective result of the corresponding abundance of free amine and deprotonated phenolic groups and the “reactivity pK” phenomenon. It should be noted that some of these functional groups involving in the initiation reaction might be very reactive and consumed in the fast reaction stage (<20 s),42,43 which could not be captured by the batch experimental procedures employed in this study.

The variation of kP was not significant over the investigated pH range. It has been shown that compounds comprising aliphatic hydroxyl (including polyalcohols and sugars), carboxyl as well as aryl groups could react as promoters,13 suggesting that these functional groups could be important moieties contributing to the promotion characteristics of NOM. The relative constant kP determined at pH 6.5–8.0 should be a result of the similar reactivity of these functional groups toward ˙OH to form superoxide radical and ultimately another ˙OH at this pH range. It has been reported that aliphatic hydroxyacids such as hydroxymalonic acid reacts with ˙OH primarily via the abstraction of the carbon bound H atom to form OOC–C˙(OH)–COO radical and the rate is nearly constant at pH 6–10.44 In the presence of oxygen, OOC–C˙(OH)–COO radical can transform to hydroxyperoxyl radical (OOC–COO˙(OH)–COO) and then release a superoxide radical.44 Similar reaction schematic may exist for tartaric acid.45 It should be pointed out that carboxylic group can also contribute to the inhibition reaction. Leitner and Dore (1996)45 reported that ˙OH attacks unsubstituted carboxylic acids, such as malonic acid and succinic acid, primarily at the C–C bond and causes its cleavage without forming peroxyl radicals, suggesting that the hydroxy substitution could be a crucial factor to make a carboxylic acid or similar moiety in the NOM molecule a potential promoter.

In general, the kS value increased with the increasing pH value although the increment from pH 6.5 to 7.5 was not statistically significant. It is well established that simple molecules such as tert-butanol and acetate act as effective inhibitors, although under high concentrations they may partially contribute to the promotion reactions due to bimolecular decay of their peroxyl radical formed from the reactions with ˙OH.44,46 Carboxylic, aliphatic hydroxyl and aryl groups could be important moieties responsible for the inhibition properties of NOM.13 It is known that the rate constant of an acid with ˙OH generally is higher when the acid is deprotonated. For example, the rate constant of bicarbonate with ˙OH (8.5 × 10⁶ M−1 s−1) is higher than that of carbonate (4 × 10⁸ M−1 s−1).12 The observed increase of kS as a function of increasing pH could be attributed to the deprotonation of the responsible acidic moieties in NOM.

The value of kD was found to increase with the increasing pH value. It is known that olefins can react directly with ozone without ˙OH formation according to the Criegee mechanism.12 Aromatic compounds may also react directly with ozone contributing to the direct reaction pathway although it may be accompanied by a small yield of ˙OH.12 These functional groups can contribute significantly to the direct reaction of NOM with ozone. When an acidic group is present, the deprotonated anion can supply additional electron density to C–C double bond and increase the rate of direct reaction due to the elecrophilicity of ozone. The trend of a higher kD at a higher pH should result from the deprotonation of acidic functional groups and the “reactivity pK” phenomenon described earlier.

It is interesting to compare kI versus kD, both resulting from the reactions of NOM with ozone and kS versus kP, both resulting from the reactions of NOM with ˙OH. As shown in Table 1, kD is 2.7–5.8 times higher than kI, indicating that 73–85% of the reaction between SRFA and ozone proceeded via the direct reaction pathway, most likely for the cleavage of C–C double bond. kP is 14–31 times higher than kS, indicating that 93–97% of the reaction between SRFA and ˙OH proceeded via the promotion reaction pathway to form secondary organic radicals, in which superoxide radical can be formed in the presence of oxygen and reacts with additional ozone to ultimately generate another ˙OH. The importance of promotion characteristics of NOM in accelerating ozone decomposition has been highlighted in ozonation of surface water38 but its contribution has never been quantified. Using the described approach, the relative contribution of initiation and direct reaction of NOM toward ozone decay and that of promotion and inhibition toward ˙OH reaction can be quantitatively described.

The rate constant of the reaction between SRFA and ˙OH has been determined using electron pulse radiolysis to be 1.60–2.06 × 10⁸ L mol−1 C−1 s−1 (or 1.33–1.72 × 10⁴ L mg−1 C−1 s−1),47,48 which are between the inhibition and promotion rate constants obtained in this study. These rate constant are usually referred as the ˙OH “scavenging” rate constant and are useful in characterizing non-ozone based advanced oxidation processes. In ozonation, however, the “scavenging” reaction comprises both promotion and inhibition reactions, which must be distinguished to fully characterize the influences of NOM on the ozone decomposition and ˙OH formation that are important for quantifying the degradation of organic contaminants in water treatment. The rate constants determined in this study could fulfill these demands.

3.2. Effects of temperature

Fig. 3 shows the plots of 1/Rct vs. kSS[S] and kobs vs. Rct for temperature ranging from 12.0 to 50.5 °C with the addition of 0.03–0.3 mM of tert-butanol at pH 7.0. The ozone decomposition and Rct plot are shown in Fig. S2. The values of kI, kS, kP and kD of SRFA calculated from the slopes and intercepts of the two plots are summarized in Table 2. All rate constants of different reaction modes of SRFA increased with the increasing temperature. kI exhibited the highest increment of 20-fold as the temperature increased from 12 °C to 50.5 °C, followed by kD, kS and kP which increased by 13-, 9- and 4-fold, respectively.
image file: c5ra19359a-f3.tif
Fig. 3 The plots of (a) 1/Rct vs. (kSS[S]) and (b) kobs vs. Rct for 2.0 mg L−1 SRFA at temperature ranging from 12.0 °C to 50.5 °C. Experimental conditions: pH 7.0, initial ozone concentration = 0.1 mM, tert-butanol = 0.03 to 0.3 mM, pCBA = 0.5 μM and phosphate buffer = 1.0 mM. The error bar shows that the experiments were conducted in triplicate.
Table 2 The second-order rate constants of initiation (kI), inhibition (kS), promotion (kP) and direct ozone reaction (kD) for 2.0 mg L−1 of SRFA at different temperature ranging from 12.0 °C to 50.5 °C. Experimental conditions: pH 7.0, initial ozone concentration = 0.1 mM, tert-butanol = 0.03 to 0.3 mM, pCBA = 0.5 μM and phosphate buffer = 1.0 mM
Temp (°C) kI (L mol−1 C−1 s−1) kS (L mol−1 C−1 s−1) kP (L mol−1 C−1 s−1) kD (L mol−1 C−1 s−1)
12.0 0.47 (±0.03) 2.70 (±1.30) × 107 7.24 (±1.06) × 108 2.42 (±0.06)  
21.0 1.53 (±0.29) 3.50 (±0.85) × 107 8.32 (±0.92) × 108 4.96 (±0.78)  
31.5 1.87 (±0.31) 12.89 (±5.22) × 107 12.42 (±1.32) × 108 6.83 (±0.64)  
41.5 4.51 (±0.84) 19.40 (±2.54) × 107 13.42 (±1.09) × 108 16.75 (±2.31)  
50.5 9.38 (±1.50) 25.12 (±4.73) × 107 29.66 (±4.80) × 108 30.95 (±9.21)  


The activation energy for each of the reaction modes can be determined from the Arrhenius equation as shown in eqn (3).

 
image file: c5ra19359a-t3.tif(3)
where Ea represents the activation energy, R represents the universal gas constant (8.314 J mol−1 K−1), T represents the temperature in Kelvin and A is the pre-exponential factor.

According to the activated complex theory or transition-state theory, following relationships apply:49

 
image file: c5ra19359a-t4.tif(4)
 
Ea = ΔH + RT (5)
 
ΔG = ΔHTΔS = −RT[thin space (1/6-em)]ln[thin space (1/6-em)]K (6)
where kB is the Boltzmann's constant (1.38 × 10⁻²³ J K−1), h is Planck's constant (6.626 × 10⁻³⁴ J s), ΔS and ΔH are the change of entropy and enthalpy between the reactants and the activated complex, respectively, ΔG is the Gibbs free energy of activation, and K is the equilibrium constant of the activation.

It should be noted that the value of k1 used in the calculation also depends on the temperature, which can be determined via the integrated form of Arrhenius equation as shown in eqn (7) if the activation energy for the reaction between ozone and OH is known.

 
image file: c5ra19359a-t5.tif(7)
where a and b represent two different temperatures.

Based on the kinetics of ozone decomposition in pure water,13 kobs is directly proportional to k1 value (eqn (8)).

 
kobs = 3k1[OH] (8)

Therefore, the activation energy associated with k1 should be equal to that associated with kobs determined in pure water. Three activation energies determined in pure water were found in the literature: 76 ± 8.3, 79.5 ± 8.0 and 82.5 ± 8.0 kJ mol−1.50,51 The values of k1 at different temperatures were computed using the average of the three activation energies, i.e. 79.3 kJ mol−1. Our previous studies have found that k1 was 160 M−1 s−1 at 21 ± 1 °C.20,21 Employing this k1 value and the average activation energy, k1 values were calculated to be 57, 490, 1326 and 3083 M−1 s−1 for temperature at 12.0, 31.5, 41.5 and 50.5 °C, respectively.

The Arrhenius plots for kI, kS, kP and kD are shown in Fig. 4. Good linear correlations were found indicating that no significant configurational changes of SRFA structure over the temperature range studied.48 The determined Ea, ln[thin space (1/6-em)]A, ΔS, ΔH, ΔG and K based on eqn (3)–(6) are summarized in Table 3. In general, we found distinct differences in ΔS, ΔG and K between the reactions involving ozone (direct reaction kD and initiation reaction kI) and those involving ˙OH (promotion reaction kP and inhibition reaction kS), indicating that different mechanisms and thermodynamic properties are involved in these two groups of reactions (i.e., the Criegee mechanism and ozone electron transfer vs. H-abstraction and ˙OH radical addition). The Ea for direct reaction and initiation reaction are 49.1 and 55.3 kJ mol−1, respectively. These values are comparable with those determined for simple organic compounds reacting with ozone.12,52–54 The Ea for promotion and inhibition reactions are 25.6 and 50.1 kJ mol−1. The difference could result from the different electron densities caused by the hydroxy substitution in the attacked carbon center that differentiates these two types of reaction modes. As discussed above, promotion reaction predominates inhibition reaction, which should reflect in the overall reaction between ˙OH and NOM. Mckay et al. (2011)48 reported that Ea for reaction of ˙OH with different NOM samples including SRFA ranges from 14.4–29.9 kJ mol−1 based on rate constants obtained using electron pulse radiolysis (Ea for SRFA = 14.4 kJ mol−1). Although the promotion Ea for SRFA determined in this study is higher than the reported value, it falls in the range determined for NOM collected from different sources, signifying the important role of NOM as a promoter rather than an inhibitor in water ozonation.


image file: c5ra19359a-f4.tif
Fig. 4 Arrhenius plots for (a) direct reaction (kD) and initiation (kI) rate constants and (b) promotion (kP) and inhibition (kS) rate constants of 2.0 mg L−1 of SRFA at pH 7.0. Error bar represents the standard deviation obtained from triplicate experiments.
Table 3 Activation energy (Ea), pre-exponential factor (ln[thin space (1/6-em)]A), entropy of activation (ΔS), enthalpy of activation (ΔH), Gibbs free energy of activation (ΔG) and equilibrium constant of the activation (K) of initiation (kI), inhibition (kS), promotion (kP) and direct ozone reaction (kD) rate constants for SRFA. Experimental conditions: pH 7.0, initial ozone concentration = 0.1 mM, tert-butanol = 0.03 to 0.3 mM, pCBA = 0.5 μM and phosphate buffer = 1.0 mM, temperature = 12.0 to 50.5 °C
  Ea (kJ mol−1) ln(A) ΔS (J K−1 mol−1) ΔH (kJ mol−1) ΔG (kJ mol−1) K (M−1)
Direct reaction (kD) 49.1 ± 7.1 21.6 ± 2.9 −73.9 ± 21.4 46.6 ± 7.0 68.8 ± 13.4 (1.05 ± 0.19) × 10−12
Initiation (kI) 55.3 ± 4.8 22.7 ± 2.0 −64.6 ± 16.3 52.8 ± 4.8 72.2 ± 9.7 (2.71 ± 0.32) × 10−13
Promotion (kP) 25.6 ± 6.9 31.1 ± 2.8 5.1 ± 0.1 23.1 ± 0.2 21.6 ± 0.1 (1.74 ± 0.88) × 10−4
Inhibition (kS) 50.1 ± 2.6 38.1 ± 0.8 63.5 ± 6.6 47.6 ± 2.9 28.5 ± 0.9 (1.08 ± 0.31) × 10−5


3.3. Predicting the degradation of micropollutants in the presence of NOM

Removal of micropollutants by ozonation can be affected by NOM, pH and temperature. The removal can be modeled using eqn (9) and (10) where the theoretical Rct and kobs can be obtained from eqn (1) and (2), respectively.
 
image file: c5ra19359a-t6.tif(9)
 
image file: c5ra19359a-t7.tif(10)
where P denotes micropollutant, k˙OH/P and kO3/P represent the second-order rate constant of ˙OH and O3 with micropollutant, respectively, and ∫[O3]dt is the ozone exposure.

Typically, k˙OH/P is in the order of 109 M−1 s−1 and kO3/P can vary over several orders of magnitude. Owing to the limited rate constants of micropollutants at different temperatures, the simulation of their removal was only considered at different pH values. The effects of temperature, however, can be evaluated in the same fashion discussed below if required rate constants are available.

Six micropollutants including five pharmaceutical compounds (diazepam, N(4)-acetyl-sulfamethoxazole, bezafibrate, metoprolol and penicillin G) and a pulp bleach (zinc diethylenediamintetraacetate), which have all been detected in surface waters were studied.55–60 They were selected because of their kO3/P were significantly different, varying over three orders of magnitude. Their pKa and second-order rate constants with O3 and ˙OH are shown in Table 4. 2 mg L−1 SRFA and 2 mM carbonate alkalinity were considered to mimic the real water condition. The modeling results are shown in Fig. 5 and the impacts of pH on their removal are summarized in Table 4. It should be noted again that these results represent the removal in the second Rct stage.

Table 4 Influences of pH on the removal of selected pharmaceutical and organic compoundsa
Compound pKa kO3/P (M−1 s−1) k˙OH/P (M−1 s−1) Impact of pH
a +: enhance removal efficiency; −: inhibit removal efficiency; ×: no effect in removal efficiency.
Diazepam61,62 3.4 (0.8 ± 0.2) (7.2 ± 1.0) × 109 +
Zinc diethylenediamintetraacetate59,63 5.6, 6.1 100 (2.4 ± 0.4) × 109
N(4)-Acetylsulfamethoxazole60,64 5.9 250 (6.8 ± 0.1) × 109 +(<400 s); −(>400 s)
Bezafibrate62,65 3.6 (590 ± 50) (7.4 ± 1.2) × 109 ×
Metoprolol66–68 9.7 1.4 × 10³ (8.4 ± 0.1) × 109 ×
Penicillin G60,61 2.8 4.8 × 10³ (7.3 ± 0.3) × 109 ×


image file: c5ra19359a-f5.tif
Fig. 5 Simulation of the removal of selected micropollutants, (a) diazepam, (b) zinc diethylenediamintetraacetate, (c) N(4)-acetyl-sulfamethoxazole, (d) bezafibrate, (e) metoprolol and (f) penicillin G, in the presence of 2.0 mg L−1 SRFA. Ozonation conditions: pH 6.5–8.0, initial ozone concentration = 0.021 mM, carbonate alkalinity = 2 mM, [P] = 0.5 μM.

The simulation indicated that the removal of diazepam was enhanced by the increasing pH value (Fig. 5(a)). The small rate constant of ozone with diazepam (kO3/P = 0.8 ± 0.2 M−1 s−1) suggests that ˙OH is the main contributor to its removal. In fact, comparing its degradation due to ˙OH oxidation capacity (kO3/P∫[O3]dt) and ozone oxidation capacity (kO3/P∫[O3]dt), the latter can be neglected. According to eqn (1), the total initiation capacity (2k1[OH] + kI[DOC]) increased approximately 8-fold when pH increased from 6.5 to 8.0, in which at <pH 7.0 the contribution of OH to the total initiation capacity was less than 30%, i.e., more than 70% of the ˙OH was contributed by the initiation reaction of SRFA. As pH increased to 7.5 and 8.0, OH contributed 43% and 63% to the total initiation capacity. For zinc diethylenediamintetraacetate, its removal was not affected by pH initially (<400 s), thereafter, decreased with the increasing pH value. Although the ˙OH oxidation capacity increased 7 times as pH increased from 6.5 to 8.0, its contribution to the removal of zinc diethylenediamintetraacetate at pH 8.0 was at most 39%, i.e., the removal due to ozone oxidation became significant due to the higher ozone rate constant (kO3/P = 100 M−1 s−1). Similar trend was observed for N(4)-acetylsulfamethoxazole removal (Fig. 5(c)) but the differences among the four pH values became less significant because of its even higher rate constant with ozone (kO3/P = 250 M−1 s−1). For bezafibrate (Fig. 5(d)), metoprolol (Fig. 5(e)) and penicillin G (Fig. 5(f)), increase in pH did not affect their removal as they can be predominantly removed by ozone (kO3/P > 500 M−1 s−1). Although the results presented here are based on model simulation, the importances of understanding the kinetic behaviors of organic matter and the contribution of ozone and ˙OH to contaminant degradation have been demonstrated in experimental works.11

4. Conclusions

NOM has long been known to simultaneously react as the initiator, promoter, inhibitor and direct ozone consumer in the ozonation process. Although the Rct concept provides an empirical approach to characterize ozone exposure and ˙OH exposure, the lack of NOM rate constants for these reactions is one of the major obstacles to fully understand how NOM affects micropollutant degradation when ozone is used. In this study, the rate constants of NOM in these reactions at various pH values and temperatures were determined and used to investigate the thermodynamic characteristics of these reactions and model the removal of micropollutants. Future study can be devoted to determine the rate constants of NOM collected from different water sources (surface water, groundwater or even wastewater effluent), as well as their values in the initial stage (<20 s) to provide a more thorough understanding of the behaviors of NOM and its impact on contaminant removal in the ozonation process.

Acknowledgements

The authors would like to acknowledge funding from Ministry of Science and Technology, Taiwan (NSC 102-2221-E-002-243-MY3), Ministry of Education, Malaysia (FRGS/1/2014/STWN01/UTM/02/8) and Universiti Teknologi Malaysia (Q.J130000.2609.10J26).

References

  1. C. W. Labatiuk, M. Belosevic and G. R. Finch, Water Res., 1992, 26(6), 733–743 CrossRef CAS.
  2. J. L. Rennecker, B. J. Marinas, J. H. Owens and E. W. Rice, Water Res., 1999, 33(11), 2481–2488 CrossRef CAS.
  3. S. A. Tyrrell, S. R. Rippey and W. D. Watkins, Water Res., 1995, 29(11), 2483–2490 CrossRef CAS.
  4. N. K. Hunt and B. J. Marinas, Water Res., 1997, 31(6), 1355–1362 CrossRef.
  5. A. Driedger, E. Staub, U. Pinkernell, B. Marinas, W. Koster and U. von Gunten, Water Res., 2001, 35(12), 2950–2960 CrossRef CAS PubMed.
  6. R. G. Rice, L. J. Bollyky and W. J. Lacy, Analytical Aspects of Ozone Treatment of Water and Wastewater. Lewis Publishers: USA, 1986 Search PubMed.
  7. W. H. Glaze, Environ. Sci. Technol., 1987, 21(3), 224–230 CrossRef CAS PubMed.
  8. J. L. Acero, K. Stemmler and U. von Gunten, Environ. Sci. Technol., 2000, 34(4), 591–597 CrossRef CAS.
  9. T. Nothe, H. Fahlenkamp and C. von Sonntag, Environ. Sci. Technol., 2009, 43(15), 5990–5995 CrossRef CAS PubMed.
  10. J. Pablo Pocostales, M. M. Sein, W. Knolle, C. von Sonntag and T. C. Schmidt, Environ. Sci. Technol., 2010, 44(21), 8248–8253 CrossRef PubMed.
  11. Y. Lee, D. Gerrity, M. Lee, A. E. Bogeat, E. Salhi, S. Gamage, R. A. Trenholm, E. C. Wert, S. A. Snyder and U. von Gunten, Environ. Sci. Technol., 2013, 47(11), 5872–5881 CrossRef CAS PubMed.
  12. C. von Sonntag and U. von Gunten, Chemistry of ozone in water and wastewater treatment: From basic principles to applications, IWA Publishing, London, UK, 2012 Search PubMed.
  13. J. Staehelin and J. Hoigne, Environ. Sci. Technol., 1985, 19(12), 1206–1213 CrossRef CAS PubMed.
  14. J. Hoigne and H. Bader, Water Res., 1976, 10, 377–386 CrossRef CAS.
  15. J. Staehelin and J. Hoigne, Environ. Sci. Technol., 1982, 16(10), 676–681 CrossRef CAS.
  16. U. von Gunten, Water Res., 2003, 37(7), 1443–1467 CrossRef CAS PubMed.
  17. F. J. Stevenson, Humus Chemistry: Genesis, Composition, Reactions, John Wiley & Sons, New York, 1994 Search PubMed.
  18. P. Westerhoff, R. Song, G. L. Amy and R. Minear, Ozone: Sci. Eng., 1997, 19(1), 55–73 CrossRef CAS.
  19. B. Langlais, D. A. Reckhow, and D. R. Brink, Ozone in Water Treatment: Application and Engineering. Lewis Publishers, USA, 1991 Search PubMed.
  20. E. L. Yong and Y. P. Lin, Water Res., 2012, 46, 1990–1998 CrossRef CAS PubMed.
  21. E. L. Yong and Y. P. Lin, Ozone: Sci. Eng., 2013, 35(6), 472–481 CrossRef CAS.
  22. M. Elovitz and U. von Gunten, Ozone: Sci. Eng., 1999, 21, 239–260 CrossRef CAS.
  23. J. Nawrocki and B. Kasprzyk-Hordern, Appl. Catal., B, 2010, 99(1–2), 27–42 CrossRef CAS.
  24. B. Kasprzyk-Hordern, M. Ziolek and J. Nawrocki, Appl. Catal., B, 2003, 46(4), 639–669 CrossRef CAS.
  25. P. Westerhoff, Y. Yoon, S. A. Snyder and E. C. Wert, Environ. Sci. Technol., 2005, 39(17), 6649–6663 CrossRef CAS PubMed.
  26. R. Rosal, A. Rodriguez, M. S. Gonzalo and E. Garcia-Calvo, Appl. Catal., B, 2008, 84(1–2), 48–57 CrossRef CAS.
  27. R. Rosal, M. S. Gonzalo, A. Rodriguez and E. Garcia-Calvo, J. Hazard. Mater., 2009, 169(1–3), 411–418 CrossRef CAS PubMed.
  28. F. J. Beltran, J. P. Pocostales, P. M. Alvarez and J. Jaramillo, J. Hazard. Mater., 2009, 169(1–3), 532–538 CrossRef CAS PubMed.
  29. S. A. Snyder, E. C. Wert, D. J. Rexing, R. E. Zegers and D. D. Drury, Ozone: Sci. Eng., 2006, 28(6), 445–460 CrossRef CAS.
  30. H. Bader and J. Hoigne, Water Res., 1981, 15, 449–456 CrossRef CAS.
  31. J. Hoigne and H. Bader, Ozone: Sci. Eng., 1994, 16, 121–134 CrossRef CAS.
  32. APHA, WWA and WEF, Standard Methods For The Examination of Water and Wastewater, APHA, Washington DC, 21st edn., 2005 Search PubMed.
  33. J. A. Leenheer, R. L. Wershaw and M. M. Reddy, Environ. Sci. Technol., 1995, 29, 393–398 CrossRef CAS PubMed.
  34. J. A. Leenheer, R. L. Wershaw and M. M. Reddy, Environ. Sci. Technol., 1995, 29, 399–405 CrossRef CAS PubMed.
  35. E. M. Thurman, Organic geochemistry of natural waters, Martinus Nijhof/Dr W. Junk, Dordrecht, 1985 Search PubMed.
  36. P. Westerhoff, J. Debroux, G. Aiken and G. L. Amy, Ozone: Sci. Eng., 1999, 21(6), 551–570 CrossRef CAS.
  37. M. Elovitz, U. von Gunten and H. P. Kaiser, Ozone: Sci. Eng., 2000, 22, 123–150 CrossRef CAS.
  38. J. L. Acero and U. von Gunten, J.–Am. Water Works Assoc., 2001, 93(10), 90–100 CAS.
  39. M. O. Buffle, J. Schumacher, E. Salhi, M. Jekel and U. von Gunten, Water Res., 2006, 40(9), 1884–1894 CrossRef CAS PubMed.
  40. P. Westerhoff, G. R. Aiken, G. L. Amy and J. Debroux, Water Res., 1999, 33(10), 2265–2276 CrossRef CAS.
  41. M. O. Buffle and U. von Gunten, Environ. Sci. Technol., 2006, 40(9), 3057–3063 CrossRef CAS PubMed.
  42. J. Hoigne and H. Bader, Water Res., 1983, 17, 185–194 CrossRef CAS.
  43. F. Munoz and C. von Sonntag, J. Chem. Soc., Perkin Trans. 2, 2000, 10, 2029–2033 RSC.
  44. M. N. Schuchmann, H. P. Schuchmann and C. von Sonntag, J. Phys. Chem., 1995, 99(22), 9122–9129 CrossRef CAS.
  45. N. K. V. Leitner and M. Dore, J. Photochem. Photobiol., A, 1996, 99(2–3), 137–143 CrossRef.
  46. M. N. Schuchmann and C. von Sonntag, J. Phys. Chem., 1979, 83(7), 780–784 CrossRef CAS.
  47. P. Westerhoff, S. P. Mezyk, W. J. Cooper and D. Minakata, Environ. Sci. Technol., 2007, 41(13), 4640–4646 CrossRef CAS PubMed.
  48. G. McKay, M. M. Dong, J. L. Kleinman, S. P. Mezyk and F. L. Rosario-Ortiz, Environ. Sci. Technol., 2011, 45(16), 6932–6937 CrossRef CAS PubMed.
  49. W. Stumm and J. J. Morgan, Aquatic Chemistry: Chemical Equilibria and Rates in Natural Waters, John Wiley & Sons, Inc., Canada, 3rd edn, 1996 Search PubMed.
  50. B. G. Ershov and P. A. Morozov, Russ. J. Phys. Chem. A, 2009, 83(8), 1295–1299 CrossRef CAS.
  51. K. Sehested, H. Corfitzen, J. Holcman and J. E. Hart, J. Phys. Chem., 1992, 96, 1005–1009 CrossRef CAS.
  52. Y. Qiu, C. H. Kuo and M. E. Zappi, Ozone: Sci. Eng., 2007, 24(2), 123–131 CrossRef.
  53. K. E. Leather, M. R. McGillen, M. Ghalaieny, D. E. Shallcross and C. J. Percival, Int. J. Chem. Kinet., 2011, 43(3), 120–129 CrossRef CAS.
  54. A. M. Kharbuli and R. H. D. Lyngdoh, J. Mol. Struct.: THEOCHEM, 2008, 860(1–3), 150–160 CrossRef.
  55. T. A. Ternes, Water Res., 1998, 32(11), 3245–3260 CrossRef CAS.
  56. Y. Yoon, J. Ryu, B. G. Choi and S. A. Snyder, Sci. Total Environ., 2010, 408, 636–643 CrossRef CAS PubMed.
  57. A. Y. C. Lin, T. H. Yu and C. F. Lin, Chemosphere, 2008, 74, 131–141 CrossRef CAS PubMed.
  58. S. Castiglioni, R. Bagnati, R. Fanelli, F. Pomati, D. Calamari and E. Zuccato, Environ. Sci. Technol., 2006, 40, 357–363 CrossRef CAS PubMed.
  59. K. Stemmler, G. Glod and U. von Gunten, Water Res., 2001, 35(8), 1877–1886 CrossRef CAS PubMed.
  60. M. C. Dodd, M. O. Buffle and U. von Gunten, Environ. Sci. Technol., 2006, 40(6), 1969–1977 CrossRef CAS PubMed.
  61. D. T. Manallack, Perspect. Med. Chem., 2007, 1, 25–38 Search PubMed.
  62. M. M. Huber, S. Canonica, G. Y. Park and U. von Gunten, Environ. Sci. Technol., 2003, 37(5), 1016–1024 CrossRef CAS PubMed.
  63. A. E. Martell and R. M. Smith, Critical Stability Constants: Amino Acids, Plenum Press, New York, 1989, vol. 1 Search PubMed.
  64. E. Lee, S. Lee, J. Park, Y. Kim and J. Cho, Drinking Water Eng. Sci., 2013, 6, 89–98 CrossRef.
  65. K. Fent, A. A. Weston and D. Caminada, Aquat. Toxicol., 2006, 76(2), 122–159 CrossRef CAS PubMed.
  66. J. Benner, E. Salhi, T. A. Ternes and U. von Gunten, Water Res., 2008, 42(12), 3003–3012 CrossRef CAS PubMed.
  67. F. J. Benitez, J. L. Acero, F. J. Real and G. Roldan, Chemosphere, 2009, 77(1), 53–59 CrossRef CAS PubMed.
  68. W. Song, W. J. Cooper, S. P. Mezyk, J. Greaves and B. M. Peake, Environ. Sci. Technol., 2008, 42(4), 1256–1261 CrossRef CAS PubMed.

Footnote

Electronic supplementary information (ESI) available. See DOI: 10.1039/c5ra19359a

This journal is © The Royal Society of Chemistry 2016
Click here to see how this site uses Cookies. View our privacy policy here.