 Open Access Article
Creative Commons Attribution 3.0 Unported Licence
Disruption of the self-molecular association of pentanol in binary mixtures with alkylbenzoates: a dielectric relaxation spectroscopy study†
Samiyara Begum,
Abhinay Vardhan‡
,
Atul Chaudhary§
and
Ranga Subramanian*
Department of Chemistry, Indian Institute of Technology, Patna, 801118, India. E-mail: ranga@iitp.ac.in; Fax: +91-612-2277383
First published on 7th December 2015
Abstract
The disruption of the self-molecular association of pentanol by the presence of alkylbenzoate was studied using dielectric relaxation spectroscopy. The complex permittivity spectra of binary mixtures of pentanol (1-pentanol, 2-pentanol and 3-pentanol) and alkylbenzoate (methylbenzoate, ethylbenzoate, propylbenzoate and butylbenzoate) for the entire composition range were determined in a frequency range of 200 MHz to 20 GHz using a vector network analyzer at room temperature. The raw data were fitted to the Havriliak–Negami equation to evaluate the various dielectric parameters of static dielectric constant (εS), high frequency limiting dielectric constant (εα), and relaxation time (τ). The non-linear behaviour of these parameters for mixtures with a pentanol mole fraction represents the hetero-association of polar solvent molecules. A complex of alkylbenzoate with 2-pentanol and 3-pentanol has lower number of dipoles in solution than 1-pentanol and thus, there is a decrease in the molar volume of the rotating entity. The relaxation time reflects that the reorientation of the –OH group of 1-pentanol in a binary mixture with alkylbenzoate is more pronounced than it is for 2-pentanol and 3-pentanol. The dielectric parameters were used in calculating the excess permittivity, excess inverse relaxation time, Kirkwood correlation factor, and Bruggeman factor. These dielectric results were used in interpreting the molecular interaction of the binary mixture with different dipoles in the liquid state.
1. Introduction
The analysis of dielectric properties is important in the study of the molecular association of polar systems through hydrogen bonding in the liquid state.1 Dielectric relaxation spectroscopy2 is a powerful tool to study intramolecular and intermolecular interactions in pure solvents and solvent binary mixtures.1,3 There have been a number of studies carried out to gain insight into molecular interactions in polar binary mixtures and the nature of the interactions present in binary mixtures is yet to be confirmed and is the topic of scientific debate.4,5 In the liquid state, a considerable change in dielectric properties takes place upon mixing.6 In binary mixtures, the molecular interaction caused by hydrogen bonding is complex due to the uncertainty of the involvement of a number of molecules and the identification of the particular bond.Among polar solvents, alcohols are widely used as solvents and undergo self-molecular association by dipole–dipole interactions and hydrogen bonding through the –OH group. Thus alcohols play an interesting role in chemistry and biology and have been the topic of several studies to understand their associative properties with multiple internal structures which depend on the carbon chain length and the position of the –OH group.7 The disruption of the molecular association through the –OH group in the case of pure alcohol by different functional groups will provide a better picture of hydrogen bonding behaviour. Benzoic acid esters, having a dipolar and hydrophobic nature and easily polarizable π electron systems, are categorized as an important solvent.6,8,9 Alkylbenzoates do not self-associate but are good hydrogen bond acceptors and have the ability to separate polar compounds from non-polar, and so have been the choice for a variety of applications.8,10 A dielectric study of binary mixtures of associative alcohols and non-associative alkylbenzoates over the entire composition range will provide information on molecular complex formation in solution. This interacting pair plays an important role in biological systems and drug synthesis.11 Indeed, this has lead to their extensive use in industry, for example 1-pentanol is used as a starting compound in pharmaceutical applications and is also used in the production of several esters.12 These solvents, alcohols and esters are a class of oxygenated volatile organic compounds and are major atmospheric trace gases, affecting air quality.13,14
In the present work, the effect of the addition of alkylbenzoates with increasing alkyl chain length [methylbenzoate (MB), ethylbenzoate (EB), propylbenzoate (PB) and butylbenzoate (BB)] on the self-association of pentanol [1-pentanol (1P), 2-pentanol (2P) and 3-pentanol (3P)] has been studied at different mole fractions. This study has been carried out with the evaluation of the dielectric parameters of excess permittivity, excess inverse relaxation time, Kirkwood correlation factor and Bruggeman factor. These parameters were used in interpreting the molecular interaction of binary liquid mixtures. This study provides information regarding the influence of the –OH group position in pentanol on the pentanol–alkylbenzoate structure.
2. Experimental section
2.1. Compounds and sample preparation
High-purity alcohols, 1-pentanol (≥99.0%), 2-pentanol (98%) and 3-pentanol (98%), and the alkylbenzoates, methylbenzoate (99%), ethylbenzoate (≥99.0%), propylbenzoate (99%) and butylbenzoate (99%), were purchased from Sigma-Aldrich. All pure compounds were dried over 3 Å molecular sieves. Fully miscible binary mixtures of pentanol and alkylbenzoate over the entire composition range were prepared by weight using a digital electronic balance for different mole fractions, Xi of pentanol ranging from 0 to 1.2.2. Measurement
The complex permittivity of the pure compounds and the mixtures were recorded at room temperature. The measurements were performed in the frequency range of 200 MHz to 20 GHz with an Agilent E5071C vector network analyzer along with an Agilent E85070E dielectric probe kit. The calibration of the instrument setup was performed against air, short circuit and water. The Agilent 85070E dielectric software was used to measure the complex permittivity of the samples.2.3. Data analysis
The frequency dependent complex permittivity spectra, obtained from the experiment, were fitted to the Havriliak–Negami (HN) equation15 using non-linear least-squares fitting based on the Levenberg–Marquardt algorithm and is given as follows:In this equation, ε* is the complex permittivity (constant) at a frequency ν with real part ε′ and imaginary part ε′′, εα is the high frequency dielectric permittivity, Δε = εS − εα is the relaxation strength, where εS is the static permittivity, τ is the relaxation time, and α (0 < α ≤ 1) and β (0 < β ≤ 1) are shape parameters representing the symmetric and asymmetric shape of the spectrum.
The interaction of polar liquids 1 and 2 in the mixture is also indicated by the Bruggeman factor16 fB with a volume fraction φ2 of alkylbenzoates. fB is related to the static permittivity and the expression of fB is given by
The plot of fB vs. φ2 is linear for non-interacting solvent mixtures and for interacting solvent mixtures, the plot deviates from linearity. The modified Bruggeman mode17 is defined as
| fB = 1 − [a − (a − 1)φ2]φ2 |
The Kirkwood correlation factor (g),18 is related to the dielectric relaxation parameters and is useful for obtaining information on the liquid structure, molecular orientation and electric dipole orientation in polar solvents. The g factor for a pure solvent is defined as
For a binary mixture of polar solvent 1 and 2, the effective Kirkwood correlation factor geff can be expressed as20
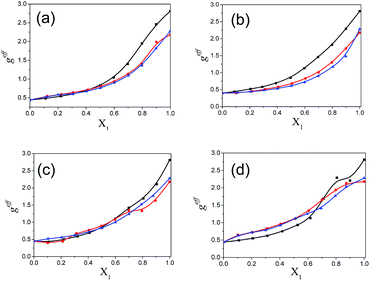
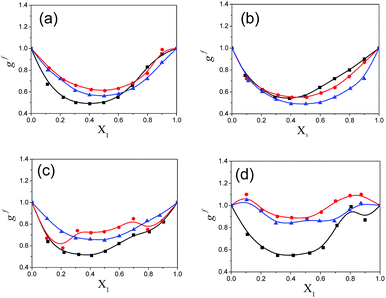
The value of geff changes from g1 (X1 = 1) to g2 (X2 = 1). A geff < 1 indicates an antiparallel orientation of the electric dipoles, while a geff > 1 suggests a parallel orientation of the electric dipoles and geff = 1 indicates no electric dipole correlation. The geff is affected by an amount gf in a mixture. The corrective Kirkwood correlation factor gf is expressed as
In a mixture the reorientation of the constituent solvent molecules cooperatively happens through the hydrogen bonding of the –OH group of pentanol and –CO group of the alkylbenzoates. The apparent free energy of activation ΔFexp of the rearrangement of the dipoles is given by the Eyring formula21
ΔFexp =RT![[thin space (1/6-em)]](https://www.rsc.org/images/entities/char_2009.gif) ln[(kT/h)τ] ln[(kT/h)τ] |
| ΔFtheo= ΔF1X1 + ΔF2X2 |
The excess parameters,23 namely excess permittivity and excess inverse relaxation time, are useful in obtaining information regarding the two polar solvent interactions in the mixture. The excess permittivity εE of the binary mixtures is evaluated as
| εE = (εsm − εαm) − [(εs1 − εα1)X1 + (εs2 − εα2)X2] |
(a) If εE = 0, the solvents 1 and 2 do not interact. (b) If εE < 0, the solvents 1 and 2 interact and the effective dipole moment is decreased. It may lead to multimer formation in the mixture. (c) If εE > 0, the solvents 1 and 2 interact and the effective dipole moment is increased. It may lead to multimer and dimer formation.
The excess inverse relaxation time (1/τ)E of the mixtures represents the average broadening of the dielectric spectra. (1/τ)E is calculated using the following equation:
| (1/τ)E = (1/τm) − [(1/τ1)X1 + (1/τ2)X2] |
The excess inverse relaxation time (1/τ)E provides information on dynamic molecular interactions as follows:
(a) (1/τ)E = 0 reflects no change in the dynamics of the interaction of solvents 1 and 2. (b) If (1/τ)E < 0, due to the interaction of solvents 1 and 2, the effective dipole rotates slowly. (c) If (1/τ)E > 0, the interaction of solvents 1 and 2 results in the effective dipole rotating rapidly.
3. Results and discussion
The plot of the dielectric parameters for butylbenzoate (BB) and 1-pentanol (1P) binary mixtures, as a function of frequency for the 1-pentanol mole fraction, X1 (from 0 to 1), is shown in Fig. 1. In this plot of dielectric loss (ε′′) vs. frequency, the position of the peak observed shifts towards a lower frequency with an increase in the 1-pentanol mole fraction.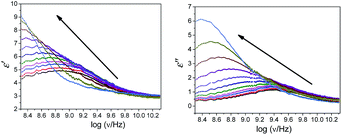 | ||
| Fig. 1 Plot of frequency dependence of the dielectric parameters for butylbenzoate (BB) and 1-pentanol (1P) mixtures at room temperature with increasing 1-pentanol mole fraction (X1 = 0 to X1 = 1). | ||
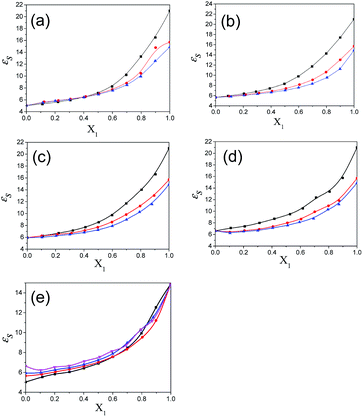
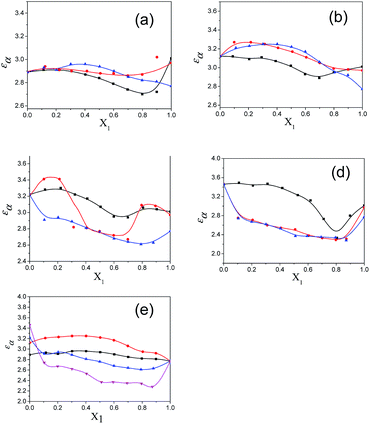
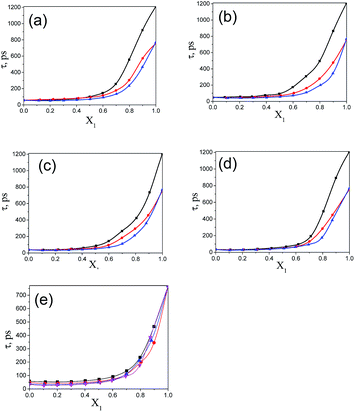
The values of the dielectric parameters, namely the static dielectric constant (εS), high frequency dielectric constant (εα) and relaxation time (τ), were obtained from fitting the dielectric spectra at room temperature for all pure solvents and mixtures and are reported in ESI Tables S1 and S2† and the corresponding figures are shown in Fig. 2–4. These values of εS, εα and τ for pure 1-pentanol and alkylbenzoates are close to the values reported by Navarro et al. using the same experimental procedure.9 The static dielectric constant value for pure 2-pentanol and pure 3-pentanol is found to be in good agreement with the values evaluated by D’Aprano et al. using a bridge method.24 From ESI Table S2† and Fig. 2, it is clear that the static dielectric constant increases for all binary mixtures of alkylbenzoate and pentanol with an increase in 1-pentanol (1P), 2-pentanol (2P) and 3-pentanol (3P) concentration. A similar increase in the static dielectric constant value of the mixture of 1P, 2P and 3P with water was also observed where all three isomers gave a different static dielectric constant value with the same concentration. It is also observed that a change in the static dielectric constant of the mixture is non-linear with the mole-fraction X1 of 1-pentanol, 2-pentanol and 3-pentanol when mixed with methylbenzoate (MB), ethylbenzoate (EB), propylbenzoate (PB) and butylbenzoate (BB). The increase in the static dielectric constant with increasing solvent in a binary solvent mixture signifies that spherical molecular aggregates transform to more correlated elongated aggregates resulting in a parallel orientation of the dipoles.5 Though small, there is a difference in the static dielectric constant value for the three pentanol isomers when mixed with each alkylbenzoate for the same pentanol concentration and this difference is insignificant for the lower pentanol content. The static dielectric constant value for 2-pentanol and 3-pentanol is smaller when compared to that for 1-pentanol. This may be due to a decrease in the number of dipoles of the complex formed in the solution and thus, there is a decrease in the molar volume of the rotating entity. Up to X1 = 0.5, BB shows a similar static dielectric constant value with 1P, 2P and 3P whereas it is X1 = 0.3 for PB and EB. After this point, the curve rises towards a higher εS value with increasing alcohol concentration which is more pronounced in 1-pentanol when compared to 2-pentanol and 3-pentanol. The plot of the 3-pentanol/alkylbenzoate binary mixture is shown in Fig. 2e. Like the mixture of 1-pentanol/alkylbenzoate, a similar trend is observed. From Fig. 2e for the mixture of 3-pentanol/alkylbenzoate, it is noticed that the difference in the εS value among the alkylbenzoates is smaller for the same pentanol concentration than that observed with methanol9 and it is lower for alkylbenzoates with a larger alkyl chain length. After X1 = 0.6, all alkylbenzoates show a similar εS value and up to X1 = 0.6, the εS values follow the order MB > EB > PB > BB. This reflects that with the alkylbenzoate having a longer alkyl group, the number of complex dipoles decreases, thus decreasing the molar volume of the rotating group. For the plot of εα vs. X1 (see Fig. 3), non-linearity is observed and this indicates interaction between pentanol and alkylbenzoate. A non-linear result of a static and high frequency dielectric constant with increasing alcohol concentration for the hetero-association of an alcohol with other polar solvents is reported in the literature.3,5 In a dielectric spectroscopy study of the mixture of alkan-1-ol/alkylbenzoate, it is established that the effect of the alcohol concentration on the εα value is smaller in the case of longer chain alcohols.9 Since the present work deals with long-chained alcohols, namely isomeric pentanols, the same conclusion can be drawn. It is observed that the change in the εα value (see Fig. 3e) is small in the case of the 3-pentanol/alkylbenzoate mixture like for the 1-pentanol/alkylbenzoate mixture. Fig. 3a–d indicate that the alkylbenzoates behave differently with the three pentanol isomers 1P, 2P and 3P resulting in different εα values for the same pentanol concentration. This change in εα is smaller when compared to the mixture of lower alcohols with alkylbenzoates. In Fig. 4, the dielectric relaxation time (τ) of the mixture of MB, EB, PB and BB with 1-pentanol, 2-pentanol and 3-pentanol is seen to increase with the increasing pentanol concentration which is due to the hindrance of the rotation of the molecule. The relaxation time of the 1-pentanol/alkylbenzoate mixture is found to be more than for the 2-pentanol/alkylbenzoate and 3-pentanol/alkylbenzoate mixture and this difference increases with increasing pentanol concentration. This indicates that the reorientation of the –OH group of pentanol depends to some extent on the position of the –OH group in the pentanol backbone. The reorientation of molecules in the mixture is more for the primary alcohol 1-pentanol than in the secondary alcohols 2-pentanol and 3-pentanol when mixed with alkylbenzoates of different alkyl chain length. The difference in the relaxation time for mixtures with 2-pentanol and 3-pentanol is small. Fig. 4e shows the effect of 3-pentanol concentration on the relaxation time of the 3-pentanol/alkylbenzoate mixture. In this figure it is observed that the relaxation time τ follows the order of BB > PB > EB > MB i.e. molecular rotation is hindered with the increasing alkyl chain length of the alkylbenzoates. This observation concurs with the previous study of an alkan-1-ol/alkylbenzoate mixture.
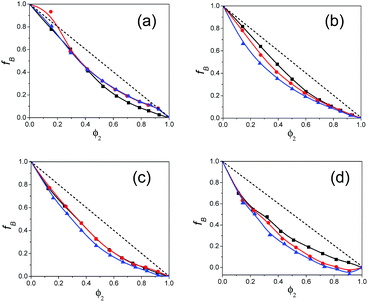
The estimated values of the Bruggeman factor fB for all the binary mixtures of polar solvents alkylbenzoates and pentanols are listed in ESI Table S3† and the plot of fB vs. the volume fraction φ2 of alkylbenzoates is shown in Fig. 5. These plots are useful in evaluating information on the interaction between the pentanol and alkylbenzoate molecules in the mixture. All the plots of fB reflect the deviation from the linear relationship with φ2 which is the result of the hydrogen bonding interaction of the –OH group of 1P, 2P and 3P with the –CO group of BB, PB, EB and MB. Similar nonlinear behavior was also observed for the alcohol when mixed with alkybenzoates.9 The value of the parameter a is shown in ESI Table S4.† For Bruggeman ideal mixtures, the parameter a equals unity. ESI Table S4† shows that a deviates from unity. The value of a is greater than 1 and this indicates the presence of significant hetero-association of the constituent solvent molecules in all mixtures. It also signifies an increase in effective solvent volume.
The calculated Kirkwood correlation parameter gi for pure solvents and geff for the binary mixtures for all mole fractions of pentanol are included in ESI Tables S5 and S6†, respectively. The gi parameter for the pure solvents is in good agreement with the literature values.9 This parameter is important for the information of dipole orientation and the structure of the hetero-association. ESI Table S5† shows that the Kirkwood correlation parameter is less than unity for all pure alkylbenzoates (MB, EB, PB and BB) which indicates the anti-parallel orientation of the electric dipoles in the alkylbenzoates. Pure solvents 1-pentanol, 2-pentanol and 3-pentanol have a gi value greater than unity and thus the molecular dipoles have a parallel orientation. In Fig. 6, it is observed that geff for the binary mixture is concentration dependent and it increases with the addition of 1-pentanol, 2-pentanol and 3-pentanol. The present work indicates that geff increases with isomeric pentanol concentration and it has been postulated in a similar system24 that the increase shows the presence of an anti-parallel configuration of the dipoles. This increase in geff with pentanol content suggests the reorientation of neighboring polar molecules in a mixture with the parallel alignment of the electric dipoles. In a mixture the –OH group of pentanol acts as a proton donor and participates in hydrogen bonding with the polar –CO group of alkylbenzoates. The hetero-associative interaction is possibly due to the hydrogen bonding between the –OH group of pentanol and –CO group of alkylbenzoates to form multimers, which occurs in such a way as to increase the effective dipole moment in the mixture.25 The geff value is higher for PB and BB when mixed with 1-pentanol than with 2-pentanol and 3-pentanol. But with the decrease in alkyl chain length for MB and EB there is less difference in the geff value in the binary mixture with all three pentanols. The binary mixture of PB and BB with 2-pentanol or 3-pentanol shows less difference in the geff value.
The Kirkwood corrective correlation factor gf values, which deviate from unity for all the binary mixtures of the polar solvents, are reported in ESI Table S6† and the corresponding plots are shown in Fig. 7. The deviation from unity is the result of the interaction of the constituent solvent molecules in the mixture. The gf value for pure solvents is unity and it is close to unity for the binary mixtures with a lower concentration of pentanol or alkylbenzoate, which is an indication of the absence of or weak heteromolecular interaction respectively.3 All pentanol/alkylbenzoates show a gf value that deviates from unity for the whole composition range and the presence of the re-alignment of dipoles of neighboring polar molecules. The gf value of MB is close to unity in the case of 2-pentanol and 3-pentanol. This deviation is also less for EB with 2-pentanol and 3-pentanol. The apparent activation energy values of the experimentally determined ΔFexp and theoretically calculated ΔFtheo are recorded in ESI Table S6.† From this table, it is observed that the observed free energy deviates from the theoretically calculated free energy of an ideal solution. This is reflected by the difference ΔFdiff = ΔFtheo − ΔFexp for all binary mixtures in the entire composition range. This deviation from ideal behaviour can be interpreted as the co-operativity of pentanol and alkylbenzoate molecules through hydrogen bonding. The difference value ΔFdiff exhibits a parabolic nature with the increasing mole fraction of pentanol. The maximum region is the co-operativity region between pentanol and alkylbenzoate molecules and is in the composition range of X1 = 0.4 to 0.6. Indeed, the maximum co-operativity region implies hydrogen bonding. This is further supported by the non-linear dependency of the relaxation time of the mixture with pentanol composition. In this region the concentration of the co-operative domain of the pentanol–alkylbenzoate complex is at a maximum.
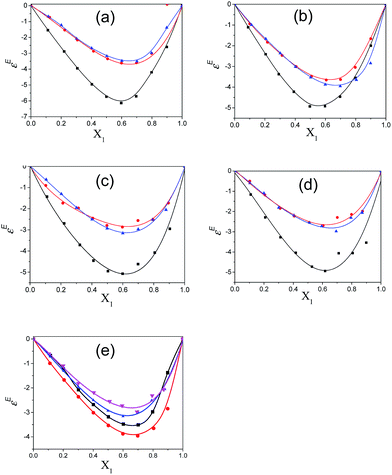
The variation of the excess dielectric parameters, namely the excess static permittivity εE and excess inverse relaxation time (1/τ)E, with pentanol mole fraction X1 at room temperature for all binary mixtures is shown in Fig. 8 and 9 respectively. These two parameters are important which may be evident for the formation of multimers due to polar–polar intermolecular interaction in the mixture. These excess parameters are relative to the ideal solution and can be used to interpret the deviation of the binary mixture from ideality. The trend in behaviour for the three parameters is similar to the three pentanols with MB, EB, PB and BB. From Fig. 8, it is noticed that the value of εE is negative for the whole composition range in the case of all pentanol and alkylbenzoate mixtures. This indicates that the alignment of the two dipoles through hydrogen bonding of the –OH group of the pentanol with –CO group of the alkylbenzoate occurs in such a way that the effective dipole of the mixture is decreased. For all binary mixtures, the εE value is more negative for 1-pentanol in comparison to 2-pentanol and 3-pentanol. This reflects that there is strong intermolecular interaction of the esters with 1-pentanol when compared to the other two pentanol isomers. This indicates that primary alcohols have a greater ability to break the alkylbenzoate structure in comparison to secondary alcohols. The minima for the mixture of the three isomeric pentanols with alkylbenzoate have been found in the range of X1 = 0.6–0.7. There is no order found in the negative value of εE for the 3-pentanol/alkylbenzoate mixture as shown for methanol/alkylbenzoates.9 The difference within the alkylbenzoates is small.
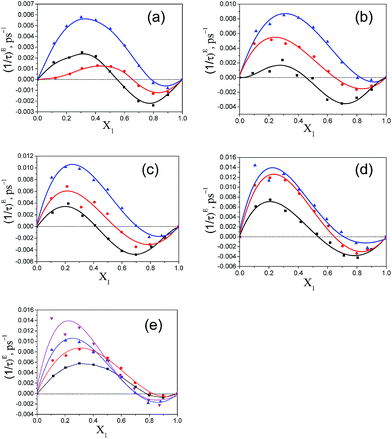
The variation of (1/τ)E with the increasing mole fraction of pentanol, X1, is shown in Fig. 9. From this graph, it is clear that in the ester rich region, the values of (1/τ)E are positive and in the pentanol rich region the values become negative. The positive (1/τ)E value was also noted for the alkan-1-ol/alkylbenzoate mixture in the alkylbenzoate rich region and became negative in the alcohol rich region.9 In the ester rich region, where the pentanol content is low the effective dipole rotates faster in the field created as a result of the intermolecular interaction. With increasing pentanol content, the binary mixtures of pentanol and alkylbenzoates start showing negative values of (1/τ)E and this indicates a slower rotation of the effective dipole in the field created as a result of heteromolecular interaction through hydrogen bonding of the –OH group of pentanol with the –CO of alkylbenzoate. The zero-crossing position of (1/τ)E occurs at different mole fractions for the three pentanol isomers in all binary mixtures. For this position, there is a consistent increase in mole fraction as one traverses from 1-pentanol to 3-pentanol in all binary mixtures. In the case of 3-pentanol with BB, PB, EB and MB binary mixtures, it displays a large positive (1/τ)E value when compared to 1-pentanol and 2-pentanol. From Fig. 9e, it is observed that the order of positive (1/τ)E values is MB > EB > PB > BB with 3-pentanol. In this study, the zero-crossing position of (1/τ)E for the 1-pentanol/MB mixture is found to be different from Navarro et al.9
4. Conclusion
The structural behaviour of binary mixtures of 1-pentanol/alkylbenzoate, 2-pentanol/alkylbenzoate and 3-pentanol/alkylbenzoate has been studied using dielectric relaxation spectroscopy. The dielectric parameters of the static dielectric constant, dielectric constant at high frequency limit, relaxation time, Bruggeman factor, Kirkwood correlation factor and the excess permittivity parameters of excess static permittivity, excess inverse relaxation time have been evaluated at room temperature for the binary mixed solvents at various mole fractions. The formation and strength of the complexes formed in the mixture due to heteromolecular polar–polar interaction through hydrogen bonding has been described through changes in the parameters with the concentration of the constituent solvents. The non-linear behaviour of the static dielectric constant, high frequency dielectric constant and relaxation time with the pentanol mole fraction for all the studied binary mixtures signifies the presence of intermolecular interaction. In the pentanol rich region the effective dipole of the binary mixtures rotates slowly and in the ester rich region this rotation is faster. The number of dipoles of the complex of secondary alcohols/alkylbenzoates formed in the solution is smaller than for primary alcohols and thus, there is a decrease in the molar volume of the rotating entity. 1-Pentanol is found to have a greater ability to interrupt the formation of alkylbenzoate aggregates in comparison to its isomeric counterparts.Acknowledgements
All authors are grateful to IIT Patna for providing research facilities. S. B. is thankful to IIT Patna for financial support. A. V. and A. C. gratefully acknowledge the Department of Science and Technology (Inspire) for financial assistance. The authors are also thankful to the Department of Physics, IIT Patna for the cooperation in the usage of the vector network analyzer.References
- J. P. Martínez-Jimenez, J. M. Fornies-Marquina, D. Digon-Rodríguez and S. Otín-Lacarra, J. Mol. Liq., 2008, 139, 48–54 CrossRef.
- (a) U. Kaatze, Meas. Sci. Technol., 2008, 19, 112001 CrossRef; (b) F. Kremer and A. Schonhals, ChemPhysChem, 2004, 5, 1806–1807 Search PubMed.
- N. Shinyashiki, Nano/Micro Science and Technology in Biorheology, 2015, pp. 215–237 Search PubMed.
- T. M. Mohan, S. S. Sastry and V. R. K. Murthy, J. Solution Chem., 2011, 40, 1847–1862 CrossRef.
- A. N. Prajapati, A. D. Vyas, V. A. Rana and S. P. Bhatnagar, J. Mol. Liq., 2010, 151, 12–16 CrossRef CAS.
- M. K. Kroeger, J. Mol. Liq., 1987, 36, 101–118 CrossRef CAS.
- B. García, S. Aparicio, A. M. Navarro, R. Alcalde and J. M. Leal, J. Phys. Chem. B, 2004, 108, 15841–15850 CrossRef.
- A. M. Navarro, B. García, F. J. Hoyuelos, I. A. Peñacoba, S. Ibeas and J. M. Leal, J. Phys. Chem. B, 2012, 116, 9768–9775 CrossRef CAS PubMed.
- A. M. Navarro, B. García, S. Ibeas, F. J. Hoyuelos, I. A. Peñacoba and J. M. Leal, J. Phys. Chem. B, 2013, 117, 11765–11771 CrossRef CAS PubMed.
- S. Aparicio, R. Alcalde, M. J. Davila, B. Garcia and J. M. Leal, J. Phys. Chem. B, 2007, 111, 4417–4431 CrossRef CAS PubMed.
- A. J. George, An Introduction to Hydrogen Bonding, Oxford University Press, Oxford, England, 1997 Search PubMed.
- K. Verschueren, Handbook of Environmental Data on Organic Chemical, Van Nostrand Reinhold, New York, 2nd edn, 1983, pp. 961–963 Search PubMed.
- H. Singh, Y. Chen, A. Standt, D. Jacob, D. Blake, B. Heikes and J. Snow, Nature, 2001, 410, 1078–1081 CrossRef CAS PubMed.
- F. Cavalli, I. Barnes and K. H. Becker, Environ. Sci. Technol., 2000, 34, 4111–4116 CrossRef CAS.
- S. Havriliak and S. Negami, Polymer, 1967, 8, 161–210 CrossRef CAS.
- D. A. G. Bruggeman, Ann. Phys., 1935, 24, 636–679 CrossRef CAS.
- S. M. Puranik, A. C. Kumbharkhane and S. C. Mehrotra, J. Mol. Liq., 1994, 59, 173–177 CrossRef CAS.
- J. G. Kirkwood, J. Chem. Phys., 1939, 7, 911–919 CrossRef CAS.
- D. R. Lide, CRC Handbook of Chemistry and Physics, 90th edn (CD-ROM version 2010), CRC Press/Taylor and Francis, Boca Raton, FL, 2010 Search PubMed.
- S. M. Puranik, A. C. Kumbharkhane and S. C. Mehrotra, J. Mol. Liq., 1991, 50, 143–153 CrossRef.
- N. E. Hill, W. E. Vaughan, A. H. Price and M. Davies, Dielectric Properties and Molecular Behaiour, Reinhold, London, 1969 Search PubMed.
- D. Bertolini, M. Cassettari, C. Ferrari and E. Tombari, J. Chem. Phys., 1998, 108, 6416–6430 CrossRef CAS.
- M. Tabellout, P. Lanceleur, J. R. Emery, D. Hayward and R. A. Pethrick, J. Chem. Soc., Faraday Trans., 1990, 86, 1453–1459 RSC.
- A. D’Aprano, D. I. Donato and V. Agrigento, J. Solution Chem., 1982, 11, 259–269 CrossRef.
- P. Sivagurunathan, K. Dharmalingam, K. Ramachandran, B. PrabhakarUndre, P. W. Khirade and S. C. Mehrotra, Phys. B, 2007, 387, 203–207 CrossRef CAS.
Footnotes |
| † Electronic supplementary information (ESI) available: The static dielectric constant, high frequency dielectric constant, relaxation time, Kirkwood correlation factor, Bruggeman factor, and excess parameters for the pure and binary mixtures. See DOI: 10.1039/c5ra18716h |
| ‡ Current address: Department of Chemical Science, Indian Institute of Science Education and Research, Mohali, 140306, Punjab, India. |
| § Current address: Department of Chemical Science, Indian Institute of Science Education and Research, Pune, 411008, Maharashtra, India. |
| This journal is © The Royal Society of Chemistry 2016 |


