Improved biomass production by humic analog anthraquinone-2-sulfonate from kitchen waste in a two-phase system

Xingzu Wanga, Guihua Xua, Chunli Wan*ab, Yiwei Ren*ab and Enling Tiana
aKey Laboratory of Reservoir Aquatic Environment, Chongqing Institute of Green and Intelligent Technology, Chinese Academy of Sciences, No. 266 Fangzheng Avenue, Shuitu Hi-tech Industrial Park, Shuitu Town, Beibei District, Chongqing, 400714, China
bDepartment of Environmental Science and Engineering, Fudan University, Shanghai 200433, China. E-mail: hitwan@163.com; Fax: +86-21-65643597; Tel: +86-21-65642018

Received 7th September 2015 , Accepted 15th January 2016

First published on 18th January 2016


Abstract

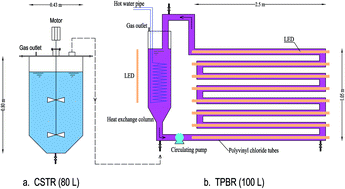
Fermentation products of volatile fatty acids from kitchen waste were explored as substrates of anoxygenic photosynthetic bacteria (APB) in a dark-photo fermentation reactor, and anthraquinone-2-sulfonate (AQS) was firstly applied in photofermentation process to boost the biomass yield. During the hydrolysis and acidification phase, the production of SCOD and volatile fatty acids (VFAs) reached 75.26 g L−1 and 14.2 g L−1 within 72 h, respectively. During the photofermentation phase, the VFAs and NH3–N removal rate in AQS test was 1.44- and 3.0-fold higher than that of control test without AQS addition, respectively. Additionally, AQS increased biomass production by 120% (0.46 g biomass/g COD) than that of control test (0.21 g biomass/g COD). Pyrosequencing results revealed that AQS lead to the highest bacterial diversity and abundance of purple non-sulfur bacteria (22.9%) and denitrifier (8.5% of Planctomyces). This study successfully established synergetic biomass production from fermentation products of kitchen waste with aid of AQS.


1. Introduction

Kitchen waste is organic solid waste with high moisture and salt content, which is difficult to dispose of or treat, resulting in many environmental problems.1 Several conventional methods have been used to treat kitchen waste, such as: composting, incineration, landfill, and anaerobic digestion.2 However, each method has its own disadvantages as followings: large floor space and the undesirable odor occur during composting, greenhouse gas and leachate production during landfill, and high energy-consumption during incineration.3 By contrast, anaerobic digestion can break down organic waste into biogas and overcome the above-mentioned defects, which will effectively alleviate the current energy crisis and environmental problems.4 However, the high salinity and fat content in kitchen waste would significantly inhibit methanogenic activity during anaerobic digestion process.5

Anoxygenic photosynthetic bacteria (APB) are favorable candidates for waste or wastewater treatment due to their high conversion efficiency and less odors release.6 APB can also efficiently utilize oil and tolerate high salinity under light anaerobic conditions.7 Additionally, APB can also produce useful by-product, such as: hydrogen, polyhydroxybutyrate, and biomass.8 Specifically, purple non-sulfur bacteria biomass is rich in proteins and vitamins, which can be utilized as single cell protein for animal feed or biofertilizer.9–11 According to Mekjinda and Ritchie,12 R. palustris efficiently removed COD, ammonia, total solid and total phosphorus from sterile food waste. The economic production of valuable product from waste material by APB show great potential because producing a product could reduce waste treatment and disposal costs. However, the apparent inhibition of APB in sulfate-rich wastewater by sulfate-reducing bacteria (SRB) has been reported by previous studies, although the inhibiting mechanism has been attributed to a variety of factors including competition for electron donor13 or sulphide inhibition.14 Several workers15 reported that inhibition of SRB by molybdate in photofermentation system stimulated the APB growth, but molybdate dosing is effective only for a limited time due to the adaption to molybdate,16 thus the application of molybdate is limited.

Electron shuttles, such as humic substances, can significantly promote the anaerobic biotransformation of various pollutants via accelerating the electron transfer process.17 Anthraquinone-2,6-disulfonate (AQDS) or AQS as humic substances not only accelerate the reduction of electron-accepting priority pollutants but also simulate the anaerobic microbial oxidation of relevant substrates, such as hydrogen and VFAs.18 Considering the wide diversity of quinone-respiring microorganisms and various substrates that can be oxidized via quinone respiration, the addition of AQDS had a significant effect on electron flow in activated sludge and changed microbial communities.19,20 AQDS, like many electron-shuttling compounds, has aromatic antibiotics structure, such as tetracycline, doxorubicin, and pyocyanin. Oxidative stress arises when the quinone is reduced to a semiquinone radical which reduces oxygen to superoxide radicals and reforms the quinone.21 Shyu et al.22 noted that the AQDS may serve as both electron shuttles and antibiotics for bacteria in the environment. Our previous research shows that the AQDS at appropriate concentrations can inhibit the sulfate reduction and induce oxidative stress for SRB, and this may be responsible for the selective inhibition of SRB in the coculture of Rhodopseudomonas palustris W1 and Desulfovibrio desulfuricans DSM 642.

This study adopted a dark-photo fermentation system to obtain substrates from kitchen waste for APB, and the AQS was firstly used to prevent SRB overgrowth and remove adverse substances from acidified kitchen waste in order to boost the APB biomass production. Additionally, the microbial morphology and communities were investigated by the scanning electron microscopic (SEM), extracellular polymeric substances (EPS) staining and high-throughput pyrosequencing technique.

2. Methods

2.1. Kitchen waste preparation

Kitchen waste was provided by Songze Environmental Protection Technology Co., Ltd (Chongqing, China). A 3 mm sieve was used to separate the interfering substances from kitchen waste. Then, the kitchen waste was stewed at 80 °C for 20 min, and the lipids were separated for biodiesel production. The pretreated product was used as inflow of bioreactor, and then the characteristics were listed in Table 1.
Table 1 Characteristics of kitchen waste (after pretreatment)
Parameters Unit Value
Total sugar % 40.61 ± 0.53
Crude protein % 18.5 ± 0.6
Crude fat % 1.29 ± 0.23
SCOD g L−1 52.18 ± 2.16
Soluble biochemical oxygen demand g L−1 28.73 ± 3.69
Total solids % 6.28 ± 0.41
VS % 90.03 ± 1.82
Total organic carbon % 50.32 ± 0.97
Total nitrogen % 0.85 ± 0.08
Carbon to nitrogen ratio (C/N) 59.2 ± 1.05


2.2. Inoculums

Anaerobic digestion sludge collected from a mesophilic anaerobic digester in Beibei municipal wastewater treatment plant (Chongqing, China) was used as inoculum for dark fermentation. The APB mixture for photo fermentation was enriched from the wastewater samples collecting from the previously described photorotating biological contactor reactor.23 Briefly, 100 g of photosynthetic biofilm was added in a graduated cylinder with an enrichment medium. The APB was anaerobicly cultured at room temperature. The light radiation was provided by a 40 W lamp. Seven days later, the enriched bacteria were sub-cultured in fresh medium for 5 times before being seeded into photobioreactor.

2.3. Bioreactor

A dark-photo fermentation system was conducted to check the total effect of AQS addition on organic recovery performances and biomass production in photofermentation phase. The working volume of the dark fermentation (acidogenic) continuous stirred tank reactor (CSTR) and the tubular photobioreactor (TPBR) was 80 L and 100 L, respectively (Fig. 1 and S1). The pH and agitation rate was around 7 and 150 rpm, respectively. The CSTR was maintained at room temperature and operated in batch mode for 3 days as one cycle. The acidified kitchen waste was first settled in a 100 L column for 2 h. The supernatant was diluted to approximately 15 g COD L−1, which was further adopted as influent of TPBR.
image file: c5ra18240a-f1.tif
Fig. 1 Schematic diagram of the CSTR (a) and TPBR (b).

The TPBR was composed of 16 horizontal polyvinyl chloride tubes and a heat exchange column. Each tube had a length of 2.5 m and a 50 mm inner diameter with an 80 L total volume of the tubes. The tubes were exposed to light from one side. The light was supplied by sixteen light emitting diodes (15.5 W), providing a light intensity of 2000 lux. The heat exchange column was 20 L and was consisted of a spiral steel pipe that injected 1 L min−1 of hot water to warm the feed. A centrifugal pump was used to recirculate the feed through the reactor at 0.5 m s−1. Mixed APB culture was used as the inoculum of TPBR. An inoculum volume corresponding to 10% of the volume of the photobioreactor was fed into the TPBR, and the initial biomass concentration was 0.4 g L−1. The TPBR were run under micro-aerobic condition (ORP 0 to −100 mV) by limited aeration. The TPBR was maintained at 35 ± 2 °C by circulating water through a heat exchanger and operated in batch mode for 10 days as one cycle.

2.4. Analysis of EPS and SEM

EPS staining was performed according to Wang et al.24 A fluorescence microscope (CX41, Olympus, Japan) was adopted to observe the EPS distribution in stained samples. For SEM observation, the sludge samples from the TPBR were separately fixed with 2.5% glutaraldehyde in 0.1 mol L−1 phosphate buffer at pH 7.2 for 2 h. After being washed three times in phosphate buffer (0.1 mol L−1, pH 7.0) for 5 min, the samples were dehydrated with graded ethanol (25%, 50%, 75%, 90%, and 100%). The dewatered samples were then lyophilized with a freeze-drier (Virtis, BT4KXL, USA). Finally, dry samples were sputter-coated with gold particles and then observed by using SEM (FEI Quanta 450, USA).

2.5. Microbial community analysis using 454 pyrosequencing

Total DNA was extracted from the sludge samples using E.Z.N.A.® Soil DNA Kit (Omega Biotek, USA). The PCR primers were 341f (CCTACACGACGCTCTTCCGATCTNCCTACGGGNGGCWGCAG) and 805r (GACTGGAGTTCCTTGGCACCCGAGAATTCCAGACTACHVGGGTATCTAATCC), targeting the V3–V4 hypervariable region of bacterial 16S rRNA gene. The PCR products were examined by 1.8% agarose gel electrophoresis. Then, the amplicons were purified using SanPrep DNA Gel Extraction Kit (Sangon, Shanghai, China) and quantified using an Invitrogen Qubit 2.0 Fluorometer (Life Technologies-Invitrogen, Carlsbad, CA, USA). Equal amounts of PCR amplicons from each sample were pooled, and then pyrosequencing was performed with the Illumina-MiSeq Sequencer at the Shanghai Sangon Biotech Co. Ltd. (Shanghai, China).

2.6. Other analysis

Crude fat was determined gravimetrically after extraction of lipids by petroleum ether according to the Soxhlet extraction method.25 Total sugar in the waste was determined according to phenol-sulphuric acid method.25 VFAs concentration was determined using a gas chromatograph (7890A, Agilent, USA) fitted with a flame ionization detector and a DB-FFAP (Agilent Technologies, USA) column (30 m × 0.32 mm × 0.50 μm). Bacteriochlorophyll a (BChl a) concentration in the effluent was analyzed according to the method described by Laurinavichene et al.26 The SO42− and S2− anions were measured by ion chromatography (Dionex 2010i, Sunnyvale, CA, USA). Crude protein was measured using the Kjeldahl nitrogen method. Total nitrogen and total organic carbon was determined using a TOC analyzer equipped with a TN-measuring unit (TOC-VCPH, Shimadzu, Japan). Total solids, volatile solids (VS), soluble chemical oxygen demand (SCOD), BOD5, pH, NH4+–N, suspended solids (SS) and volatile suspended solid (VSS) were determined using the standard methods.27

2.7. Statistical analysis

All analyses were performed at least in triplicate, and the results are presented as the means ± standard deviation (SD), except for the specific annotation. Differences were regarded as significant at P < 0.05. Data were analyzed by one way ANOVA test (using SPSS 17.0 statistical software; Stat Soft Inc., Tulsa, OK).

3. Results and discussion

3.1. Performance of hydrolysis–acidification process

The hydrolysis and acidogenesis performances of CSTR for treating the kitchen waste are depicted in Fig. 2. The SCOD significantly increased in the first 24 h, and reached highest value of 75.26 g L−1 at 72 h (Fig. 2a). Similarly, the VFAs were immediately produced after start-up of CSTR (Fig. 2b). The VFAs concentration linearly increased along with the time and the maximum VFAs concentration was 14.2 g L−1 at 72 h, which was consistent with the performances of SCOD, indicating that the hydrolysis and acidification almost simultaneously occurred. The butyrate and acetate were the primary VFAs, accounting for 82.3% of total VFAs. The formate and propionate were lower with values at 3.8% and 13.9%, respectively, suggesting butyric-type fermentation. A similar result was reported for high levels of butyrate and acetate accumulation, when food waste was acidified in CSTR.28 For kinetic and thermodynamic reasons, butyrate is not easily used by methanogen.29 In contrast, APB can efficiently utilize butyrate as electron donor,30 which implied that VFAs from kitchen waste acidification was more suitable for APB rather than methanogens. As listed in Table 2, a large amount of ammonium (148.8 mg L−1) and sulfate (152.3 mg L−1) from kitchen waste is released with hydrolysis and acidification, indicating protein degradation in the dark fermentation. The first-order model based on SCOD production was used for the determination of the hydrolysis constant during the hydrolysis–acidification process of kitchen waste (Table 2). The hydrolysis rate constants k (0.35 d−1) in this work was bit higher than 0.12–0.32 d−1 reported for hydrolysis process.31–33 The high hydrolysis rate may have occurred because the lipids removals from kitchen waste in pretreatment. Lipids are described in the literature as inhibitory to hydrolytic and acidogenic populations at a metabolic level or at a physical level.31 It has been suggested that if the conversion of lipids is slow, they can form a physical barrier that reducing the accessibility of enzyme attack, thus affecting the rate of hydrolysis. On the other hand, the possible adsorption of lipids on the cells surface can hinder the access of substrates such as saccharides, and therefore, acidification can also be delayed.
image file: c5ra18240a-f2.tif
Fig. 2 Hydrolysis (a) and acidogenesis (b) efficiencies of kitchen waste in CSTR.
Table 2 Characteristics of effluent and hydrolysis rate constant during hydrolysis–acidification process
pH NH4+–N (mg L−1) Sulfate (mg L−1) Sulfide (mg L−1) SCOD (g L−1) Hydrolysis rate constant k (d−1)
7.1 ± 0.3 148.8 ± 9.2 152.3 ± 6.4 0.5 ± 0.2 75.26 ± 3.73 0.35


3.2. Determination of optimal AQS concentration for photofermentation of acidified kitchen waste

In large-scale wastewater treatment or non-sterile APB culture, the inhibitory effects of SRB on APB fermentation had been widely noted.26 To control SRB growth and improve photofermentation performance, AQS was adopted to inhibit SRB growth, and the effects of AQS on APB were also evaluated. In order to rapidly get stable performances of TPBR, the optimum AQS dosage was determined using batch tests. As shown in Fig. 3a, AQS demonstrated the stimulating effects on VFAs removal and biomass production from acidified kitchen waste. The VFAs removal was increased from 48.9% to 87.5% with the increase of AQS concentration from 0 to 3 mmol L−1. The positive effect of AQS on the biomass production was similar to that on VFAs removal (Fig. 3b). The addition of 3 mmol L−1 AQS could also result in a 1.0-fold increase of biomass production. However, continuous increase in AQS concentration triggered no further enhancement on VFAs removal. When AQS was higher than 3 mmol L−1, inhibiting effects on biomass production were observed. In contrast, AQS addition significantly inhibited sulfate reduction activity and decreased sulfide levels in mixed culture. With the increase AQS, the sulfide concentration decreased correspondingly. When AQS dosage exceeded 3 mmol L−1, the toxic sulfide content was lower than 3 mg L−1. The decrease in sulfide levels was not only conducive to improve the VFAs removal by APB, but prevented toxic sulfide introduction into the APB biomass, which will be used as animal feed or biofertilizer. Thus, 2 mmol L−1 was the suitable AQS dosage for photofermentation and used in further TPBR study.
image file: c5ra18240a-f3.tif
Fig. 3 Effect of AQS on VFAs removal, sulfide concentration (a) and biomass production (b). Data are shown as the mean ± SD (n = 3).

3.3. Effect of AQS on TPBR performance

The pollutant removal performances and biomass production in TPBR with and without 2.0 mmol L−1 AQS addition are compared in Fig. 4. Better VFAs and COD removal rates were achieved with AQS addition than that of without AQS (Fig. 4a and b). The VFAs and COD removal efficiency with AQS addition were 81.2% and 55.3%, corresponding removal rate was 1.44- and 1.42-fold higher than control test, respectively. However, as listed in Table 3, 125.6 mg L−1 of sulfate and no sulfide were detected with AQS addition, while majority sulfate was reduced to sulfide in control test. Restated, the AQS effectively suppressed SRB activity, and accordingly prevented APB from toxic sulfide.
image file: c5ra18240a-f4.tif
Fig. 4 Effect of AQS on pollutant removal and biomass production in TPBR. (a) VFAs removal; (b) COD removal; (c) biomass production; (d) BChl a content.
Table 3 Effluent qualities and biomass production in the presence and absence of AQS
  pH NH4+–N (mg L−1) Sulfate (mg L−1) Sulfide (mg L−1) Biomass yield (g biomass/g COD) Crude protein (%)
Control 6.7 ± 0.1 113.4 ± 2.5 23.2 ± 1.1 52 ± 4.5 0.21 ± 0.05 27.4 ± 2.8
AQS 7.8 ± 0.1 37.1 ± 1.8 125.6 ± 9.9 0.46 ± 0.02 44.7 ± 1.5


Furthermore, the effluent NH4+–N with AQS addition was 37.1 mg L−1, which was 2 times higher than that of control test, indicating a simulative effect of AQS on NH4+–N removal. The final pH in AQS test was also higher than that of control test because more VFAs in AQS test were removed.

The biomass production and BChl a content were used to evaluate the biomass yield with and without AQS addition (Fig. 4c and d). The AQS highly promoted the biomass production (3.79 mg L−1 vs. 1.32 mg L−1), and the biomass yield per COD was also two times higher than that of control test (0.46 vs. 0.21 g biomass/g COD). Additionally, the higher BChl a content in AQS test noted that AQS took advantages to photosynthetic bacteria. Due to the more crude protein of APB sludge than non-photosynthetic sludge,35 the crude protein content of AQS test was 1.6 times higher than that of control test (44.7% vs. 27.4%). And, the biomass yield of this study was a bit lower than previous studies (0.49–0.55 g biomass/g COD) which fed with wastewater containing low concentration sulfate;35–37 however was much higher than previous reports (0.24–0.385 g biomass/g COD) using sulfate-rich wastewater (Table 4).38–41 The inhibitory effects of SRB on APB fermentation have been widely reported in sulfate-rich wastewater treatment. Maeda et al. reported undesirable effects of SRB on APB growing in seawater and attributed these affects to the formation of hydrogen sulfide and the subsequent overgrowth of SRB.42 An identical problem has been described for a photofermentation system utilizing a non-sterile hydrolysate of glucose and beef extract.43 Furthermore, although APB could still survive and growth in the photobioreactor operated under sulfate reducing condition,44 but reduction of sulfate by SRB results in production of toxic sulfide, which may enter the APB biomass and hinder its subsequent use as feed or biofertilizer. In our previous research, the humic analog AQDS was used to selectively inhibit SRB in an SRB and APB coculture. At appropriate concentrations, AQDS can decrease the concentration of sulfide and induce oxidative stress for SRB under microaerobic conditions. In this paper, a high sulfate reduction and low BChl a production has been observed in TPBR without AQS addition, indicating SRB activated, leading to a competitive inhibition of APB in the acidified kitchen waste. The results agree well with previous research of inhibition of SRB on APB in photofermentation system. In contrast, addition of AQS significantly improved APB biomass production and prevent sulfate reduction, effectively allowing APB to out-compete SRB during TPBR with 100 L work volume. It indicated that addition of AQS may be considered as a promising option for large-scale APB biomass production from sulfate-rich wastewater.

Table 4 Comparison of the biomass yields from waste materials by photosynthetic bacteria in different systems
Photobioreactor Microorganism Mode of operation Waste material used Biomass yields (g biomass/g COD) Ref.
a The value was calculated based on BOD/COD = 1/2.
Glass flasks (0.6 L) Rhodopseudomonas Batch Synthetic sugar wastewater 0.49 35
Glass flasks (0.15 L) APB enriched culture Batch Domestic wastewater 0.55 36
Flat plate (29.3 L) APB enriched culture Continuous Fermented starch wastewater 0.51 37
Fermenter (2 L) Rhodocyclus gelatinosus R7 Batch Tuna condensate + yeast extract 0.24 38
Conical flasks (0.5 L) Rhodobacter sphaeroides Z08 Batch Soybean wastewater 0.385 39
Membrane photobioreactor (8 L) APB enriched culture Continuous Food processing wastewater 0.3a 40
Membrane bioreactor (8 L) APB enriched culture Continuous Food processing wastewater 0.25a 41


3.4. Observations for microorganisms and EPS distribution in the TPBR process

As shown in Fig. 5a, the sludge in control test was covered with EPS, and the microorganisms were mainly rod-shaped and coccus-shaped. In contrast, the sludge in AQS test was covered with less EPS, and mainly comprised of rod-shaped microorganisms (Fig. 5b), suggesting that the majority of the sludge was comprised of cellular material. Generally, the EPS has been considered inactive organic material, while the microbial cells have been considered metabolically active biomass. It is seen that the microbial cells intensity in AQS test were higher than those in control test, which was beneficial for pollutants removal.
image file: c5ra18240a-f5.tif
Fig. 5 SEM micrographs of sludges from the TPBR in the absence (a) and presence (b) of AQS.

Fig. 6 further illustrates the EPS distribution in sludge from the TPBR on day 10. Without AQS addition, the proteins and lipids were distributed throughout the entire sludge, whereas the β-polysaccharides were accumulated in outer layers (Fig. 6a). The center of the sludge granule was mostly stained by FITC but not by calcofluor white. This result agrees with previous study by McSwain et al.,45 in which the center of sludge granules was mostly labeled with the protein, and the cells and polysaccharides were mainly distributed in the outer layer. This is because that mass transfer limitation caused a center of dead biomass.46 With AQS addition, the proteins and lipids were uniformly accumulated in the sludge, whereas the β-polysaccharides were randomly distributed across the entire sludge granule (Fig. 6b). It is noted that the mass transportation was less limited with AQS addition. It also shows that the calcofluor white stains were detected at the center of the granules, indicating that the stains were able to diffuse into the entire sample.


image file: c5ra18240a-f6.tif
Fig. 6 Images of the sludge growing in the TPBR in absence (a) and presence (b) of AQS, stained with Nile red (lipids, red), fluorescein isothiocyanate (proteins, green), and calcofluor white (β-polysaccharides, blue).

3.5. Microbial communities

Table 5 summarizes the microbial diversities in terms of OTUs, Shannon, ACE, Chao 1 and coverage of sludge samples. On the basis of OTUs number, the sludge in AQS test had the highest microbial diversity than that of control test, which took advantages from the acceleration of electron transfer by AQS. Previous studies with the humic substance analog AQDS suggested that AQDS can serve as an electron shuttle that promote microbial interspecies electron transfer and syntrophic growth, which results in interspecies redistribution of reducing equivalents during complex substrate degradation.18 In addition, quinone respiration was preferred over sulfate reduction when AQDS was supplemented.47 In the present research, the addition of AQS significantly prevents the sulfate reduction and consequently decreased toxic sulfide accumulation (Table 3). Thus, these fundamental differences in interspecies electron transfer and toxic sulfide levels resulted in different microbial diversity in the absence and presence of AQS.
Table 5 The richness and diversity of 16S rRNA sequences at 3% dissimilarity in the control and AQS addition
Samples Reads OTUs Shannon ACE Chao 1 Coverage (%)
Control 15[thin space (1/6-em)]825 376 1.844523 1075 667 98.79
AQS 6750 693 3.942394 2500 1585 93.93


The high-throughput sequencing results were clustered at both phylum and genus level (Table 6). Without AQS addition, the most abundant phyla were only Proteobacteria (92.7%) and Synergistetes (4.8%), while other phyla accounted for 0.2–0.8% of the total reads. With AQS addition, Proteobacteria was the most abundant (70.9%) phylum, followed by Planctomycetes (10.5%) and Synergistetes (9.5%). The other predominant phyla were Firmicutes (2.4%), unclassified (2.1%), Chlamydiae (1.5%) and Bacteroidetes (1.2%). The Proteobacteria and Synergistetes were commonly detected in AQS and control tests, which can hydrolyze proteins, lipids and polysaccharides.48 In addition, Synergistetes can produce energy by oxidizing VFAs to H2 and CO2,49 and thus, the predominance of Synergistetes strongly suggested that syntrophic metabolism was highly activated in TPBR. Previous study noted that Planctomycetes favored low organic loading rates with absence of light,50,51 however, this study still detected Planctomycetes as dominant bacterium (10.5%) in AQS-supplemented TPBR, which had high organic loading rate and with light radiation. This study is the first observation that Planctomycetes emerged as the dominant phylum in APB process. Their predominance in this study suggests that they were selectively enriched by AQS addition and had an important function related to nitrogen removal.

Table 6 Relative abundance of the main phyla and genera identified in the sludge in the absence and presence of AQS. Only phyla and genera with a relative abundance greater than 1.0% were shown
Phylum Control (%) AQS (%) Genus Control (%) AQS (%)
Proteobacteria 92.7 70.9 Comamonas 75.3 1.7
Planctomycetes 0.3 1.5 Rhodopseudomonas 0.2 21.7
Synergistetes 4.8 1.2 Acinetobacter 0 17.3
Firmicutes 0.8 9.5 Planctomyces 0.1 8.5
Unclassified 0.4 10.5 Cloacibacillus 0.6 8.0
Chlamydiae 0 2.4 Brevundimonas 0.2 5.3
Bacteroidetes 0.5 2.1 Alcaligenes 0.1 5.3
      Unclassified 0.8 4.6
      Rhodovulum 3.2 0.3
      Rhizobium 0 2.7
      Ectothiorhodospira 2.5 0.1
      Pusillimonas 2.5 0.96
      Dethiosulfovibrio 2.2 0
      Pseudomonas 1.9 0.4
      Desulfonatronum 1.8 0
      Aminobacterium 1.7 1.4
      Blastochloris 0.1 1.2


At the genus level, the sludge from the TPBR exhibited relative abundances for the Comamonas (75.2%), Rhodovulum (3.2%), Ectothiorhodospira (2.5%), Pusillimonas (2.5%), Dethiosulfovibrio (2.2%), Pseudomonas (1.9%), Desulfonatronum (1.8%) and Aminobacterium (1.7%) in control test. Comamonas was able to utilize a wide range of substrates including xenobiotics under anaerobic conditions,52 which possibly took responsibility for degrading complex organics from kitchen waste. High abundance of Comamonas in food waste compost had also been reported by Young et al.53 It was shown that the dominate APB were Rhodovulum and Ectothiorhodospira, belonging to purple non-sulfur bacteria and purple sulfur bacteria, respectively. Both of these genera could degrade VFAs and tolerate toxic sulfide.54 Dethiosulfovibrio and Desulfonatronum were enriched in the TPBR without AQS, being capable of reducing thiosulfate/sulfate to sulfide.55

In presence of AQS, the abundant genera are Rhodopseudomonas (21.7%), Acinetobacter (17.3%), Planctomyces (8.5%), Cloacibacillus (8.0%), Brevundimonas (5.3%), Alcaligenes (5.3%), unclassified (4.6%), Rhizobium (2.7%), Comamonas (1.7%), Aminobacterium (1.4%), and Blastochloris (1.2%). Among them, abundances of Comamonas were obviously reduced (from 75.2% to 1.7%) compared with that of AQS test, indicating an effective inhibition by AQS. Rhodopseudomonas and Blastochloris, belonging to purple non-sulfur bacteria, were considered as the major photosynthetic bacteria in AQS test. But they were not observed in control test, which gave merit to use AQS to promote selective growth of purple non-sulfur bacteria. Both of these genera were supposed to be among the most metabolically versatile bacteria known, which can use various VFAs as electron donors for growth in anaerobic light conditions.34 In addition, purple non-sulfur bacteria had higher crude protein than other types of bacteria.36,41 Thus, both of these genera might contribute VFAs removal and crude protein production in AQS test. Moreover, it was interested to find that the Planctomyces was higher despite the high COD concentration in the acidifying kitchen waste and strong illumination (2000 lux). Previous studies have indicated that many species of Planctomyces are able to oxidize ammonium with nitrite as the electron acceptor, which are responsible for the simultaneous removal of ammonia and nitrite under anaerobic conditions.56 Therefore, it is likely that this genus in the present research could remove considerable amounts of nitrogen from the TPBR with AQS addition. There were some other genera that related to the degradation of proteins or amino acids, such as Aminobacterium and Cloacibacillus.57 The appearance of these genera may be related to the organic nitrogen transformed and removed in the TPBR. There were still some bacteria whose roles could not be well explained (such as Rhizobium); further research will be needed to clarify the roles of these microorganisms.

4. Conclusions

Two-phase anaerobic fermentation system, including CSTR and TBPR processes, aimed to convert abundant carbon sources in kitchen waste to valuable biomass. In CSTR process, the SCOD and VFAs respectively reached 75.26 g L−1 and 14.2 g L−1 within 72 h. In addition, AQS was added to vanquish the inhibition of sulfate in acidified kitchen waste on APB, and the VFAs degradation and biomass yield were both enhanced by 144% and 120% than those of control test. The pyrosequencing results also noted that AQS effectively suppressed the growth of SRB and elevated purple non-sulfur bacteria in TPBR.

Acknowledgements

This study was supported by the National Natural Science Foundation of China (No. 51008025, 51478040, 51478452), and Outstanding Talent Plan of Fudan University (JJH1829029), and Key Laboratory of Reservoir Aquatic Environment, Chinese Academy of Science (No. RAE2014CB05B).

References

  1. E. U. Kiran, A. P. Trzcinski, W. J. Ng and Y. Liu, Fuel, 2014, 134, 389–399 CrossRef.
  2. N. Mirabella, V. Castellani and S. Sala, J. Cleaner Prod., 2014, 65, 28–41 CrossRef.
  3. M. Melikoglu, C. S. K. Lin and C. Webb, Cent. Eur. J. Eng., 2013, 3, 157–164 CAS.
  4. M. Lee, T. Hidaka, W. Hagiwara and H. Tsuno, Bioresour. Technol., 2009, 100, 578–585 CrossRef CAS PubMed.
  5. D. Z. Sousa, A. F. Salvador, J. Ramos, A. P. Guedes, S. Barbosa, A. J. M. Stams, M. M. Alves and M. A. Pereira, Appl. Environ. Microbiol., 2013, 79, 4239–4245 CrossRef CAS PubMed.
  6. R. Chandra, J. A. Modestra and S. V. Mohan, Fuel, 2015, 160, 502–512 CrossRef CAS.
  7. M. T. Madigan, Photosynth. Res., 2003, 76, 157–171 CrossRef CAS PubMed.
  8. Y. T. Chen, S. C. Wu and C. M. Lee, Int. J. Hydrogen Energy, 2012, 37, 13887–13894 CrossRef CAS.
  9. N. Kornochalert, D. Kantachote, S. Chaiprapat and S. Techkarnjanaruk, Ann. Microbiol., 2014, 64, 1021–1032 CrossRef CAS.
  10. J. Wu, Y. M. Wang and X. G. Lin, PLoS One, 2013, 8, 67644–67649 Search PubMed.
  11. W. T. Wong, C. H. Tseng, S. H. Hsu, H. S. Lur, C. W. Mo, C. N. Huang, S. C. Hsu, K. T. Lee and C. T. Liu, Microbes Environ., 2014, 29, 303–313 CrossRef PubMed.
  12. N. Mekjinda and R. J. Ritchie, Waste Manage., 2015, 35, 199–206 CrossRef CAS PubMed.
  13. M. Xu, W. M. Wu, L. Wu, Z. He, J. D. Van Nostrand, Y. Deng, J. Luo, J. Carley, M. Ginder-Vogel, T. J. Gentry, B. Gu, D. Watson, P. M. Jardine, T. L. Marsh, J. M. Tiedje, T. Hazen, C. S. Criddle and J. Zhou, ISME J., 2010, 4, 1060–1070 CrossRef PubMed.
  14. I. Maeda, T. Mizoguchi, Y. Miura, K. Yagi, N. Shioji and H. Miyasaka, Curr. Microbiol., 2000, 40, 210–213 CrossRef CAS PubMed.
  15. K. Schneider, A. Muller, A. U. Schramm and W. Klipp, Eur. J. Biochem., 1991, 195, 653–661 CrossRef CAS PubMed.
  16. T. V. Laurinavichene, K. S. Laurinavichius, B. F. Belokopytov, D. K. Laurinavichyute, A. A. Tsygankov and A. A. Tsygankov, Int. J. Hydrogen Energy, 2013, 38, 5545–5554 CrossRef CAS.
  17. F. J. Cervantes, C. M. Martínez, J. Gonzalez-Estrella, A. Márquez and S. Arriaga, Appl. Microbiol. Biotechnol., 2013, 97, 2671–2679 CrossRef CAS PubMed.
  18. J. A. Smith, K. P. Nevin and D. R. Lovley, Front. Microbiol., 2015, 6, 121–128 Search PubMed.
  19. L. Li, J. Wang, J. Zhou, F. Yang, C. Jin, Y. Qu, A. Li and L. Zhang, Bioresour. Technol., 2008, 99, 6908–6916 CrossRef CAS PubMed.
  20. F. Aulenta, V. D. Maio, T. Ferri and M. Majone, Bioresour. Technol., 2010, 101, 9728–9733 CrossRef CAS PubMed.
  21. N. Ooi, E. A. Eady, J. H. Cove and A. J. O'Neill, J. Antimicrob. Chemother., 2015, 70, 479–488 CrossRef CAS PubMed.
  22. J. B. Shyu, D. P. Lies and D. K. Newman, J. Bacteriol., 2002, 184, 1806–1810 CrossRef CAS PubMed.
  23. X. Z. Wang, X. Cheng, D. Z. Sun, Y. W. Ren and G. H. Xu, J. Chem. Technol. Biotechnol., 2014, 89, 1545–1552 CrossRef CAS.
  24. X. Z. Wang, K. J. Xie, X. Cheng, Y. W. Ren and C. L. Wan, Environ. Sci.: Water Res. Technol., 2015, 1, 383–393 CAS.
  25. S. S. Nielsen, The measurement of lipids, in Food Analysis, China Light Industry Press, Beijing, 2002 Search PubMed.
  26. T. V. Laurinavichene, K. S. Laurinavichius, B. F. Belokopytov, D. K. Laurinavichyute, A. A. Tsygankov and A. A. Tsygankov, Int. J. Hydrogen Energy, 2012, 38, 5545–5554 CrossRef.
  27. APHA, Standard Methods for the Examination of Water and Wastewater, American Public Health Association, Washington, DC, 1998, pp. 45–72 Search PubMed.
  28. R. Rajagopal, A. Ahamed and J. Y. Wang, Bioresour. Technol., 2014, 167, 564–568 CrossRef CAS PubMed.
  29. H. Junicke, M. C. van Loosdrecht and R. Kleerebezem, Appl. Microbiol. Biotechnol., 2015, 9, 1–11 Search PubMed.
  30. B. K. Ahring and P. Westermann, Appl. Environ. Microbiol., 1988, 54, 2393–2397 CAS.
  31. L. Neves, R. Goncalo, R. Oliveira and M. M. Alves, Waste Manage., 2008, 28, 965–972 CrossRef CAS PubMed.
  32. J. D. Browne, E. Allen and J. D. Murphy, Waste Manage., 2013, 33, 2470–2477 CrossRef CAS PubMed.
  33. A. P. Tracinski and D. C. Stuckey, Environ. Eng. Sci., 2012, 29, 848–854 CrossRef.
  34. Y. Oda, F. W. Larimer, P. S. G. Chain, S. Malfatti, M. V. Shin, L. M. Vergez, L. Hauser, M. L. Land, S. Braatsch, J. T. Beatty, D. A. Pelletier, A. L. Schaefer and C. S. Harwood, Proc. Natl. Acad. Sci. U. S. A., 2008, 105, 18543–18548 CrossRef CAS PubMed.
  35. Q. Zhou, P. Zhang and G. B. Zhang, Bioresour. Technol., 2015, 179, 505–509 CrossRef CAS PubMed.
  36. T. Hülsen, D. J. Batstone and J. Keller, Water Res., 2014, 50, 18–26 CrossRef PubMed.
  37. P. Prachanurak, C. Chiemchaisri, W. Chiemchaisri and K. Yamamotob, Bioresour. Technol., 2014, 165, 129–136 CrossRef CAS PubMed.
  38. D. Kantachote, S. Torpee and K. Umsakul, Electron. J. Biotechnol., 2005, 8, 314–323 CrossRef CAS.
  39. E. I. Madukasi, H. Chunhua and G. Zhang, Int. J. Environ. Sci. Technol., 2011, 8, 513–522 CrossRef CAS.
  40. S. Chitapornpan, C. Chiemchaisri, W. Chiemchaisri, R. Honda and K. Yamamoto, Bioresour. Technol., 2013, 141, 65–74 CrossRef CAS PubMed.
  41. S. Chitapornpan, C. Chiemchaisri, W. Chiemchaisri, R. Honda and K. Yamamoto, Water Sci. Technol., 2012, 65, 504–512 CrossRef CAS PubMed.
  42. I. Maeda, Y. Miura, K. Yagi, N. Shioji and H. Miyasaka, Curr. Microbiol., 2000, 40, 210–213 CrossRef CAS PubMed.
  43. C. M. Lee, P. C. Chen, C. C. Wang and Y. C. Tung, Int. J. Hydrogen Energy, 2002, 27, 1309–1313 CrossRef CAS.
  44. M. K. Kim, K. M. Choi, C. R. Yin, K. Y. Lee, W. T. Im, J. H. Lim and S. T. Lee, Biotechnol. Lett., 2004, 26, 819–822 CrossRef CAS PubMed.
  45. B. S. McSwain, R. L. Irvine, M. Hausner and P. A. Wilderer, Appl. Environ. Microbiol., 2005, 71, 1051–1057 CrossRef CAS PubMed.
  46. D. Gapes, B. M. Wilén and J. Keller, Water Sci. Technol., 2004, 50, 203–212 CAS.
  47. F. J. Cervantes, C. H. Gutierrez, K. Y. López, M. I. Estrada-Alvarado, E. R. Meza-Escalante, A. C. Texier, F. Cuervo and J. Gomez, Biodegradation, 2008, 19, 235–246 CrossRef CAS PubMed.
  48. C. Sundberg, W. A. Al-Soud, M. Larsson, E. Alm, S. S. Yekta, B. H. Svensson, B. H. Sørensen and A. Karlsson, FEMS Microbiol. Ecol., 2013, 85, 612–626 CrossRef CAS PubMed.
  49. T. Ito, K. Yoshiguchi, H. D. Ariesyady and S. Okabe, ISME J., 2011, 5, 1844–1856 CrossRef PubMed.
  50. A. D. Pereira, C. D. Leal, M. F. Dias, C. Etchebehere, C. A. Chernicharo and J. C. de Araújo, Bioresour. Technol., 2014, 166, 103–111 CrossRef PubMed.
  51. R. C. Jin, G. F. Yang, J. J. Yu and P. Zheng, Chem. Eng. J., 2012, 197, 67–79 CrossRef.
  52. X. Peng, Z. Zhang, W. Luo and X. Jia, Bioresour. Technol., 2013, 128, 173–179 CrossRef CAS PubMed.
  53. C. C. Young, J. H. Chou, A. B. Arun, W. S. Yen, S. Y. Sheu, F. T. Shen, W. A. Lai, P. D. Rekha and W. M. Chen, Int. J. Syst. Evol. Microbiol., 2008, 58, 251–256 CrossRef CAS PubMed.
  54. W. Ghosh and B. Dam, FEMS Microbiol. Rev., 2009, 233, 999–1043 CrossRef PubMed.
  55. J. P. Amend and E. L. Shock, FEMS Microbiol. Rev., 2001, 25, 175–243 CrossRef CAS PubMed.
  56. Y. Tal, J. E. Watts, S. B. Schreier, K. R. Sowers and H. J. Schreier, Aquaculture, 2003, 215, 187–202 CrossRef CAS.
  57. J. Li, J. Rui, Z. Pei, X. Sun, S. Zhang, Z. Yan, Y. Wang, X. Liu, T. Zheng and X. Li, Appl. Microbiol. Biotechnol., 2014, 98, 4771–4780 CrossRef CAS PubMed.

Footnote

Electronic supplementary information (ESI) available. See DOI: 10.1039/c5ra18240a

This journal is © The Royal Society of Chemistry 2016
Click here to see how this site uses Cookies. View our privacy policy here.