Phenyl-guanidine derivatives as potential therapeutic agents for glioblastoma multiforme: catalytic syntheses, cytotoxic effects and DNA affinity

I. Bravoa, C. Alonso-Moreno*b, I. Posadas*c, J. Albaladejod, F. Carrillo-Hermosillae, V. Ceñaf, A. Garzóna, I. López-Solerae and L. Romero-Castilloc
aDepartamento de Química-Física, Universidad de Castilla-La Mancha, Facultad de Farmacia, Campus Universitario de Albacete, 02071-Albacete, Spain
bDepartamento de Química Inorgánica, Orgánica y Bioquímica, Universidad de Castilla-La Mancha, Facultad de Farmacia, Campus Universitario de Albacete, 02071-Albacete, Spain
cUnidad Asociada Neurodeath CSIC-UCLM, Departamento de Ciencias Médicas, Facultad de Farmacia, Universidad de Castilla-La Mancha, Campus Universitario de Albacete, 02071-Albacete, Spain
dDepartamento de Química-Física, Universidad de Castilla-La Mancha, Facultad de Ciencias y Tecnologías Químicas, Campus Universitario de Ciudad Real, 13071-Ciudad Real, Spain
eDepartamento de Química Inorgánica, Orgánica y Bioquímica, Universidad de Castilla-La Mancha, Facultad de Ciencias y Tecnologías Químicas, Campus Universitario de Ciudad Real, 13071-Ciudad Real, Spain
fUnidad Asociada Neurodeath CSIC-UCLM, Departamento de Ciencias Médicas, Facultad de Medicina, Universidad de Castilla-La Mancha, Campus Universitario de Albacete, 02071-Albacete, Spain

Received 3rd September 2015 , Accepted 7th January 2016

First published on 11th January 2016


Abstract

Glioblastoma is a highly malignant form of brain tumor. Current treatment with surgery, temozolomide (TMZ), and radiotherapy only leads to a modest median survival. There is clearly an unmet clinical need for new treatments that are able to arrest the rapid development of the disease through new drugs with antiproliferative activity on glioblastoma cells. In the work described here, several substituted phenyl-guanidine derivatives were developed for application in glioblastoma treatment. The compounds were synthesized by catalytic guanylation reactions and they were fully characterized and assessed for their affinity for DNA by UV titrations and fluorescent intercalator displacement assays. The cytotoxicity levels of the compounds were investigated in the C6 rat glioblastoma cell line by MTT, LDH, and BrdU proliferation assays. Some of the phenyl-guanidine derivatives displayed interesting antitumoral profiles, with a higher potency than the standard drug TMZ in reducing glioblastoma cell proliferation.

Introduction

Guanidines have become fundamental entities in medicinal chemistry since the guanidine moiety, characterized by the general formula R1–N[double bond, length as m-dash]C(NR2R3)(NR4R5), is an essential substructure in many molecules of biological importance, such as arginine, creatine phosphates, and purines.1

Over the years, we have witnessed many new achievements in the synthesis of guanidine-containing molecules2 with diverse chemical, biochemical, and pharmacological properties.3 Multi-step and stoichiometric reactions are a recurrent methodology to obtain molecules based on a guanidine core.4 However, this ‘classical synthesis’ suffers from several drawbacks such as poor availability of the amine precursors, low yields for a comprehensive array of substrates, the use and production of undesirable substances, and the use of expensive starting materials.2 Catalytic reactions are emerging as a potential and efficient alternative for the synthesis of these systems.2 A search for catalysts that are applicable to a wide range of substrates, with the ultimate goal of obtaining targeted guanidines with specific applications or complementary properties, is a continuing trend.2,5

The structural features of these entities mean that some guanidine derivatives are actually top selling pharmaceuticals (see some representative examples in Fig. 1), e.g., rosuvastatin is used to treat high cholesterol and prevent cardiovascular disease,6 guanabenz is used clinically as an antihypertensive,7 cimetidine is used to treat peptic ulcers,8 and zanamivir is the first neuraminidase inhibitor to be commercially developed.9


image file: c5ra17920c-f1.tif
Fig. 1 Examples of guanidines as fragments within drug molecules. (a) Famotidine, a histamine H2-receptor antagonist that inhibits stomach acid production. (b) Rosuvastatin, prescribed for lowering cholesterol and triglyceride levels and prevention of heart attacks; (c) metformin, an antidiabetic medication; (d) MGBG, an antitumoral agent in clinical trials with significant activity in patients with chemotherapy-refractory Hodgkin's and non-Hodgkin's lymphoma; (e) imatinib, a kinase inhibitor drug used to treat certain types of leukemia and gastrointestinal stromal tumors.

Guanidine-containing molecules have also been reported to have anticancer activity (see some representative examples in Fig. 1),3 e.g., the tyrosine kinase inhibitor imatinib10 and the mitochondrial function inhibitors MIBG and MGBG,11 which have been the subject of intensive preclinical and clinical evaluation. Other guanidinium derivatives have been shown to have DNA-binding properties and are intercalative drugs12 and minor groove binders,13 resulting in an antiproliferative effect in a variety of tumor cell lines. As a representative example, metformin, a guanidine derivative found in Galega officinalis and commonly used to treat diabetes mellitus, has recently been reported to have anticancer properties that affect the survival of glioblastoma cells.14 Similarly a series of novel phenyl-guanidine derivatives have recently been patented as agents for the treatment of aggressive tumors, including glioblastoma.15

DNA-damaging compounds are the most widely used anticancer drugs. Small synthetic molecules, which can be easily transported inside the cell and are able to interact with DNA, have been widely investigated and used clinically as antitumor agents.16 Drugs can interact with the double helical structure of DNA through covalent interactions, e.g., platinum-based drugs17 or temozolomide (TMZ),18 or noncovalent interactions. There are three noncovalent DNA-binders: groove binders such as pentamidine, which is clinically used to treat sleeping sickness and pneumonia in patients with HIV infection,19 intercalators such as doxorubicin, which is commonly used in the treatment of a wide range of cancers,20 and external binders that interact with the hard oxygen-rich polyanionic surface of the DNA sugar-phosphate backbone.21

Due to their high pKa values, guanidine derivatives exist in their protonated form over a wide pH range. It is claimed that the Y-shaped CN3 functional group is responsible for the stability of the cationic derivative (guanidinium) as resonance stabilization of the molecule spreads the positive charge evenly over the three nitrogen atoms.22 Therefore, noncovalent DNA binding via electrostatic attraction and hydrogen bond donation at physiological temperature and pH might be expected.

The aim of the work described here was to screen phenyl-guanidine derivatives, obtained by a 100% atom-economical methodology, as therapeutic agents for glioblastoma multiforme (GBM). Among all the tumoral cells, the glioma cell line C6 was selected as an in vitro model for glioblastoma. The physico-chemical properties of guanidines led to the choice of DNA as a potential target to shed light on the mechanism of the cytotoxic activity of the target compounds.

Results and discussion

Synthesis and characterization

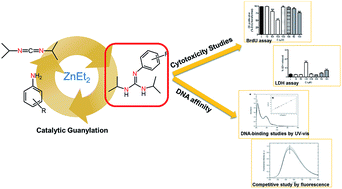
Carbon–nitrogen bonds are amongst the most important bonds in organic chemistry and life sciences. Of the available methodologies to obtain this kind of bond, reactions involving palladium and copper complexes are the most widely used. Alternatively, the hydrofunctionalization reaction provides 100% atom efficiency and a waste-free process with a relatively low-cost and ubiquitous starting materials. The growing cost and recognized toxicity of many commonly used metal catalysts are the driving forces behind the development of alternative methods. In this respect, the use of zinc compounds could be of great interest due to their abundance, biological tolerance, and distinct reactivity capacities. In the last few years, we have reported the use of cost-effective and commercially available ZnEt2 as a very effective catalyst for the addition of primary and secondary aromatic amines, including aromatic diamines, aliphatic, heterocyclic, and secondary cyclic amines, to carbodiimides under milder conditions.23 Phenyl-guanidines with different benzene ring substitution patterns were chosen to evaluate their in vitro anticancer activity (Scheme 1). Compounds 1–14 were accessible by a catalytic method (Scheme 2).
image file: c5ra17920c-s1.tif
Scheme 1 Synthesis of guanidines 1–14.

Compounds 1, 2, 6–8, and 10–12 were reported previously24 and compounds 3–5, 9 and 13–14 were obtained, on a Schlenk-tube scale and after an appropriate work-up, as white solids in high yields. The new guanidines were characterized by 1H-NMR and 13C-NMR spectroscopy (see Fig. S3 in ESI) and by elemental analysis (see Experimental section). The molecular structures of compounds 1–14 were confirmed by X-ray diffraction studies on compound 13 as a representative example (see ORTEP view in Fig. 2 and crystallographic data in Table S1 in the ESI). The bond lengths in the ‘CN3’ moiety indicate that there is some charge delocalization, although the N1–C11 bond length of 1.398(4) Å is slightly shorter than N2–C2 and N3–C5 [1.465(4) and 1.453(4) Å, respectively], which implies a greater double bond character. The bond lengths and angles are summarized in the ESI (Table S2). The crystal is stabilized by hydrogen bonding, with N1 involved in an intermolecular bifurcated hydrogen bond with N2–H2 and N3–H3 [N2–H2⋯N1 2.40 Å, N2⋯N1 3.067(5) Å, N2–H2⋯N1 134.2°; N3–H3⋯N1 2.29 Å, N3⋯N1 2.990(5) Å, N2–H2⋯N1 135.6°] (Fig. 2).


image file: c5ra17920c-f2.tif
Fig. 2 ORTEP drawing of 3,5-(trifluoromethyl)-2,3-diisopropylguanidine 13. Selected bond lengths [Å] and angles [deg]: N1–C1 1.316(4), N2–C1 1.344(4), N3–C1 1.364(4), N1–C1–N2 119.2(3), N2–C1–N3 114.9(3), N1–C1–N3 125.8(3).

image file: c5ra17920c-s2.tif
Scheme 2 Proposed mechanism for the catalytic synthesis of compounds 1–14.

Cytotoxicity studies

In an initial approach, the effects of compounds 1–14 on mitochondrial function and cell viability were investigated by determining the percentage of 3-(4,5-dimethylthiazol-2-yl)-2,5-diphenyltetrazolium bromide (MTT) transformed (% MTT transformed). Current therapy of GBM includes surgical intervention, radiotherapy and chemotherapy with TMZ. Therefore, TMZ, the most potent chemotherapy drug against GBM used in clinic, was chosen as a reference standard. MTT is metabolized at the mitochondrial level by viable and metabolically active cells to give an insoluble coloured formazan product.25 Insults that alter the metabolism of the cells will probably affect the rate of MTT reduction into formazan. Thus, the reduction in the percentage of MTT transformed correlates with a reduction of the general metabolism and it has been extensively used as an index of cellular viability.26 Glioblastoma C6 cells were treated with vehicle, compounds 1–14 (100 μM) or TMZ (100 μM) for 72 h and the percentage of MTT transformed, as an index of cytotoxicity, was determined (Table 1). Among the fourteen compounds tested, compounds 6–10 and 12–14 significantly reduced the % MTT transformed at a concentration of 100 μM. Interestingly, compounds 8, 9, and 12 reduced the cellular viability with higher potency than the reference compound TMZ. In particular, whereas compound 9 showed an IC50 value close to 100 μM, compound 12 was more than 5-times more active than TMZ and the highest potency was shown by compound 8, which had an IC50 value that was 16-times lower than that of TMZ. IC50 values that were out of the concentration range used for the experiments were not determined (100 μM), except for TMZ as the reference compound.
Table 1 % MTT transformed and IC50 values in rat C6 glioblastoma cells
Compound R Position of substituent % MTT transf. (100 μm) IC50 (μM)
1 H   92.69 ± 2.48 >100
2 F 2 99.75 ± 0.19 >100
3 CF3 2 94.21 ± 5.88 >100
4 F 3 100.00 ± 0.00 >100
5 Br 3 100.00 ± 0.00 >100
6 Cl 4 59.91 ± 1.45 >100
7 Br 4 81.45 ± 2.00 >100
8 tBu 4 35.48 ± 5.02 22.7
9 CF3 4 44.21 ± 2.37 94.5
10 CN 4 69.75 ± 2.35 >100
11 OMe 4 98.64 ± 0.79 >100
12 iPr 2, 6 14.47 ± 2.35 66.8
13 CF3 3, 5 62.37 ± 2.58 >100
14 Me 3, 5 83.26 ± 1.58 >100
TMZ 60.03 ± 2.10 352.3


Although the MTT assay was used to determine cell toxicity, the reduction in the % MTT transformed does not necessarily correlate with cell death since such a reduction can be observed not only when a population of cells die, but also when it enters into cell cycle arrest. For this reason, the activity of LDH released to the culture medium, as an index of cellular death, and the percentage of 5-bromo-2′-deoxyuridine (BrdU) incorporated by the cells, as an index of cell proliferation were determined to characterize further the effect of compounds 8, 9, and 12 on cell viability.

Quantification of lactate dehydrogenase (LDH) activity is a well-established method to determine cellular mortality. LDH is an intracellular enzyme that localizes at cytosol and its presence in the extracellular media surrounding cells is considered to be an indicator of loss of cell membrane integrity and, subsequently, as an index of cell death.27 After an incubation period of 72 h, only compound 8 and TMZ led to a significant increase in the percentage of LDH released to the culture medium. In agreement with MTT results, compound 8 proved to be more effective than the standard compound TMZ in inducing glioblastoma cell death (Fig. 3a), but this effect was only observed at a concentration of 100 μM with both compounds.


image file: c5ra17920c-f3.tif
Fig. 3 (a) Effect of vehicle (V), compounds 8 (C8), compound 9 (C9), compound 12 (C12), and the first line drug temozolomide (TMZ) (gray) on rat glioblastoma C6 viability. The percentage of LDH released to the culture medium has been determined as an index of cell death. (b) Effect of vehicle (V), compounds 8 (C8), compound 9 (C9), compound 12 (C12), and the first line drug temozolomide (TMZ) (gray) on rat C6 glioblastoma cell proliferation determined by BrdU assay. Data are expressed as mean ± s.e.m. from at least three independent experiments. *p < 0.01; ***p < 0.001 compared to vehicle-treated group.

The effect of compounds 8, 9, 12, and TMZ on cell proliferation was determined by quantification of the amount of 5-bromo-2′-deoxyuridine (BrdU), an analog of thymidine, incorporated into the DNA of dividing cells during the S-phase of the cell cycle (see Experimental section).28 Compound 8 and TMZ were the two compounds that significantly inhibited glioblastoma cell proliferation. Interestingly, compound 8 reduced glioblastoma proliferation in a concentration-dependent manner and displayed a higher potency than TMZ (Fig. 3b). At 100 μM compound 8 inhibited the proliferation of 50% of the cell population whereas TMZ at the same concentration only achieved a reduction of 25%. However, despite guanidines 8, 9 and 12 showed a significant activity in C6, it is not a guarantee of the overcoming the blood–brain barrier.

On considering our results as a whole, it can be seen that compound 8 displays a very interesting profile as a potential antitumoral for the treatment of glioblastoma through a mechanism that involves cell cycle arrest and glioblastoma cell death. More interestingly, the potency displayed by compound 8 is higher than that of TMZ, the reference compound that is used clinically. In addition, the molecular mechanism of compound 8 could be related to its interaction with DNA since the S-phase corresponds to the part of the cell cycle in which DNA replication occurs.29 For this reason, further experiments were conducted to determine the interaction of the guanidine compounds with DNA.

DNA affinity studies

UV-visible and fluorescence spectroscopy are amongst the most widely employed techniques for assessing and measuring non-covalent binding interactions between drugs and DNA.30 In general terms, changes observed in the UV spectra upon titration may provide evidence to elucidate the existing interaction mode, and fluorescence quenching experiments can provide additional information concerning the localization of the drugs and also their mode of interaction with DNA.
DNA-binding studies by UV spectroscopy. Increasing aliquots of salmon sperm DNA were added to guanidine solutions and the UV spectra were recorded. Compounds binding with DNA through intercalation are characterized by a strong hypochromic effect (∼70%), a large red shift (∼10 nm), and a well-defined isosbestic point.12 However, only small changes in the UV spectrum are observed with groove-binding drugs. These molecules show a small hypochromic effect and a slight red shift when the titration is carried out on natural DNA.31 On the other hand, external binders display a hyperchromic effect and a very slight blue shift of the absorption band.21b

Guanidines 1–14 present two main bands, one intense band in the range 200–220 and another centered around ∼240 nm of moderate intensity; a relatively low intensity band appears at ∼280 nm as a shoulder (see Fig. 4 and S1 in ESI). The two main bands can be assigned to the aromatic phenyl ring π → π* transition along with N[double bond, length as m-dash]N and C[double bond, length as m-dash]N based π → π* transitions.32 The UV spectrum of guanidine 13 in the presence of DNA is shown in Fig. 3a as a representative example. The intensity of the bands steadily decreased with increasing DNA concentration. The bands centered at ∼206 nm for the derivatives, in the presence of increasing amounts of DNA, showed a slight hypochromic effect accompanied by a bathochromic shift of ∼2 nm. Isosbestic points were not observed in the titrations. The hypochromic effect observed for compounds 1–14 indicates the disappearance of the free molecule, whereas the red shift can be attributed to the formation of a new DNA-compound species.


image file: c5ra17920c-f4.tif
Fig. 4 (a) Changes in the UV spectrum of 13 during the titration with salmon sperm DNA at 300 K. The concentration of guanidine 13 was fixed at 50.8 μM while DNA was increased (from top to bottom 0 – 180 μM). (b) Plot of A0/(A0A) versus 1/[DNA] for the titration of 13 with sperm DNA.

Based on the variation in absorbance, the magnitude of the binding strength with DNA of some representative guanidines with different substitution patterns was evaluated by calculation of the corresponding binding constants using the Benesi–Hildebrand equation (Table 2). As an illustrative example of these DNA-binding studies by UV spectroscopy, a plot of A0/A0A versus 1/[DNA] for guanidine 13 is shown in Fig. 4b and Kb is obtained by the ratio of the intercept to the slope (see binding studies in the ESI for some more representative compounds of this family of phenyl-guanidines).

Table 2 Binding constant (±2σ) for the interaction of representative guanidines with DNA
Compound Kb (×104) M−1
1 6.11 ± 0.54
2 0.90 ± 0.10
5 3.50 ± 0.12
7 0.67 ± 0.11
8 5.13 ± 0.49
12 1.55 ± 0.11
13 6.65 ± 0.84
14 6.23 ± 0.49


Competitive study with ethidium bromide by fluorescence spectroscopy. It is worth noting that the exact mode of interaction with DNA cannot be elucidated by UV spectroscopic studies alone and other techniques, such as fluorescence spectroscopy, should also be used in order to reach a better conclusion. Compounds 1 (low cytotoxicity), 13 (moderate cytotoxicity), and 8 (high cytotoxicity) were chosen for competitive studies as representative examples of this family. Such compounds do not show fluorescence at room temperature in solution or in the presence of DNA, and their binding to DNA cannot be directly predicted by the emission spectra. However, competitive ethidium bromide (EB) binding studies could be carried out to examine the binding of each compound with DNA.

The emission spectrum of EB binding to DNA in the presence of compound 13 is shown in Fig. 5a as a representative example (see competitive studies for compounds 1 and 8 in Fig. S2 of the ESI). The addition of compound 13 to DNA pretreated with EB caused an appreciable reduction in the emission intensity, indicating the replacement of EB from the DNA structure. The intercalative mode of binding can be discounted as EB–DNA was not completely quenched even when the ratio [guanidine 13]/[DNA] was up to 4.


image file: c5ra17920c-f5.tif
Fig. 5 (a) Changes in the fluorescence spectrum of EB–DNA complex in the presence of different amounts of guanidine 13 at 300 K. The arrow indicates the intensity changes upon increasing the concentration of guanidine 13. (b) Plot of fluorescence intensity decay of EB–DNA versus r (r = [guanidine 13]/[DNA]). Inset: Stern–Volmer plot for the quenching of EB–DNA with guanidine 13. The concentration of guanidinde 13 was varied from 0 to 126 μM; [EB] and [DNA] were fixed at 27.5 and 32.0 μM, respectively. Fluorescence intensity was measured at 622 nm.

Fluorescence quenching can be analyzed by using the Stern–Volmer equation (see Experimental section). A linear increase in F0/F values for the DNA–EB complex was observed on increasing the concentration of compounds up to the point where the aforementioned ratio of 0.5 is reached. Beyond this point the fluorescence intensity reached a plateau and this is typical behavior for a system that has both accessible and inaccessible EB molecules (see Fig. 5b). This linear trend at ratios below 0.5 could represent a single quenching mechanism that could be either static or dynamic.33 Once again, marked differences were not observed between derivatives.

The bimolecular quenching constants (kq) were estimated by applying the Stern–Volmer equation. The ksv values were determined by linear regression of a plot of F0/F against [guanidine], with values of 6.33 ± 0.65 × 10³ M−1, 6.01 ± 0.70 × 10³ M−1, and 6.55 ± 0.80 × 10³ M−1 obtained for compounds 1, 8, and 13, respectively (see Fig. 5b inset as a representative example). The quenching efficiency can be estimated by calculating kq from the equation ksv = kqτ0 and assuming a value for the average lifetime of EB complexed to DNA of 2.3 × 10⁻⁸ s.34

Diffusion-controlled quenching of various quenchers with biopolymers typically results in kq values close to 2 × 10¹⁰ M−1 s−1. Apparent values of kq that are higher than the diffusion-controlled limit usually indicate some type of binding interaction. The estimated bimolecular quenching constants for these compounds are in the order of 3 × 10¹¹ M−1 s−1, which is 15-fold higher than the maximum value possible for diffusion controlled quenching (2 × 10¹⁰ M−1 s−1). This particular observation suggests a quenching that is mainly initiated by a static mechanism; however, a combined dynamic and static mechanism in which the fluorophore can be quenched both by collisions and by complex formation with the same quencher cannot be ruled out.

Mechanistic aspects

On considering the molecular structure of guanidines 1–14 and taking into account the aforementioned structural properties of the noncovalent drugs, the results observed in the UV spectrophotometric titrations, and the inability to displace EB from DNA, guanidine derivatives 1–14 can be ruled out as intercalators. Those drugs that contain guanidinium cations can participate in other types of interactions such as cation–π interactions with aromatic systems present in DNA bases, or ionic interactions with the negatively charged phosphate groups.35 In fact, it is well known that cationic residues of proteins, such as arginine, can interact with DNA through hydrogen bonds with the phosphate oxygen atoms. Guanidinium groups from 1–14 could interact through hydrogen bonding and ionic interactions with the phosphate oxygens in or around the grooves. Furthermore, cation–π complexes formed between the guanidine group and the aromatic systems in the DNA, π–π interactions and hydrophobic forces are also plausible possibilities, since the guanidine units have the appropriate size and shape to fit snugly into the major and minor grooves of DNA.

The results of the spectroscopic binding studies show that each of the guanidines tested displayed a moderate affinity to DNA, with Kb values in the region of 104 M−1.36 The affinities were of the same order of magnitude and encompassed the range from the highest value to the very weakly cytotoxic derivative 1 and the moderate to good cytotoxic derivatives 13–14. A direct relationship between DNA affinity and cytotoxicity values could not be established. The cytotoxicity studies, together with the ability of guanidines to bind DNA, suggest a possible multitarget mechanism for the cytotoxic properties of these compounds.

For a first screening, mono-substituted and di-substituted phenyl-guanidines by alkyl, halogen, and CF3 groups in different positions were designed. Unfortunately, attempts to establish a relationship between structure and activity were unsuccessful.

On the other hand, the variability in the pharmacological profiles observed could be related to the ability of this family of compounds to penetrate biological membranes, which in turn is mainly dependent on lipophilicity factors.37 In order to quantify this observation, calculated logarithmic octanol/water partition coefficients (clog[thin space (1/6-em)]P)38 for 1–14 were obtained using the software Molinsipiration (see Table S3 in ESI).39 The number of substitutions and the increasing size of the substituents on the phenyl ring may explain the observed lipophilicity pattern. A plot of clog[thin space (1/6-em)]P versus % MTTs for compounds 1–14 is shown in Fig. 6. It is not straightforward to identify a direct relationship between cytotoxic activity and the chemical structure of a drug. Numerous factors could be involved in the antitumor activity of these compounds, not only in terms of the physical and chemical properties of the drugs, but also the affinity for the drug target or any plausible interaction with other biomacromolecules. However, a general trend was observed for these derivatives in that a high level of cytotoxicity correlates with higher lipophilicty values. This finding could prove to be useful in subsequent drug designs.


image file: c5ra17920c-f6.tif
Fig. 6 Plot of clog[thin space (1/6-em)]P versus % MTTs for guanidines 1–14.

Conclusions

Drug designers frequently use naturally occurring molecules as starting points in their investigations, with substitution patterns altered to tailor the properties in an effort to make the molecule more effective, more selective, or both. The guanidine group is a key moiety in many compounds of pharmaceutical interest.

Phenyl-guanidines 1–14 were obtained in excellent yields using a catalytic guanylation reaction with 100% atom-economy in a waste-free process from relatively cheap and widely available starting materials. The new guanidine derivatives were fully characterized by 1H and 13C-NMR spectroscopy, elemental analysis, and X-ray diffraction studies.

Phenyl-guanidines 1–14 were tested as therapeutic agents against glioblastoma. For this propose, the C6 rat glioblastoma cell line was chosen for an initial screening by MTTs, LDH, and BrDU cytotoxic assays. Compound 8 presented an interesting antitumor profile in vitro when compared with the reference drug TMZ.

The binding affinity of representative guanidines to a potential target, such as DNA, was assessed by UV titrations and fluorescence quenching. A relationship between DNA affinity and cytotoxic activity could not be established, which indicates that DNA is unlikely to be the primary target. However, a general trend between lipophilicity and activity can be proposed.

Finally, it can be concluded that the results obtained in this work provide a very interesting starting point to develop new guanidine entities with antitumor activity against glioblastoma: (1) the use of catalytic reactions to obtain new molecules that are of potential interest in drug design is a workable proposition, since it provides very high yields for a comprehensive array of substrates, undesirable substances are not produced, and only inexpensive starting materials are required; (2) the characterization by a combination of spectroscopic methods and elemental analysis, supported by X-ray diffraction studies, of representative molecules provides an accurate description of the molecular structure of the new molecules; (3) screening against glioblastoma can easily be carried out by MTTs assays and this enables identification of the best candidates for further cytotoxicity studies; (4) LDH and BrdU assays conducted on the selected molecules provide valuable information to understand their mechanism of action; (5) spectroscopic studies of the interaction between potential drugs and potential targets make a significant contribution to propose further designs.

Experimental section

Synthesis and characterization

General procedures. All reactions were performed using standard Schlenk and glove-box techniques under an atmosphere of dry nitrogen. Solvents were distilled from appropriate drying agents and degassed before use. Microanalyses were carried out on a Perkin-Elmer 2400 CHN analyzer. 1H and 13C NMR spectra were recorded on a Varian Inova FT-500 spectrometer using standard VARIAN-FT software and are referenced to the residual deuterated solvent. New compounds were analyzed by multinuclear 2D (1H–13C HSQC) NMR experiments, which allowed the unambiguous assignment of characteristic resonances. Mass spectroscopic analyses were performed on a Advion expression CMS instrument (electron impact). Guanidines melting points (mp) were determined using a Gallenkamp mp apparatus. Calculated logarithms of the octanol/water partition coefficient (calculated log[thin space (1/6-em)]P) were obtained using Molinsipiration (http://www.molinspiration.com). ZnEt2, amines, and carbodiimides were purchased from Aldrich. Liquid amines were distilled from CaH2.

Synthesis of guanidines 1–14

In a glovebox, a solution of amine (2.00 mmol) in toluene (20 mL) was added to a solution of ZnEt2 in hexanes (0.03 mmol) in a Schlenk tube. The carbodiimide (2.00 mmol) was then added to the above reaction mixture. The Schlenk tube was removed from the glovebox and the reaction was carried out at 50 °C for 2 hours. The solvent was removed under reduced pressure and the residue was extracted with diethyl ether and filtered to give a clear solution. The solvent was removed under vacuum and the residue was recrystallized from ether to provide the solid guanidine.
Structural characterization of {2-(trifluoromethyl)-1,3-diisopropylguanidine} 3. Yield: 0.56 g, 98%. Anal. calcd for C14H20F3N3: C, 58.52; H, 7.02; N, 14.62. Found: C, 58.39; H, 7.15; N, 14.86. 1H NMR (CDCl3, 298 K) δ: 7.49 (d, 1H, H3-Ar), 7.30 (t, 1H, H5-Ar), 6.91 (t, 1H, H4-Ar), 6.80 (d, 1H, H6-Ar), 3.69 (m, 2H, N–CH(CH3)2), 1.07 (d, 12H, 3JHH = 6.4 Hz, N–CH(CH3)2). 13C-{1H} NMR (CDCl3, 298 K) δ: 149.1 (C[double bond, length as m-dash]N), 132.4, 124.9, 120.8 (N–C6H3(CF3)2), 126.8 (N–C6H3(CF3)2), 42.9 (N–CH(CH3)2), 23.2 (N–CH(CH3)2). MS (ESI) (m/z): 288 (71, M + H+). mp = 98–99 °C.
Structural characterization of {3-fluoro-1,3-diisopropylguanidine} 4. Yield: 0.46 g, 98%. Anal. calcd for C13H20FN3: C, 65.79; H, 8.49; N, 17.71. Found: C, 65.69; H, 8.25; N, 17.55. 1H NMR (CDCl3, 298 K) δ: 7.10 (m, 1H, H5-Ar), 6.56 (m, 1H, H4-Ar), 6.54 (d, 1H, H2-Ar), 6.50 (m, 1H, H6-Ar), 3.68 (m, 2H, N–CH(CH3)2), 1.10 (d, 12H, 3JHH = 6.4 Hz, N–CH(CH3)2). 13C-{1H} NMR (CDCl3, 298 K) δ: 150.4 (C[double bond, length as m-dash]N), 130.5, 126.5, 124.3, 122.8, 122.1 (N–C6H3(CF3)2), 43.4 (N–CH(CH3)2), 23.3 (N–CH(CH3)2). MS (ESI) (m/z): 238 (72, M + H+). mp = 120–121 °C.
Structural characterization of {3-bromo-1,3-diisopropylguanidine} 5. Yield: 0.58 g, 98%. Anal. calcd for C13H20BrN3: C, 52.36; H, 6.76; N, 14.09. Found: C, 52.19; H, 6.55; N, 14.32. 1H NMR (CDCl3, 298 K) δ: 7.02 (m, 1H, H2-Ar), 6.97 (m, 1H, H4-Ar), 6.96 (d, 1H, H2-Ar), 6.70 (m, 1H, H6-Ar), 3.67 (m, 2H, N–CH(CH3)2), 1.10 (d, 12H, 3JHH = 6.4 Hz, N–CH(CH3)2). 13C-{1H} NMR (CDCl3, 298 K) δ: 162.5 (C[double bond, length as m-dash]N), 164.49, 130.3, 130.2, 119.0, 110.1 (N–C6H3(CF3)2), 43.8 (N–CH(CH3)2), 23.2 (N–CH(CH3)2). MS (ESI) (m/z): 298 (22, M + H+). mp = 98–99 °C.
Structural characterization of {4-(trifluoromethyl)-1,3-diisopropylguanidine} 9. Yield: 0.56 g, 97%. Anal. calcd for C14H20F3N3: C, 58.52; H, 7.02; N, 14.62. Found: C, 58.60; H, 7.12; N, 14.41. 1H NMR (CDCl3, 298 K) δ: 7.45 (d, 2H, H3-Ar, H5-Ar), 6.90 (d, 2H, H2-Ar, H6-Ar), 3.7 (m, 2H, N–CH(CH3)2), 1.15 (d, 12H, 3JHH = 6.4 Hz, N–CH(CH3)2). 13C-{1H} NMR (CDCl3, 298 K) δ: 154.1 (C[double bond, length as m-dash]N), 150.0, 123.2 (N–C6H3(CF3)2), 126.3 (N–C6H3(CF3)2), 43.4 (N–CH(CH3)2), 23.2 (N–CH(CH3)2). MS (ESI) (m/z): 288 (65, M + H+). mp = 99–100 °C.
Structural characterization of {3,5-(trifluoromethyl)-1,3-diisopropylguanidine} 13. Yield: 0.68 g, 95%. Anal. calcd for C15H19F6N3: C, 50.70; H, 5.39; N, 11.83. Found: C, 50.79; H, 5.24; N, 11.61. 1H NMR (CDCl3, 298 K) δ: 7.30 (s, 1H, H4-Ar), 7.21 (s, 2H, H2-Ar, H6-Ar), 3.7 (m, 2H, N–CH(CH3)2), 1.12 (d, 12H, 3JHH = 6.4 Hz, N–CH(CH3)2). 13C-{1H} NMR (CDCl3, 298 K) δ: 152.2 (C[double bond, length as m-dash]N), 150.6, 124.9, 122.2, 114.1 (N–C6H3(CF3)2), 132.5 (N–C6H3(CF3)2), 43.3 (N–CH(CH3)2), 23.2 (N–CH(CH3)2). MS (ESI) (m/z): 356 (57, M + H+). mp = 95–96 °C.
Structural characterization of {3,5-dimethyl-1,3-diisopropylguanidine} 14. Yield: 0.48 g, 97%. Anal. calcd for C15H25N3: C, 72.83; H, 10.19; N, 16.99. Found: C, 72.72; H, 10.33; N, 16.69. 1H NMR (CDCl3, 298 K) δ: 7.01 (s, 1H, H4-Ar), 6.98 (s, 2H, H2-Ar, H6-Ar), 3.69 (m, 2H, N–CH(CH3)2), 3.02 (m, 2H, NH), 2.17 (s, 3H, (N–C6H3(CH3)2)), 1.08 (d, 12H, 3JHH = 6.4 Hz, N–CH(CH3)2). 13C-{1H} NMR (CDCl3, 298 K) δ: 150.1 (C[double bond, length as m-dash]N), 149.9, 138.6, 122.9, 121.1 (N–C6H3(CH3)2), 43.2 (N–CH(CH3)2), 23.4 (N–CH(CH3)2), 21.3 (N–C6H3(CH3)2). MS (ESI) (m/z): 238 (47, M + H+). mp = 92–93 °C.

X-ray crystallographic structure determination

Data were collected on a Bruker X8 APEX II CCD-based diffractometer, equipped with a graphite monochromated MoKα radiation source (λ = 0.71073 Å). The crystal data, data collection, structural solution, and refinement parameters are summarized in Table S1 in the ESI. Data were integrated using SAINT40 and an absorption correction was performed with the program SADABS.41 The structure was solved by direct methods using the SHELXTL package42 and refined by full-matrix least-squares methods based on F2. All non-hydrogen atoms were refined with anisotropic thermal parameters. Hydrogen atoms were placed using a ‘riding model’ and included in the refinement at calculated positions. F1, F2 and F3 atoms are in disordered positions. Complex 13 crystallizes with a highly disordered toluene molecule as solvent, which was refined with soft restraints and constraints.43

DNA affinity studies

Materials and general procedure. Salmon sperm DNA was obtained from Sigma-Aldrich in 10 g L−1 aliquots and was used without further purification. A stock solution of 640 μM was prepared by dissolving the sample in Milli-Q H2O with PBS-1× buffer and stored at −10 °C. The nucleotide DNA concentration was determined spectrophotometrically using the molar absorptivity ε260 = 6700 M−1 cm−1.44 The ratio A260/A280 for this solution was >1.8, indicating that DNA is sufficiently free of proteins.45 A stock solution of EB was obtained from Sigma Aldrich at 2.5 × 10⁻² M. The stock solutions of the guanidines were prepared by dissolving the powder in ethanol.

DNA-binding studies by UV-vis spectroscopy

Absorbance spectra were recorded on a Cary 100 UV-vis spectrophotometer (Varian) operating at 0.5 nm wavenumber resolution. Titration experiments were performed at constant concentrations of guanidines in the sample cell while varying the DNA concentration in the sample and in the reference cell at 300 K. Stock DNA was added in increasing amounts (0–320 μM) to the sample cell containing 3 mL of a solution of guanidine in PBS-buffer and in the reference cell containing 3 mL of the solution of PBS-buffered (both cells were 1 cm path length quartz cuvettes). The decrease in the absorption at λmax (∼210 nm for all the compounds) was measured after each addition. The binding constants were then determined according to the Benesi–Hildebrand equation:46
image file: c5ra17920c-t1.tif
where K is the binding constant, [DNA] is the DNA concentration, and A are the absorbances of the drug and its complex with DNA, respectively, and εG and εHG are the absorption coefficients of the guanidine and the guanidine–DNA complex, respectively.

For each guanidine three experiments were carried out and the data listed in Table 1 are the average values. Absorbance was measured 15 min after each DNA addition for each titration experiment in order to allow equilibration.

Binding constants were also determined by the Wolfe–Shimmer equation47 and the binding constants obtained by both equations were similar.

Competitive study with ethidium bromide by fluorescence spectroscopy

Fluorescence spectra were collected using an FLS920 fluorescence spectrophotometer (Edinburgh Instruments) equipped with a Xenon flash lamp as light source. A quartz cuvette (Hellma Analytics) of 1 cm was used for the measurements. Temperature was controlled at 300 K by a thermostated cell holder and an FP50-HL (Julabo) circulating water bath. Excitation and emission bandwidths were 3 and 2 nm, respectively, and the equipment operated with a resolution of 1 nm and 3 scans per measurement. The sample cell was excited at 472 nm and fluorescence spectra were recorded in the range 500–830 nm.

The influence of different EB concentrations on the fluorescence intensity of the EB–DNA complex was determined in order to check the saturation ratio r = [EB]/[DNA]. In these experiments 3 mL of PBS-buffered solution of fixed DNA concentration (30 μM) were placed in the sample cell and increasing amounts of EB were added (0–42 μM). The fluorescence intensity of the system increased gradually on addition of EB up to r = 0.8 and changed little thereafter, thus showing that DNA is completely saturated with EB (See ESI).

Competitive binding studies on EB and guanidines 1, 8, and 13 with DNA were carried out by keeping a constant EB–DNA complex concentration in the sample cell (3 mL) while varying the guanidine concentration. The EB–DNA complex was prepared by adding around 32 μM DNA and 27 μM EB in PBS-buffer in order to reach r values within the range 0.8–1. Stock solutions of the guanidines were added to the sample cell in increasing amounts (0–130 μM).

The Stern–Volmer equation was then used to evaluate the quenching constant ksv of the studied guanidines for the EB–DNA–guanidine system:

image file: c5ra17920c-t2.tif
where F0 and F are the emission intensities in the absence and the presence of the quencher, respectively, [Q] is the concentration of the quencher (guanidines 1, 8, and 13), and ksv is the Stern–Volmer constant.32

The decrease in the fluorescence intensity of the EB–DNA complex at λmax (622 nm) was measured after each addition of the guanidine. For each guanidine three experiments were carried out and the reported data are the average values. Fluorescence spectra were always measured 15 min after the addition of guanidines 1, 8, and 13 for each titration experiment in order to allow equilibration.

Cytotoxicity studies

Cell culture. C6 rat glioblastoma cell line was grown in Dulbecco's modified Eagle's medium (DMEM) supplemented with 2 mM L-glutamine, penicillin (20 units permL), streptomycin (5 μg mL−1) and 10% heat-inactivated fetal calf serum as reported previously by Zhang et al.48 Cells were maintained at 37 °C in a saturated humidity atmosphere containing 95% air and 5% CO2.
MTT assay. MTT assays were performed as previously described.49 Briefly, cells were cultured in 24-well culture plates until 80% confluence was reached and then treated with vehicle (DMSO 1‰), or 100 μM of compounds 1–14 or 100 μM TMZ for 72 h. MTT (5 mg mL−1) was subsequently added to each well and the cells were incubated at 37 °C for 1 h. The culture medium was removed and the insoluble formazan crystals were dissolved in 300 μL DMSO (Merck Millipore, Spain) and aliquots of 200 μL were transferred to a 96-well microplate and measured spectrophotometrically in an ELISA reader (Microplate Reader 2001, Bio-Whittaker, USA) at 590 nm.
BrdU assay. Cells were cultured in 24-well culture plates until 80% confluence was reached and then treated with vehicle (DMSO 1‰), or different concentrations of compounds or TMZ for 72 h. Cells were subsequently incubated with 10 μM 5-bromo-2′-deoxyuridine (BrdU) for 2 h and then fixed with methanol (70% in HCl 0.5 M) for 30 min at room temperature. The amount of 5-bromo-2′-deoxyuridine (BrdU) incorporated was determined spectrophotometrically at 405 nm, with a reference wavelength at 490 nm, on a 96-well plate reader using the 5-bromo-2′-deoxyuridine labelling and detection kit III according to the manufacturer's instructions (Roche Diagnostics, USA). The levels of BrdU were determined as an index of cellular division and proliferation was expressed as percentage of BrdU incorporated into culture cells.
LDH assay. Lactic dehydrogenase (LDH) assays were performed as described previously.50 Briefly, cells were cultured in 24-well culture plates until 80% confluence was reached and then treated with vehicle (DMSO 1‰), or different concentrations of compounds or TMZ for 72 h. Lactate dehydrogenase (LDH) activity was measured as an index of cellular death, and mortality was expressed as percentage of LDH released to culture media. Supernatants were collected and cells were washed with PBS and lysed with 0.9% Triton X-100 (v/v) in saline. LDH was measured spectrophotometrically at 490 nm on a 96-well plate reader by using the Cytotox 96 Kit according to the manufacturer's instructions (Promega, Spain).

Acknowledgements

We gratefully acknowledge financial support from the Ministerio de Economía y Competitividad (MINECO), Spain (Grant No. CTQ2011-22578, Grant No. BFU2014-59009-P, and CYTED 214RT0482), and Junta de Comunidades de Castilla-La Mancha (Grant No. PEII11-0220-5740, PEII11-0279-8538 and PPII10-0303-6157).

References

  1. (a) R. G. S. Berlinck, Nat. Prod. Rep., 1999, 16, 339 RSC; (b) R. G. Berlinck, A. E. Trindade-Silva and M. F. Santos, Nat. Prod. Rep., 2012, 29, 1382 RSC.
  2. C. Alonso-Moreno, F. Carrillo-Hermosilla, A. Antiñolo and A. Otero, Chem. Soc. Rev., 2014, 43, 3406 RSC.
  3. S. Ekelund, P. Nygren and R. Larsson, Biochem. Pharmacol., 2001, 61, 1183 CrossRef CAS PubMed.
  4. (a) T. Ishikawa and T. Kumamoto, Synthesis, 2006, 737 CrossRef CAS; (b) T. Ishikawa and T. Kumamoto, Chem. Pharm. Bull., 2010, 58, 1555 CrossRef CAS PubMed.
  5. (a) L. Xu, W.-X. Zhang and Z. Xia, Organometallics, 1787, 34 Search PubMed; (b) W.-X. Zhang, L. Xu and Z. Xia, Chem. Commun., 2015, 51, 254 RSC.
  6. P. P. Toth, Postgrad. Med., 2014, 126, 7 CrossRef PubMed.
  7. D. T. Nash, J. Clin. Pharmacol., 1973, 13, 416 CAS.
  8. N. Scheinfeld, Dermatol. Online J., 2003, 9, 4 Search PubMed.
  9. (a) M. von Itzstein, Nat. Rev. Drug Discovery, 2007, 12, 967 CrossRef PubMed; (b) Y. Hirata, I. Yanagisawa, Y. Ishii, S. Tsukamoto, N. Ito, Y. Isomura and M. Takeda, US Pat., 4.283.408, 1981.
  10. E. Buchdunger, J. Zimmermann, H. Mett, T. Meyer, M. Mueller, B. J. Druker and N. B. Lydon, Cancer Res., 1996, 56, 100 CAS.
  11. (a) L. Troncone and V. Rufini, Anticancer Res., 1997, 17, 1823 CAS; (b) C. Loesberg, H. van Rooij, J. C. Romijm and L. A. Smets, Biochem. Pharmacol., 1991, 42, 793 CrossRef CAS PubMed.
  12. K. Ohara, M. Smietana, A. Restouin, S. M. Mollard, J.-P. Borg, Y. Collette and J.-J. Vasseur, J. Med. Chem., 2007, 50, 6465 CrossRef CAS PubMed.
  13. (a) F. Rodríguez, I. Rozas, M. Kaiser, R. Brun, B. Nguyen, W. D. Wilson, R. N. García and C. Dardonville, J. Med. Chem., 2008, 51, 909 CrossRef PubMed; (b) P. S. Nagle, F. Rodriguez, A. Kahvedzic, S. J. Quinn and I. Rozas, J. Med. Chem., 2009, 52, 7113 CrossRef CAS PubMed; (c) P. S. Nagle, F. Rodriguez, B. Nguyen, W. D. Wilson and I. Rozas, J. Med. Chem., 2012, 55, 4397 CrossRef CAS PubMed.
  14. A. Ucbek, Z. G. Ozünal, O. Uzun and A. Gepdiremen, Exp. Ther. Med., 2014, 7, 1285 CAS.
  15. P. L. Menna, J. Comin, D. E. Gomez and D. F. Alonso, US patent Application Publication, US2014/0228388 A1, 2014.
  16. (a) M. J. Hannon, Chem. Soc. Rev., 2007, 36, 280 RSC; (b) Sequence-specific DNA Binding Agents, ed. M. J. Waring, RSC Publishing, Cambridge, 2006 Search PubMed; (c) Small Molecule DNA and RNA Binders: From Synthesis to Nucleic Acid Complexes, ed. M. Demeunynck, C. Bailly and W. D. Wilson, Wiley-VCH, Weinheim, Germany, 2003 Search PubMed.
  17. (a) Y. W. Jung and S. J. Lippard, Chem. Rev., 2007, 107, 1387 CrossRef CAS PubMed; (b) L. Kelland, Nat. Rev. Cancer, 2007, 7, 573 CrossRef CAS PubMed; (c) Cisplatin. Chemistry and Biochemistry of a Leading Anticancer Drug, ed. P. J. O'Dwyer, J. P. Stevenson, S. W. Johnson and B. Lippert, Wiley-VCH, Weinheim, Germany, 1999 Search PubMed.
  18. S. Kohsaka, K. Takahashi, L. Wang, M. Tanino, T. Kimura, H. Nishihara and S. Tnaka, Cancer Lett., 2013, 331, 68 CrossRef CAS PubMed.
  19. The Antimicrobial drugs, ed. E. M. Scholar and W. B. Pratt, Oxford University Press, Inc, New York, 2000 Search PubMed.
  20. R. Martínez and L. Chacón-García, Curr. Med. Chem., 2005, 12, 127 CrossRef.
  21. (a) J. M. Kelly, A. B. Tossi, D. J. McConnell and C. Oh Uigin, Nucleic Acids Res., 1985, 13, 6017 CrossRef CAS PubMed; (b) G. N. Kalucerovic, R. Paschekea, S. Prashar and S. Gomez-Ruiz, J. Organomet. Chem., 2010, 695, 1883 CrossRef.
  22. Superbases for Organic Synthesis: Guanidines, Amidines, Phosphazenes and Organocatalysts, ed. T. Ishikawa, John Wiley & Sons, 2009 Search PubMed.
  23. (a) C. Alonso-Moreno, F. Carrillo-Hermosilla, A. Garcés, A. Otero, I. López-Solera, A. M. Rodríguez and A. Antiñolo, Organometallics, 2010, 29, 2789 CrossRef CAS; (b) D. Elorriaga, F. Carrillo-Hermosilla, A. Antiñolo, I. López- Solera, B. Menot, R. Fernández-Galán, E. Villaseñor and A. Otero, Organometallics, 2012, 31, 1840 CrossRef CAS; (c) D. Elorriaga, F. Carrillo-Hermosilla, A. Antiñolo, I. López- Solera, R. Fernández-Galán and E. Villaseñor, Chem. Commun., 2013, 49, 8701 RSC.
  24. W.-X. Zhang, M. Nishiura and Z. Hou, Synlett, 2006, 8, 1213 Search PubMed.
  25. M. V. Berridge and A. S. Tan, Arch. Biochem. Biophys., 1993, 303, 474–482 CrossRef CAS PubMed.
  26. (a) J. M. Sargent, Recent Results Cancer Res., 2003, 161, 13 CAS; (b) D. Shcharbin, E. Pedziwiatr, J. Blasiak and M. Bryszewska, J. Controlled Release, 2010, 141, 110 CrossRef CAS PubMed; (c) V. N. Sumantran, Methods Mol. Biol., 2011, 731, 219 CrossRef CAS PubMed.
  27. (a) J. Y. Koh and D. W. Choi, J. Neurosci. Methods, 1987, 20, 83 CrossRef CAS PubMed; (b) K. Wallace, J. D. Strickland, P. Valdivia, W. R. Mundya and T. J. Shafer, NeuroToxicology, 2015, 49, 79 CrossRef CAS PubMed.
  28. N. Kee, S. Sivalingam, R. Boonstra and J. M. Wojtowicz, J. Neurosci. Methods, 2002, 115, 97 CrossRef CAS PubMed.
  29. S. P. Bell and A. Dutta, Annu. Rev. Biochem., 2002, 71, 333 CrossRef CAS PubMed.
  30. (a) M. Sirajuddin, S. Ali and A. Badshah, J. Photochem. Photobiol., B, 2013, 124, 1 CrossRef CAS PubMed; (b) M. Frezza, Q. Ping Dou, Y. Xiao, H. Samourei, M. Rashidi, F. Samari and B. Hemmateenejad, J. Med. Chem., 2011, 54, 6166 CrossRef CAS PubMed; (c) C.-Y. Gao, X. Qiao, Z.-Y. Ma, Z.-G. Wang, J. Lu, J.-L. Tian, J.-Y. Xu and S.-P. Yan, Dalton Trans., 2012, 41, 12220 RSC; (d) A. F. Westendorf, L. Zerzankova, L. Salassa, P. J. Sadler, V. Brabec and P. J. Bednarski, J. Inorg. Biochem., 2011, 105, 652 CrossRef CAS PubMed.
  31. P. S. Nage, S. J. Quinn, J. M. Kelly, D. H. O'Donovan, A. R. Khan, F. Rodríguez, B. Nguyen, W. D. Wilson and I. Rozas, Org. Biomol. Chem., 2010, 8, 5558 Search PubMed.
  32. Introduction to Spectroscopy, ed. D. L. Pavia, Brooks-Cole Pub. Co., 2009 Search PubMed.
  33. M. R. Eftink and C. A. Ghiron, J. Phys. Chem., 1976, 80, 486 CrossRef CAS.
  34. D. P. Heller and C. L. Greenstock, Biophys. Chem., 1994, 50, 305 CrossRef CAS PubMed.
  35. R. Salvio, Chem.–Eur. J., 2015, 21, 1 CrossRef PubMed.
  36. (a) B. J. Pages, F. Li, P. Wormell, D. L. Ang, J. K. Clegg, C. J. Kepert, L. K. Spare, S. Danchaiwijit and J. R. Aldric-Wright, Dalton Trans., 2014, 43, 15566 RSC; (b) P. S. Nagle, C. McKeever, F. Rodriguez, B. Nguyen, W. D. Wilson and I. Rozas, J. Med. Chem., 2014, 57, 7663 CrossRef CAS PubMed; (c) A. Shah, E. Nosheen, S. Munir, A. Badshah, R. Qureshi, Z. Rehman, N. Muhammad and H. Hussain, J. Photochem. Photobiol., B, 2013, 120, 90 CrossRef CAS PubMed; (d) M. Jamil, A. A. Altaf, A. Badshah, Shafiqullah, I. Ahmad, M. Zubair, S. Kemal and M. I. Ali, Spectrochim. Acta, Part A, 2013, 105, 165 CrossRef CAS PubMed.
  37. E. Pop, D. C. Oniciu, M. E. Pape, C. T. Cramer and J.-L. Dasseux, Croat. Chem. Acta, 2004, 77, 301 CAS.
  38. F. Aman, M. Hanif, W. A. Siddiqui, A. Ashraf, L. K. Filak, J. Rynisson, T. Söhnel, S. M. F. Jamieson and C. G. Hartinger, Organometallics, 2014, 33, 5546 CrossRef CAS.
  39. http://www.molinspiration.com.
  40. SAINT+ NT ver. 6.04. SAX Area-Detector Integration Program, Bruker AXS, Madison, WI, 1997–2001 Search PubMed.
  41. G. M. Sheldrick, SADABS version 2.03, a Program for Empirical Absorption Correction, Universität Göttingen, 1997–2001 Search PubMed.
  42. Bruker AXS SHELXTL version 6.10. Structure Determination Package, Bruker AXS, Madison, WI, 2000 Search PubMed.
  43. G. M. Sheldrick, Acta Crystallogr., 2015, C71, 3 CrossRef PubMed.
  44. J. Ruiz, C. Vicente, C. de Haro and A. Espinosa, Inorg. Chem., 2011, 50, 2151 CrossRef CAS PubMed.
  45. F. Blanco, B. Kelly, G. Sánchez-Sanz, C. Trujillo, I. Alkorta, J. M. Elguero and I. Rozas, J. Phys. Chem. B, 2013, 117, 11608 CrossRef CAS PubMed.
  46. H. A. Benesi and J. H. Hildebrand, J. Am. Chem. Soc., 1949, 71, 2703 CrossRef CAS.
  47. A. Wolf, G. H. Shimer and T. Meehan, Biochemistry, 1987, 26, 6392 CrossRef.
  48. L. Y. Zhang, L. Y. Liu, L. L. Qie, K. N. Ling, L. H. Xu, F. Wang, S. H. Fang, Y. B. Lu, H. Hu, E. Q. Wei and W. P. Zhang, Eur. J. Pharmacol., 2012, 674, 163 CrossRef CAS PubMed.
  49. D. Tornero, I. Posadas and V. Ceña, PLoS One, 2011, 6, e20423 CAS.
  50. I. Posadas, P. Santos, A. Blanco, M. A. Muñoz-Fernandez and V. Ceña, PLoS One, 2010, 5, e15360 Search PubMed.

Footnote

Electronic supplementary information (ESI) available: CIF file giving details of data collection, refinement, atom coordinates, anisotropic displacement parameters, and bond lengths and angles for compound 13 (CCDC 1033053); UV spectrum and competitive UV studies for representative compounds; emission spectrum of EB binding to DNA in the presence of compound 1, 8 and 13; and 1H and 13C NMR spectra for the new compounds. For ESI and crystallographic data in CIF or other electronic format see DOI: 10.1039/c5ra17920c

This journal is © The Royal Society of Chemistry 2016