 Open Access Article
Models to predict the magnetic properties of single- and multiple-bridged phosphate CuII systems: a theoretical DFT insight†‡
K.
Muñoz-Becerra
a,
D.
Aravena
ab,
E.
Ruiz
 c,
E.
Spodine
bd,
N.
Soto-Donoso
ab,
V.
Paredes-García
e and
D.
Venegas-Yazigi
 *ab
*ab
aFacultad de Química y Biología, Universidad de Santiago de Chile, USACH, Santiago, Chile. E-mail: diego.venegas@usach.cl
bCentro para el Desarrollo de la Nanociencia y Nanotecnología, CEDENNA, Santiago, Chile
cDepartament de Química Inorgànica i Orgànica and Institut de Química Teòrica i Computacional, Universitat de Barcelona, Barcelona, Spain
dFacultad de Ciencias Químicas y Farmacéuticas, Universidad de Chile, Santiago, Chile
eUniversidad Andres Bello, Departamento de Ciencias Químicas, Santiago, Chile
First published on 20th December 2016
Abstract
Copper(II) phosphate bridged compounds have been studied by DFT methods in order to gain a better understanding of the magnetic exchange interactions through 1,1 and 1,3-bridges, which vary with the bonding modes of the ligand. In many cases phosphate is only one among several bridging ligands making it difficult to identify the predominant exchange pathway. This work proposes a graphical analysis, based on the unrestricted corresponding orbitals (UCO), and the derived “magnetic orbitals” to identify the predominant exchange pathway. Models for the 1,1- and 1,3-bridging modes allow establishing the angle or dihedral dependence of the J values. For the 1,1-bridging mode the θ Cu–O–Cu angle was used. For the 1,3-phosphate the correlation was established with a D–P–Oi–Cui dihedral angle (τ) where D is a dummy atom. Using models with different D–P–Oi–Cui dihedral angles a predictive scheme was generated. Eleven copper(II) phosphate bridged structures were used to validate the proposed model. The study has shown that antiferromagnetic exchange interactions are primarily produced by phosphate bridges due to the possibility of this ligand that always enables a degree of overlap between the magnetic orbitals.
1. Introduction
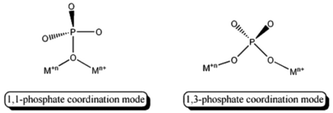
In the field of materials science, the knowledge of the chemical characteristics and physical properties of each component as well as the interactions between them is essential to control the structural features and the physical mechanisms that influence the properties of new materials.1–3 Nowadays, materials exhibiting remarkable physical properties like magnetism can be obtained due to the better understanding of the chemical bonding and the structural organization of their components and by the studies of the interaction between their individual components.4,5 Moreover interesting properties such as those associated with molecular coolers and slow relaxation phenomena are also reported.6,7 Phosphorus derived ligands such as phosphonates and phosphates have been of interest to chemists to obtain new magnetic materials. From a structural point of view, phosphonates offer the possibility to coordinate through three oxygen centres permitting the organic substituent to act as a structural director, while the phosphates can offer four oxygen atoms to act as coordination centres. Both ligands can give from molecular to 3D materials, and are also interesting for a wide range of applications. For instance Rojo and Clearfield have published several studies during the last few decades based on both ligands with applications ranging from batteries and catalysis to magnetism.8–20 Recently it has been reported that phosphonate complexes can be condensed to surfaces to engineer magnetic exchange and anisotropy towards molecular spintronic devices.21 Many efforts have also been made to understand the magneto structural behaviour of phosphonate-derived materials, with the studies by Zheng, Bellitto and Clearfield being important contributions.9–11,20,22 However fewer studies have been done for phosphate based materials. In this sense, phosphate appears as a widely used ligand in inorganic and hybrid organic–inorganic materials, where it binds the metal centres with different coordination modes that in a simple way can be classified as 1,1- and the classical 1,3-coordination modes (Scheme 1).Different notations are used to describe the coordination modes of the phosphate ion. The work reported by Su et al. uses the Harris notation and shows systems in which one phosphate ion can be coordinated to up to six metal ions at the same time.23 Hence, this ligand can be found in both molecular and extended polymetallic systems, where it bridges two or more cationic centres.24–37 As can be understood from the Cambridge Structural Database, CSD,38 many first transition metal ion phosphates have been reported, but copper based systems are one of the most studied. Among the molecular complexes, the best known are the dinuclear copper phosphate bridged ones, while the tetranuclear and trinuclear species have been less investigated.31,37,39,40 Thus, the different magnetic patterns, ranging from isolated molecular dinuclear copper complexes to extended 3D frameworks, have generated several analyses with the use of both experimental and theoretical data. Several authors report that the 1,3-PO4 coordination mode should produce a weaker magnetic coupling than the 1,1-PO4, where the interaction is through only one oxygen atom.39,41–43
The work by Crawford et al. in 1976 is one of the first attempts to correlate magnetic properties transmitted through one oxygen atom, with structural parameters. This work deals with planar di-hydroxido di-copper complexes with nitrogen containing ligands in the first coordination sphere.44 These authors correlated the magnitude of the exchange parameter, J, with the value of the angle Cu–O–Cu of the hydroxido complexes. Recently Ruiz et al., using DFT calculations, expanded the above-mentioned correlation by incorporating the out of plane displacement angle of the hydrogen atom of the hydroxido group.45
Doyle et al. reported an experimental and theoretical study of a ferromagnetic tetranuclear copper(II) complex, bridged by phosphate. Both the 1,3- and 1,1-phosphate coordination modes are present in the studied complex. They point out the similarity between the hydroxido and the 1,1-phosphate bridges, as in both systems only one oxygen atom is involved in the exchange.37 The phenoxido bridge is another one oxygen atom bridge studied by Venegas-Yazigi by DFT calculations.46
In the late seventies Lambert et al. proposed that the tetrahedrally oriented oxoanions showing pure sp3 hybridization, such as ClO4−, PO43−, and CrO42−, propagate ferromagnetic exchange interactions between copper ions.36 More recently Doyle et al. analysed an arsenate bridged copper compound based on Lambert's statements. The resulting weak antiferromagnetic-coupled system was explained by the authors giving, as one possible reason, the deviation of the bridgehead O–As–O angles from the perfect tetrahedral 109.5° value.47 Moreover, several examples of 1,3-phosphate bridged copper compounds have been shown to be antiferromagnetically coupled.42,43 Therefore, more work is needed in order to contribute to the understanding of the magnitude and sign of the magnetic exchange interactions mediated by phosphate bridges, since it becomes evident that the exact mode of coordination of the phosphate group that determines the bridging mode and the bridging angles, and hence the exact orbitals involved in the transmission of the exchange phenomenon, will affect the sign and magnitude of the coupling constant, J. If a search for P–O–Cu angles is performed in the CSD,38 80 hits ranging from 112° to 162° are obtained. This result shows that the oxygen from the phosphate group that acts as a bridge always adopts a distorted tetrahedral geometry, i.e. the angles are larger than 109.5°. In the present work, we have generated structural models with 1,1- and 1,3-PO4 coordination modes, and evaluated the exchange parameters as a function of different structural distortions using DFT calculations. As discussed above, one phosphate bridge is generally present together with other phosphate bridges or different auxiliary ligands generating a multiple bridged interaction.
Hybrid organic–inorganic materials based on phosphate ligands have a relevant role in fundamental and applied materials science and the combination of both the phosphate ligands and organic components can lead to new structures with novel properties. We propose a graphical analysis of the structural dependence of J and the magnetic orbital model of the exchange interaction, based on unrestricted corresponding orbitals (UCO).48,49 This representation allows the derivation of “magnetic”-like orbitals, as it reinforces one to one pairing of alpha and beta electrons to describe doubly occupied orbitals. In this way, unpaired electrons are described by alpha orbitals that do not have a beta counterpart, being effectively “unpaired”. The derived magnetic orbitals are then compared to the ones of Kahn–Briat in systems with more than one unpaired electron per metal centre.50
2. Computational details
All calculations were performed using the ORCA 3.0.3 program package.51,52 Molecular geometries for experimental complexes were obtained from the CSD database. The studied systems are detailed in Fig. 1.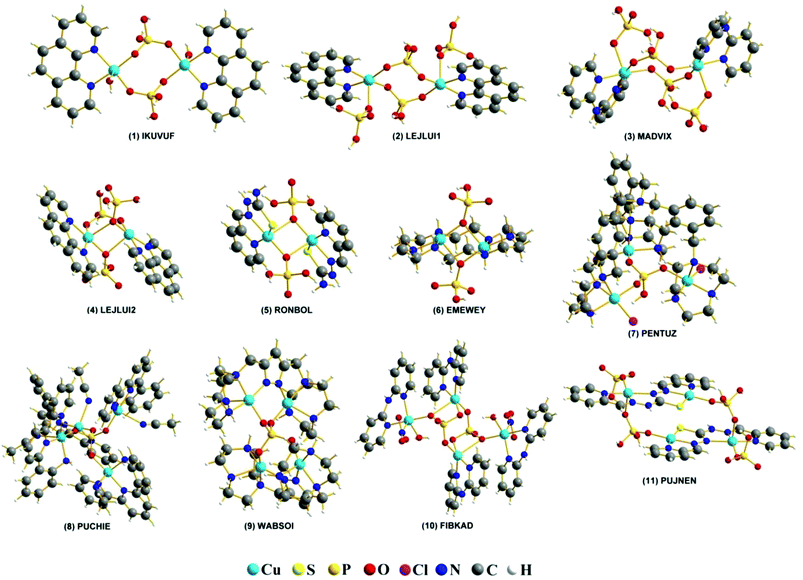 | ||
| Fig. 1 REFCODES and structures of the eleven studied systems taken from the CCDC crystallographic database. | ||
Hydrogen positions were optimized using the BP86 functional, which had been previously proven to be better than the hybrid B3LYP, in conjunction with the Def2-TZVP basis set.53 In some cases, disordered positions of heavier atoms were encountered, and constrained optimizations for these centres were performed. It is worth noting that no paramagnetic ions, directly bonded to the donor atoms or bridging centres which mediate the superexchange interaction, were optimized in any case. Magnetostructural models for the 1,1- and 1,3-coordination modes of the phosphate anion were built following a similar procedure: (i) a central Cu2H2PO4 moiety was constructed with typical distances for the phosphate ion and the O–Cu bond distance, (ii) the coordination environment of the Cu centres was completed with three ammonia ligands, completing a square planar coordination (i.e. the three Cu–ammonia and the Cu–OPO3 bonds are in the same plane and form right angles between them), (iii) bond distances, but not angles, were allowed to relax, (iv) hydrogen atoms were fully relaxed. After these steps, relevant bond angles were modified to scan the relevant geometric parameters for each model (vide infra) with no further optimization. For the 1,1-phosphate coordination mode, two models were built, one symmetric (two equal Cu–O distances of 2.037 Å) and one asymmetric. The latter was considered based on a search on the CSD showing that most experimental cases have different Cu–O distances. The used values are the averages of the experimental ones (Cu1–O = 2.037 Å and Cu2–O = 2.500 Å).
Magnetic coupling constants were calculated by the broken-symmetry approach, following the Ĥ = −JS1·S2 Hamiltonian.54–56 The non-projected formula for the relation of the coupling constant and the energies of the high spin and broken symmetry solutions were employed.57 All calculations were carried out using the B3LYP density functional58 and the Def2-TZVP basis set.53 Taking into account that coupling constants involve small energy differences (in the order of cm−1), a larger integration grid (Grid7 in ORCA nomenclature) and very tight convergence criteria were employed in these calculations. In dinuclear CuII models, the only coupling constant can be directly obtained from the high spin (S = 1) and the broken symmetry solution. In high nuclearity complexes, it is possible to find several coupling constants, corresponding to the interaction of different pairs of paramagnetic centres. Several broken symmetry calculations are necessary to obtain the exchange coupling constants of polynuclear systems. Therefore the number of different exchange pathways to be calculated will define the number of calculations. Each calculated J value needs an equation defined as the difference in energy between the ferromagnetic solution and one spin configuration different from the high spin one. Therefore if n different J values should be determined, n + 1 calculations should be done; the ferromagnetic and n linearly independent spin configurations. For a full description of the method see reference of Ruiz et al.59 Considering that magnetic interactions occur between two paramagnetic centres, a substitution of all other paramagnetic centres, which do not belong to the evaluated exchange interaction, is done with ZnII diamagnetic ions. Moreover, this substitution allows a clear visualization of the involved spin density in the evaluated exchange interaction. It is important to stress that the substitution does not affect the obtained J values, because both methodologies involve a spin localized model.60,61 Diamagnetic substitution calculations were also employed to generate unrestricted corresponding orbitals (UCO), which resemble the notion of magnetic orbitals, as they maximize the one-to-one correspondence between doubly occupied orbitals, leaving the unpaired electrons in “magnetic”-like orbitals.62
On the other hand, the canonical representation of orbitals results in a representation of unpaired electron density by several orbitals, thus making difficult to identify the magnetic orbital. For this reason most of the analyses have been done examining the empty beta orbital to identify the magnetic ones. Therefore the use of UCOs lowers the polarization effect obtained in the canonicals, thus giving the n unpaired electrons represented by n magnetic orbitals.
UCOs were further employed to generate and graphically represent the overlap function of the magnetic orbitals as the product of the unpaired electrons over a tridimensional grid. For clarity, the overlap functions obtained from the UCOs are plotted in light green and violet.
3. Results and discussion
Based on the structural analysis of the studied structures (Table S1‡), it becomes clear that there are many variables that can change simultaneously, such as bond distances, bond angles and phosphate coordination modes, as well as the number of bridges affecting the magnitude and nature of the different exchange interactions present in each studied structure. Due to the impossibility of finding a clear and simple relationship between the calculated J values and the nature of the phosphate bridges involved in the exchange pathways (metric values of each pathway listed in Table 1), a new parameter that will demonstrate the main factor that dominates the nature of the 1,3-PO4 exchange pathway was proposed.| Compound | REFCODE | Number of CuII centers | d(Cu–Cu) (Å) | Phosphate-coordination | J calc (cm−1) | J exp (cm−1) | J label | Ref. |
|---|---|---|---|---|---|---|---|---|
| a Pyrazole. b Pyridine-2-aldehyde thiosemicarbazone. c Bis(pyridine-2-aldehyde)thiocarbohydrazone. | ||||||||
| 1 | IKUVUF | 2 | 5.0095(6) | 1,3-H2PO4− | −14.9 | −8.0 | — | 65 |
| 1,3-H2PO4− | ||||||||
| 2 | LEJLUI1 | 2 | 5.0430(1) | 1,3-H2PO4− | −3.2 | −8.2 | — | 66 |
| 1,3-H2PO4− | ||||||||
| 3 | MADVIX | 2 | 5.1357(2) | 1,3-H2PO4− | −3.5 | −2.85 | — | 67 |
| 1,3-H2PO4− | ||||||||
| 4 | LEJLUI2 | 2 | 3.0742(5) | 1,3-H2PO4− | −0.2 | 0.96 | — | 66 |
| 1,1-HPO42− | ||||||||
| 1,1-H2PO4− | ||||||||
| 5 | RONBOL | 2 | 3.2950(2) | 1,1-H2PO4− | 0.6 | AF | — | 41 |
| 1,1-H2PO4− | ||||||||
| 6 | EMEWEY | 2 | 3.0362(8) | 1,1-HPO42− | −1.2 | Not reported | — | 68 |
| 1,1-HPO42− | ||||||||
| 7 | PENTUZ | 3 | 5.3916(5) | 1,3-HPO42− | 4.0 | Not reported | — | 69 |
| 8 | PUCHIE | 4 | 5.2440(3) | 1,3-PO43− | 6.4; −0.7 | Not reported | A | 70 |
| 5.2750(2) | 1,3-PO43− | B | ||||||
| 9 | WABSOI | 4 | 5.6392(8) | 1,3-PO43− | −15.2 | Not reported | A | 71 |
| 5.3199(8) | 1,3-PO43− | 3.2 | B | |||||
| 5.7772(8) | 1,3-PO43− | 5.7 | C | |||||
| 4.8758(8) | 1,3-PO43− | 8.2 | D | |||||
| 4.0984(6) | 1,3-PO43−-othera | −47.4 | ||||||
| 4.0275(8) | 1,3-PO43−-othera | −57.8 | ||||||
| 10 | FIBKAD | 4 | 4.8953(7) | 1,3-H2PO4− | 0.7 | Not reported | i | 72 |
| 4.1359(6) | 1,3-H2PO4− | −27.5 | ii | |||||
| 1,1-H2PO4− | ||||||||
| 4.5597(6) | 1,3-H2PO4− | −11.7 | iii | |||||
| 1,3-H2PO4− | ||||||||
| 11 | PUJNEN | 4 | 5.070(2) | 1,3-H2PO4− | −0.3 | −105 | A | 42 |
| 4.983(2) | Not phosphateb | −97.3 | ||||||
| 3.798(2) | Not phosphatec | −1.5 | ||||||
The relative Cu–phosphate and Cu–Cu orientations were measured considering how the CuII centres are positioned with respect to a dummy atom located on a vector projecting from the phosphorus atom (P–D; D = dummy atom) and lying in the intersection between the two O–P–O planes of the phosphate bridge, thus defining the two dihedral D–P–Oi–Cui (τ) angles (Fig. 2). This model was developed because in this way both Cu–O interactions are related to each other. If the average of dihedral angles (O–P–O–Cui) is used, there would be a loss of information because there are infinite pairs of angles that would give the same average value. Based on this convention, two D–P–O–Cu dihedral angles were obtained for each Cu–phosphate–Cu exchange pathway in all the studied structures (Table S1‡). This new parameter will give an idea about the relative orientation between the d(x2–y2) magnetic orbitals of the interacting copper centres and their propagation and directionality through the phosphate bridges. Consequently, in order to evaluate how this parameter will influence the nature of the magnetic interaction between two interacting CuII centres, dinuclear models with 1,3-phosphate bridges were constructed and their different coupling constants were calculated.
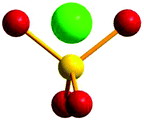 | ||
| Fig. 2 Model of a dummy atom located in an O–P–O plane. Red: oxygen atoms, yellow: phosphorus atom, green: dummy atom. | ||
For the more simple interaction given by a 1,1-PO4 bridge, two models with Cu–O bond distances, symmetric and asymmetric, varying the Cu–O–Cu (θ) angle were constructed. The Cu–O distances obtained from a search of similar systems in the CSD showed both symmetric and asymmetric bonds.
3.1. Magnetostructural 1,1-phosphate coordination model
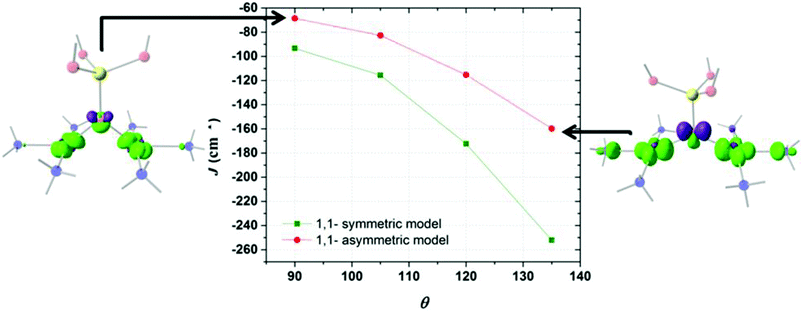
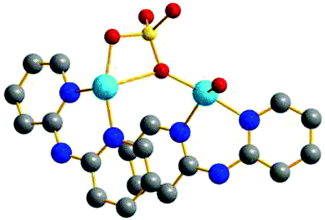
Fig. 3 shows the triprotonated 1,1-PO4 asymmetric model of two triamino copper(II) complexes in a square coordination geometry. Two different families were built, the first considering equal Cu–O distances (Cu1–O = Cu2–O = 2.037 Å), and a second family with different Cu–O distances (a distorted bridge with Cu1–O = 2.037 Å and Cu2–O = 2.500 Å). The Cu1–O–Cu2 angle θ is the variable parameter, varying from 135° to 90°. The calculated J values for both families as a function of the θ value are shown in Fig. 4.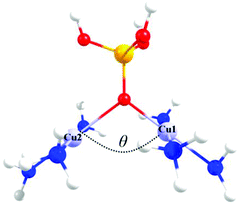 | ||
| Fig. 3 The triprotonated 1,1-PO4 asymmetric model, defining θ as the Cu–O–Cu angle. Red: oxygen atoms, yellow: phosphorus atom, light blue: copper atoms, blue: nitrogen atoms, white: hydrogen atoms. | ||
The model with asymmetric Cu–O bond distances has less antiferromagnetic behaviour than the model with the symmetric ones, for all θ values (Fig. 4). The overlap surfaces obtained from the UCOs of the model with the smallest studied angle (θ = 90°), showed that the size of the lobes of opposite phases on the oxygen atom are similar, thus not favouring the interaction (Fig. 4, left). In the case the model with θ = 135° the opposite lobes showed different sizes, favouring the antiferromagnetic interaction. In both 1,1-phosphate coordination models a larger angle produces a larger overlap that leads to a stronger antiferromagnetic coupling. Therefore the use of the calculated overlap surfaces generated from the UCOs is a good tool to predict the overlap both by the size and directionality of the lobes.
3.2. Magnetostructural 1,3-phosphate coordination model
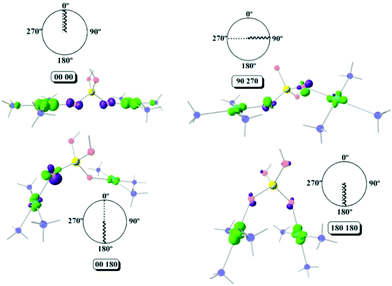
The dinuclear magnetostructural 1,3-PO4 model was built starting from a situation where both Cu–O vectors are collinear, as shown in Fig. S1a.‡ The clock depicted in the upper left corner of the figure is the code used for the values of the dihedral D–P–O–Cu (τ) angles; in this particular case both dihedral angles are equal to zero, with the Cu1–O1 and Cu2–O2 vectors being collinear. In this situation both P–O1–Cu1 and P–O2–Cu2 angles are equal to 144.7°, a value which was kept constant in the generation of all the studied models. Additionally, the eclipsed “trans-like” 1,3-model with D–P–O1–Cu1 = 90° and D–P–O2–Cu2 = 270° is shown in Fig. S1b.‡ The rest of the 1,3-models were developed by scanning every 30° the dihedral τ, i.e. for a fixed value of D–P–O1–Cu1 = 30°, D–P–O2–Cu2 was scanned from 0° to 360° every 30°, and so on. This scanning produces two virtual cones in the structure as shown in Fig. S2.‡ Due to this possibility of moving around virtual cones, the nomenclature of syn–syn, syn–anti and anti–anti cannot be used as is done for planar ligands, such as carbonate and carboxylates. However, three points can be correlated with this nomenclature, which are (0°, 0°) anti–anti, (0°, 180°) syn–anti and (180°, 180°) syn–syn.It is important to stress that in the depicted models both triamino-copper planes are coplanar. Calculations varying the coplanarity in the range of 0° to 90° showed no influence on the obtained J values. This is an expected result, due to the fact that this rotation has σ-type symmetry of the interaction of the magnetic orbital of the copper centres with the phosphate bridge.
In order to avoid any ambiguity in the definition of the dihedral D–P–Oi–Cui (τ) angles and the relative orientation, the following convention was defined: (i) for an equal value of both dihedral angles, both Oi–Cui vectors are parallel and eclipsed (ii) for the antiparallel or “trans-like” orientation of the O–Cu bonds, the angle between both vectors is 180° (Fig. S1b‡).
In this way due to the symmetry around 180°, any point will have four symmetric equivalent points in a 360°/360° graph. For example, the (30°, 60°) configuration is equivalent to (60°, 30°) and (300°, 330°) and (330°, 300°). Conveniently this approach allows an unequivocal assignation of the position of a particular configuration, regardless of any sign convention in the measurement of the dihedral angles.
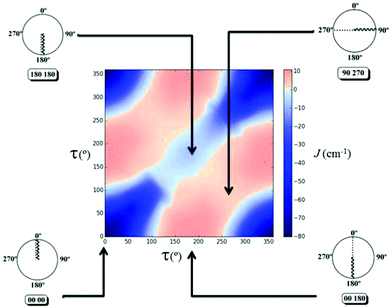
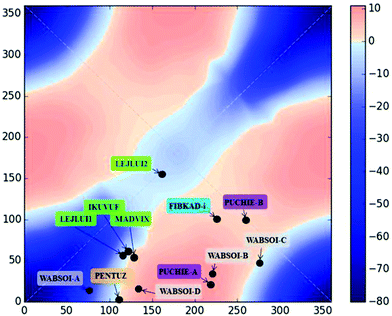
The 2D diagram depicted in Fig. 5 shows the magnetic behaviour obtained for the different rotation τ angles evaluated in the 1,3-model; the pink colour represents the ferromagnetic cases and the blue colour the antiferromagnetic ones. It is important to remark that the graph was generated with an antiferromagnetic scale from 0 to −80 cm−1, while the ferromagnetic one was from 0 to +10 cm−1. The decrease of the intensity of both colours was used to show the gradual change between the ferro- and the antiferromagnetic behaviour, i.e., where the magnetic interactions are very weak. The axes in the diagram refer to the rotation of both D–P–Oi–Cui angles of the model. The 1,3-model shown in Fig. 5 where both Cu–O vectors are collinear (τ = 0° for both copper centres), corresponds to the origin of the diagram (0°, 0°), which is the most antiferromagnetic evaluated case. The magnetic behaviour through the diagonal from (0°, 0°) to (360°, 360°) in which both angles vary in the same value and the same direction, is always antiferromagnetic, decreasing its value in the range of (130°, 130°) to (270°, 270°). On the other hand, the magnetic behaviour for different angles and different orientations, i.e. the other diagonal from (0°, 360°) to (360°, 0°) changes from antiferro- to ferromagnetic.
Using Fig. 6, four different cases will be discussed, a strong antiferromagnetic (0°, 0°) and a weak one (180°, 180°); a strong ferromagnetic (0°, 180°) and a weak one (90°, 270°). For the antiferromagnetic cases, the calculated overlap surfaces from the UCOs of the (0°, 0°) model showed that this has the largest surface size and favourable signs and directionality for the interaction between the copper and the oxygen atoms, thus being the most antiferromagnetically coupled model. The (180°, 180°) which is also antiferromagnetically coupled but to a lesser extent, the overlap surfaces show that the directionality of the lobes on the oxygen atoms and the copper atoms only permit a smaller overlap with respect to the (0°, 0°) model (Fig. 6). On the other hand, the less ferromagnetic system (90°, 270°) shows an unfavourable overlap between the lobes of different signs between the copper centres and the oxygen atoms. The most ferromagnetic system (0°, 180°) lacks of overlap surface on one of the oxygen atoms thus increasing the ferromagnetism, Fig. 6.
In order to test the proposed models eleven polymetallic molecular structures were selected from the CSD database and their magnetic coupling constants were calculated with DFT methods (Tables 1 and S1‡). Table 1 summarizes the calculated magnetic coupling constants, J, for the eleven studied structures along with the reported experimental values (in the cases where the magnetic study was reported). The obtained J values span from antiferromagnetic to ferromagnetic. Selected structural parameters related with the exchange pathways and the corresponding calculated J values for each structure are shown in Table 1.
Structures 1 to 6 are dinuclear compounds with two (1, 2, 3, and 6) and three (4 and 5) protonated phosphate groups as bridges between the CuII centres. Structure 7 is a trinuclear one with one central {HPO4} group connecting the three copper centres, while the other four structures (8 to 11) have four CuII centres connected through one central {PO4} group.
Except for 10 and 11, the CuII atoms are five-coordinated within the studied structures. In 10 two of the four CuII centres are six-coordinated and the other ones are five-coordinated, while two of the CuII centres in 11 are four-coordinated and the other two five-coordinated.
The pure 1,3-phosphate connectivity mode for the CuII centres is found in structures 1, 2, 3, 7, 8, 9, and 11, while the pure 1,1-phosphate connectivity mode is found in 5 and 6. Structures 4 and 10 present mixed 1,1- and 1,3-coordination modes of the phosphate groups.
As can be observed in Table 1 the Cu–Cu distances vary from 3.036 Å to 5.777 Å, the shortest distances being those that include at least one 1,1-PO4 as a bridge. The Cu–O–Cu angles of the structures with 1,1-PO4 bridges have values ranging from 92.8° to 97.2°. The Cu–O–P angles measured for the 1,3-phosphate bridged complexes have values in the range of 121.0° to 135.6°, while the values of the dihedral angles Cu–O–O–Cu are in the range of −143.8° to 168.8° (Table S1‡). The latter angles represent the relative collinearity between the interacting CuII centres through the 1,3-phosphate bridge. In structure 10 a Cu–O–Cu angle of 137.7° is found, due to the presence of one phosphate group simultaneously bridging two copper centres in both 1,1- and 1,3-modes (Fig. 7).
Trinuclear compound 7 has three equivalent Cu–Cu distances (dCu1–Cu2 = dCu2–Cu3 = dCu1–Cu3 = 5.392 Å), therefore only one exchange pathway can be considered. In compounds 8 and 9 with six possible exchange pathways, only two different Cu–Cu distances are present in 8 (dCu1–Cu2 = dCu1–Cu3 = dCu2–Cu4 = dCu3–Cu4 = 5.244 Å; dCu1–Cu4 = dCu2–Cu3 = 5.275 Å), thus two J values are considered. While in the case of 9 the six Cu–Cu distances are different, thus six J values were calculated (dCu1–Cu2 ≠ dCu1–Cu3 ≠ dCu1–Cu4 ≠ dCu2–Cu3 ≠ dCu2–Cu4 ≠ dCu3–Cu4). Compounds 10 and 11, both tetranuclear, have only five possible exchange pathways. Due to the linear configuration Cu1–Cu4 is not a first neighbour interaction, thus only five possible exchange pathways can be obtained.
However in both compounds only three different Cu–Cu distances can be found, therefore three J values are considered in each case. For tetranuclear compound 10, (dCu1–Cu2 = dCu3–Cu4 = 4.136 Å; dCu1–Cu3 = dCu2–Cu4 = 4.895 Å; dCu2–Cu3 = 4.560 Å). In the case of tetranuclear 11, dCu1–Cu2 = dCu3–Cu4 = 5.070 Å; dCu1–Cu3 = dCu2–Cu4 = 4.983 Å and dCu2–Cu3 = 3.798 Å.
Exchange interactions with pure phosphate bridges in 1,3- and 1,1-coordination modes, or both simultaneously, not including other auxiliary ligands, showed antiferro- to ferromagnetic values ranging from −27.5 to +8.2 cm−1.
On the other hand when a nitrogen-based auxiliary bridge together with a 1,3-phosphate is the exchange pathway, an increase in antiferromagnetism is caused with calculated J values of −47.4, −57.8 and −97.3 cm−1 for both bridges in 9 and one bridge in 11 respectively.
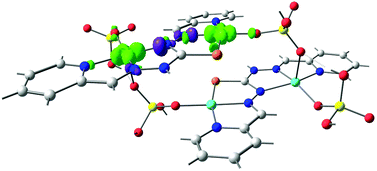
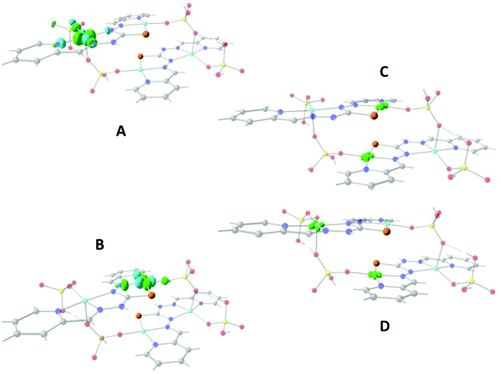
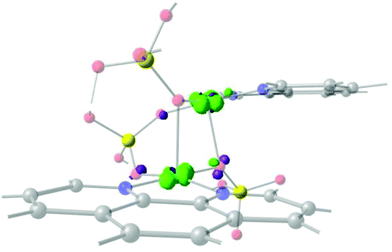
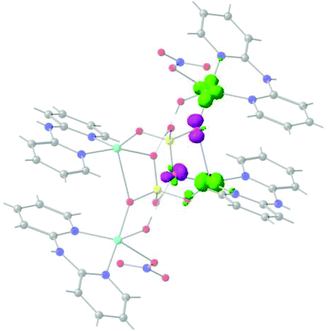
It is well known that the overlap of the magnetic orbitals is the key for the observed magnetic behaviour. The overlap values <S2> of the eleven studied structures and their correlation with the calculated J values were evaluated with the Kahn–Briat model.63,64Fig. 8 shows that this correlation follows, as expected, a linear tendency for the negative J values corresponding to the highest overlap values with the most antiferromagnetic J constants. No linear correlation following the Kahn–Briat model could be expected for the values close to zero. In order to achieve a better understanding of the above-mentioned correlation, the surfaces of the overlap functions obtained from the UCOs of two representative ferromagnetic (J = +6.4 cm−1 for 8) and antiferromagnetic (J = −15.2 cm−1 for 9) cases are depicted in Fig. 8. In both systems, the representation is in agreement with the calculated J values, i.e. a more antiferromagnetic J value is due to a stronger overlap between the magnetic centres, producing a bigger overlap surface. The ferromagnetic interaction for 8 PUCHIE-A (left) has smaller overlap surface and unfavourable orientation of the lobes, than the antiferromagnetic interaction for 9 WABSOI-A (right). In Fig. 9 compound 11 (PUJNEN) which has three different magnetic pathways, the one with only an auxiliary N,N-based ligand shows the most antiferromagnetic calculated J value of −97.3 cm−1. This is due to the favourable overlap between the d(x2–y2) magnetic orbitals through the N,N-based ligand.
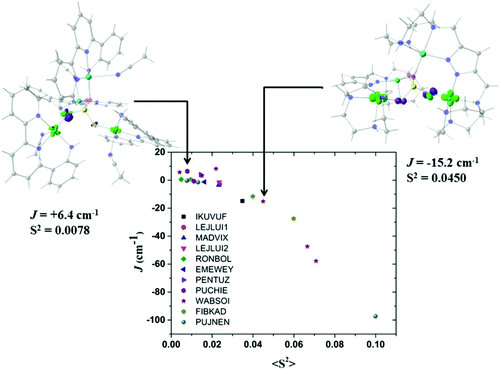 | ||
| Fig. 8 Plot of the calculated overlap <S2> as a function of the calculated J values for compounds in Table 1, following the Kahn–Briat model. (PUCHIE-A (left): J = +6.4 cm−1; WABSOI-A (right), J = −15.2 cm−1). The overlap surfaces are plotted in light green and violet using a contour isovalue of 0.0012. Light red: oxygen atoms, yellow: phosphorus atom, light blue: copper atoms, blue: nitrogen, grey: carbon atoms. Hydrogen atoms were omitted for clarity. | ||
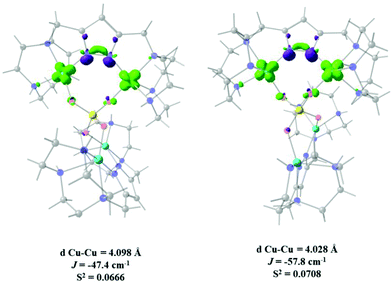
Fig. 10A and B show that the magnetic orbitals d(x2–y2) are positioned on the base of the square pyramid of each CuII centre in the same plane of the nitrogen based ligand, thus leading to a large overlap. The second interaction in 11 including two sulphur bridges gives a calculated J value of −1.5 cm−1. This low value is due to a very weak Cu–S–Cu′ interaction, Cu–S (d = 2.263 Å) and Cu′–S (d = 3.241 Å), Fig. 10C. It is clear that using the same contour isovalue as in the rest of the figures, a very small size of the lobes is obtained, reflecting the small exchange interaction through the sulphur. The third one which has only a 1,3-phosphate bridge (PUJNEN A), also has a small size of the lobes, which is reflected in the calculated J value of −0.3 cm−1, Fig. 10D. However, this interaction of the phosphate bridge is equatorial to one copper centre (in the same plane of the magnetic orbital) and axial to the second (perpendicular to the magnetic orbital). Therefore this interaction should not be included in the proposed model. Thus, the possibility of evaluating three different magnetic pathways gives a more precise interpretation of the magnetic phenomena of the tetranuclear species (PUJNEN). This gives an advantage in identifying the dominant magnetic pathways as compared to the analysis done by Moubaraki et al.42 These authors used a simple dinuclear model, the Bleaney–Bowers expression, corrected by the Weiss constant, θ, as the interdimer interaction to describe the tetranuclear complex. Structure 9, which has six different exchange pathways, two including an auxiliary N,N-pyrazole-based ligand together with a 1,3-phosphate bridge gave calculated J values of −47.4 and −57.8 cm−1. As can be seen in Fig. 11, the overlap between the CuII centres and the pyrazole ligand has the largest surface size and a favourable directionality of the lobes of different signs, in contrast to that of the phosphate bridge; therefore, the pyrazole produces a large overlap, thus favouring antiferromagnetic behaviour. On the other hand, for the 1,3-phosphate, showing a poor overlap, it can be observed in Table S1‡ and Fig. 12 that the values of the D–P–O–Cu angles indicate that this interaction should be weak ferromagnetic.
The counter-complementarity of the orbitals will produce a predominant antiferromagnetic behaviour as shown by the calculated J values (Table 1). It is important to stress that the use of the overlap surfaces, generated from the UCOs allowed identifying the predominant exchange pathway in this bi-bridged moiety. The central phosphate bridge produces four different pure 1,3-phosphate exchange interactions with three positive J values (J = +3.2, +5.7 and +8.2 cm−1) and one negative one (J = −15.2 cm−1).
One of the three calculated exchange constants of 10 with the highest antiferromagnetic character (Cu–Cu distance of 4.136 Å; J = −27.5 cm−1) has pure-phosphate bridges in both 1,1- and 1,3-coordination mode simultaneously (Fig. 7). This structure contains four CuII centres interconnected through two {HPO4} ligands, each one linking three centres simultaneously. In this interaction, the directionality of the magnetic orbitals allows a favourable overlap between the CuII centres through the 1,1-coordination mode of the phosphate unit (Cu–O–Cu angle of 137.7°), involving to a lesser extent the 1,3-coordination mode. The calculated overlap function permitted demonstrating that the overlap in 10 was larger through the 1,1-phosphate bridge as compared to that through the 1,3-phosphate bridge, a fact that is impossible to infer from the experimental magnetization data.
In order to check the validity of the 2D correlation diagram with the magnetic data, all the exchange pathways through 1,3-phosphate were added to the diagram (Fig. 12). As stated above the change in the colour code of the ferromagnetic zone varies from weak ferromagnetic to a negligible magnetic interaction, thus the light pink colour indicates a borderline interaction between ferro- and antiferromagnetic interaction. As can be observed in the diagram PUCHIE-B (compound 8) is in the central area of light pink colour, being in the borderline situation. All the compounds included in the analysis in Fig. 12 have a magnetic pathway through the 1,3-phosphate bridge. Compound 4 has a multiple bridge interaction with two 1,1-PO4 and one 1,3-PO4. Using the analysis of the overlap surfaces obtained from the UCOs (Fig. 13), it becomes evident that only one 1,1-PO4 and the 1,3-PO4 bridges are participating in the exchange interaction. The Cu–O–Cu angle of the 1,1-PO4 bridge is 92.8°, thus based on the results of the 1,1-model a weak antiferromagnetic interaction is expected. Moreover, the 1,1-PO4 bridge is in the Jahn–Teller axis, thus the contribution to the overlap is negligible. On the other hand, the 1,3-PO4, which is in the basal plane of the copper centre, has the higher contribution to the magnetic exchange. The dihedral D–P–Oi–Cui angles of 155.3° and 161.4°, are, according to the 1,3-model, in the weak antiferromagnetic zone. This result is in agreement with the calculated J constant (−0.2 cm−1) (Fig. 12).
Compound 10 has three different exchange pathways, FIBKAD-i (one 1,3-PO4), FIBKAD-ii (one 1,3-PO4 and one 1,1-PO4) and FIBKAD-iii (two 1,3-PO4). The first pathway (FIBKAD-i) with a calculated ferromagnetic exchange (J = +0.7 cm−1) is in the 2D diagram in the ferromagnetic zone. For the second pathway, the surface analysis shows that both bridges are active in the transmission of the magnetic interaction, Fig. 14. The 1,1-PO4 has a Cu–O–Cu angle of 137.7° which produces a strong antiferromagnetic phenomenon (model 1,1; Fig. 3). Moreover the 1,3-PO4 bridge has dihedral angles of 183.9° and 19.9°, which correspond to a weak ferromagnetic interaction (less than +10 cm−1). Thus both simultaneous contributions corroborate the calculated J = −27.5 cm−1. The third exchange pathway has two 1,3-PO4 bridges, the first with dihedral angles of 100.6° and 61.2°, which produces strong antiferromagnetism as can be deduced from Fig. 11, while the second 1,3-PO4 bridge has dihedral angles of 145.9° and 61.2°, which corresponds to the limit of the antiferromagnetic zone (Fig. 12). Therefore both interaction are in agreement with the calculated J = −11.7 cm−1.
In summary, using the magnetostructural 1,1- and 1,3-phosphate coordination models and the obtained overlap surfaces from the UCOs, it was possible to explain the calculated J values of all analysed compounds.
4. Conclusions
For the symmetric and asymmetric 1,1-phosphate coordination models, a larger θ angle produces a larger overlap of the magnetic orbitals, leading to a stronger antiferromagnetic coupling. The symmetric model shows that the overlap interaction is more favourable than that obtained with the asymmetric one. In the case of the 1,3-phosphate coordination mode the proposed model using the τ dihedral angle allows a systematic study of the magnetic behaviour of experimental structures with phosphate bridges in this coordination mode. In the case of the reported species that have pyrazole auxiliary ligands along with a 1,3-phosphate bridge, the overlap surfaces obtained from the UCOs permitted the inference that these auxiliary ligands are responsible for the main antiferromagnetic interaction, and that the phosphate groups have a much weaker role in the transmission of the magnetic phenomenon.The used models have shown that antiferromagnetic exchange interactions are primarily produced by phosphate bridges, due to the different bonding modes of the ligand that always enable a degree of overlap between the magnetic orbitals.
The relative orientation of the basal planes of each copper centre is less relevant in the amount of exchange interaction, as the relative orientation of both Cu–O bonds is the determining key factor.
Acknowledgements
Authors acknowledge “Proyectos Basales and Vicerrectoría de Investigación, Desarrollo e Innovación” of Universidad de Santiago de Chile (USACH). Powered@NLHPC: this research was partially supported by the supercomputing infrastructure of the NLHPC (ECM-02). CEDENNA Center (FB0807) and IPMaG Anillo ACT 1404 are gratefully acknowleged. E. R. thanks Ministerio de Economía y Competitividad for grant CTQ2015-64579-C3-1-P and Generalitat de Catalunya for an ICREA Academia grant.References
- K. Darling and J. Zubieta, Inorg. Chim. Acta, 2013, 394, 512–518 CrossRef CAS.
- C. N. R. Rao, S. Natarajan, A. Choudhury, S. Neeraj and A. A. Ayi, Acc. Chem. Res., 2001, 34, 80–87 CrossRef CAS PubMed.
- A. A. Dar, S. Sen, S. K. Gupta, G. N. Patwari and R. Murugavel, Inorg. Chem., 2015, 54, 9458–9469 CrossRef CAS PubMed.
- H. Zhang, K. Yu, J. H. Lv, C. M. Wang, C. X. Wang and B. Bin Zhou, J. Solid State Chem., 2014, 217, 22–30 CrossRef CAS.
- A. K. Cheetham, G. Férey and T. Loiseau, Angew. Chem., Int. Ed., 1999, 38, 3268–3292 CrossRef CAS PubMed.
- S. K. Gupta, A. A. Dar, T. Rajeshkumar, S. Kuppuswamy, S. K. Langley, K. S. Murray, G. Rajaraman and R. Murugavel, Dalton Trans., 2015, 44, 5961–5965 RSC.
- B. Li, N. Jiang, J. Tian, T. Li, G. Hou and J. Zhang, Dalton Trans., 2014, 43, 9267 RSC.
- J. Huang, P.-Y. Liu, H. Zhu, S.-S. Bao, L.-M. Zheng and J. Ma, ChemPlusChem, 2012, 77, 1087–1095 CrossRef CAS.
- C. V. Krishnamohan Sharma, C. C. Chusuei, R. Clérac, T. Möller, K. R. Dunbar and A. Clearfield, Inorg. Chem., 2003, 42, 8300–8308 CrossRef CAS PubMed.
- C. Bellitto, E. M. Bauer and G. Righini, Inorg. Chim. Acta, 2008, 361, 3785–3799 CrossRef CAS.
- C. Bellitto, E. M. Bauer and G. Righini, Coord. Chem. Rev., 2015, 289–290, 123–136 CrossRef CAS.
- J. A. Sheikh, H. S. Jena, A. Clearfield and S. Konar, Acc. Chem. Res., 2016, 49, 1093–1103 CrossRef CAS PubMed.
- G. Nénert, U. Adem, E. M. Bauer, C. Bellitto, G. Righini and T. T. M. Palstra, Phys. Rev. B: Condens. Matter, 2008, 78, 54443 CrossRef.
- S. Khanra, S. Konar, A. Clearfield, M. Helliwell, E. J. L. McInnes, E. Tolis, F. Tuna and R. E. P. Winpenny, Inorg. Chem., 2009, 48, 5338–5349 CrossRef CAS PubMed.
- A. Iturrondobeitia, A. Goñi, I. Gil de Muro, L. Lezama, C. Kim, M. Doeff, J. Cabana and T. Rojo, Inorg. Chem., 2015, 54, 2671–2678 CrossRef CAS PubMed.
- N. Sharma, P. Serras, V. Palomares, H. E. A. Brand, J. Alonso, P. Kubiak, M. L. Fdez-Gubieda and T. Rojo, Chem. Mater., 2014, 26, 3391–3402 CrossRef CAS.
- B. Liu, Y. Xu, S.-S. Bao, X.-D. Huang, M. Liu and L.-M. Zheng, Inorg. Chem., 2016, 55, 9521–9523 CrossRef CAS PubMed.
- T.-H. Yang, E. S. Knowles, D. M. Pajerowski, J.-S. Xia, L. Yin, S. Gao, M. W. Meisel and L.-M. Zheng, Inorg. Chem., 2010, 49, 8474–8480 CrossRef CAS PubMed.
- E. Alda, S. Fernández, J. L. Mesa, J. L. Pizarro, V. Jubera and T. Rojo, Mater. Res. Bull., 2002, 37, 2355–2364 CrossRef CAS.
- D. Kong, Y. Li, X. Ouyang, A. V. Prosvirin, H. Zhao, J. H. Ross, K. R. Dunbar and A. Clearfield, Chem. Mater., 2004, 16, 3020–3031 CrossRef CAS.
- V. E. Campbell, M. Tonelli, I. Cimatti, J.-B. Moussy, L. Tortech, Y. J. Dappe, E. Rivière, R. Guillot, S. Delprat, R. Mattana, P. Seneor, P. Ohresser, F. Choueikani, E. Otero, F. Koprowiak, V. G. Chilkuri, N. Suaud, N. Guihéry, A. Galtayries, F. Miserque, M.-A. Arrio, P. Sainctavit and T. Mallah, Nat. Commun., 2016, 7, 13646 CrossRef CAS PubMed.
- S.-S. Bao and L.-M. Zheng, Coord. Chem. Rev., 2016, 319, 63–85 CrossRef CAS.
- K. Su, F. Jiang, J. Qian, Y. Gai, M. Wu, S. M. Bawaked, M. Mokhtar, S. A. AL-Thabaiti and M. Hong, Cryst. Growth Des., 2014, 14, 3116–3123 CAS.
- S. Ushak, E. Spodine, D. Venegas-Yazigi, E. Le Fur, J. Y. Pivan, O. Peña, R. Cardoso-Gil and R. Kniep, J. Mater. Chem., 2005, 15, 4529 RSC.
- E. Spodine, D. Venegas-Yazigi, S. Ushak, E. Le Fur and J.-Y. Pivan, Physica B: Condensed Matter, 2006, 384, 120–122 CrossRef CAS.
- S. Ushak, E. Spodine, D. Venegas-Yazigi, E. Le Fur and J. Y. Pivan, Microporous Mesoporous Mater., 2006, 94, 50–55 CrossRef CAS.
- S. Ushak, E. Spodine, E. Le Fur, D. Venegas-Yazigi, J. Pivan, W. Schnelle, R. Cardoso-Gil and R. Kniep, Inorg. Chem., 2006, 45, 5393–5398 CrossRef CAS PubMed.
- E. Spodine, D. Venegas-Yazigi, S. Ushak, V. Paredes-García, M. Saldias, E. Le Fur and J. Y. Pivan, Polyhedron, 2007, 26, 2121–2125 CrossRef CAS.
- D. Venegas-Yazigi, K. Muñoz-Becerra, E. Spodine, K. Brown, C. Aliaga, V. Paredes-García, P. Aguirre, A. Vega, R. Cardoso-Gil, W. Schnelle and R. Kniep, Polyhedron, 2010, 29, 2426–2434 CrossRef CAS.
- Y. Lu, E. Wang, Y. Guo, X. Xu and L. Xu, J. Mol. Struct., 2005, 737, 183–187 CrossRef CAS.
- R. P. Doyle, P. E. Kruger, B. Moubaraki, K. S. Murray and M. Nieuwenhuyzen, Dalton Trans., 2003, 4230 RSC.
- F.-F. Jian, Y.-P. Tong, H.-L. Xiao, P.-P. Sun and P.-S. Zhao, Acta Crystallogr., Sect. C: Cryst. Struct. Commun., 2004, 60, m348–m349 Search PubMed.
- H.-X. Liu, X. Jiang and Y. Liang, Acta Crystallogr., Sect. E: Struct. Rep. Online, 2007, 63, m1472–m1472 CAS.
- T. C. Davenport, H. S. Ahn, M. S. Ziegler and T. D. Tilley, Chem. Commun., 2014, 50, 6326 RSC.
- J. Yan, X. Zhao, J. Huang, K. Gong, Z. Han and X. Zhai, J. Solid State Chem., 2014, 211, 200–205 CrossRef CAS.
- S. L. Lambert, T. R. Felthouse and D. N. Hendrickson, Inorg. Chim. Acta, 1978, 29, L223–L224 CrossRef CAS.
- R. P. Doyle, T. Bauer, M. Julve, F. Lloret, J. Cano, M. Nieuwenhuyzen and P. E. Kruger, Dalton Trans., 2007, 5140–5147 RSC.
- F. H. Allen, Acta Crystallogr., Sect. B: Struct. Sci., 2002, 58, 380–388 CrossRef.
- H.-L. Zhu, L. Jin, D.-Y. Cheng and Y.-Q. Zheng, Inorg. Chim. Acta, 2012, 388, 37–45 CrossRef CAS.
- R. P. Doyle, M. Julve, F. Lloret, M. Nieuwenhuyzen and P. E. Kruger, Dalton Trans., 2006, 2081 RSC.
- E. W. Ainscough, A. M. Brodie, J. D. Ranford and J. M. Waters, J. Chem. Soc., Dalton Trans., 1997, 1251–1256 RSC.
- B. Moubaraki, K. S. Murray, B. Moubaraki, J. D. Ranford, X. Wang and Y. Xu, Chem. Commun., 1998, 353–354 RSC.
- L. Spiccia, B. Graham, M. T. W. Hearn, G. Lazarev, B. Moubaraki, K. S. Murray and E. R. T. Tiekink, J. Chem. Soc., Dalton Trans., 1997, 4089–4097 RSC.
- V. H. Crawford, H. W. Richardson, J. R. Wasson, D. J. Hodgson and W. E. Hatfield, Inorg. Chem., 1976, 15, 2107–2110 CrossRef CAS.
- E. Ruiz, P. Alemany, S. Alvarez and J. Cano, J. Am. Chem. Soc., 1997, 119, 1297–1303 CrossRef CAS.
- D. Venegas-Yazigi, D. Aravena, E. Spodine, E. Ruiz and S. Alvarez, Coord. Chem. Rev., 2010, 254, 2086–2095 CrossRef CAS.
- R. P. Doyle, P. E. Kruger, M. Julve, F. Lloret and M. Nieuwenhuyzen, CrystEngComm, 2002, 4, 13 RSC.
- A. T. Amos and G. G. Hall, Proc. R. Soc. London, Ser. A, 1961, 263, 483–493 CrossRef.
- H. F. King, J. Chem. Phys., 1967, 47, 1936 CrossRef CAS.
- D. Aravena and E. Ruiz, Chem. – Eur. J., 2011, 17, 8841–8849 CrossRef CAS PubMed.
- F. Neese, Wiley Interdiscip. Rev.: Comput. Mol. Sci., 2012, 2, 73 CrossRef CAS.
- An ab initio, DFT and semiempirical SCF-MO package-Version 3.0 Design and Scientific Directorship: F. Neese; Technical Directorship: F. Wennmohs, Max-Planck-Institute for Chemical Energy Conversion Stiftstr. 34-36, 45470 Mülheim a. d. Ruhr, Germany, tccec@mpi-mail.mpg.de. With contributions from: U. Becker, D. Bykov, D. Ganyushin, A. Hansen, R. Izsak, D. G. Liakos, C. Kollmar, S. Kossmann, D. A. Pantazis, T. Petrenko, C. Reimann, C. Riplinger, M. Roemelt, B. Sandhöfer, I. Schapiro, K. Sivalingam, B. Wezisla and contributions from our collaborators: M. Kallay, S. Grimme, E. Valeev, G. Chan.
- F. Weigend and R. Ahlrichs, Phys. Chem. Chem. Phys., 2005, 7, 3297 RSC.
- L. Noodleman, J. Chem. Phys., 1981, 74, 5737 CrossRef CAS.
- A. P. Ginsberg, J. Am. Chem. Soc., 1980, 102, 111–117 CrossRef CAS.
- A. Bencini and D. Gatteschi, J. Am. Chem. Soc., 1986, 108, 5763–5771 CrossRef CAS PubMed.
- E. Ruiz, J. Cano, S. Alvarez and P. Alemany, J. Comput. Chem., 1999, 20, 1391–1400 CrossRef CAS.
- A. D. A. Becke, J. Chem. Phys., 1993, 98, 5648 CrossRef CAS.
- E. Ruiz, A. Rodríguez-Fortea, J. Cano, S. Alvarez and P. Alemany, J. Comput. Chem., 2003, 24, 982–989 CrossRef CAS PubMed.
- M. Saldias, V. Paredes-Garcia, A. Vega, W. Cañon-Mancisidor, E. Le Fur, D. Venegas-Yazigi and E. Spodine, Polyhedron, 2012, 41, 120–126 CrossRef CAS.
- W. Cañon-Mancisidor, C. J. Gómez-García, G. M. Espallargas, A. Vega, E. Spodine, D. Venegas-Yazigi and E. Coronado, Chem. Sci., 2014, 5, 324 RSC.
- F. Neese, J. Phys. Chem. Solids, 2004, 65, 781–785 CrossRef CAS.
- O. Kahn and B. Briat, J. Chem. Soc., Faraday Trans. 2, 1976, 72, 268 RSC.
- O. Kahn and B. Briat, J. Chem. Soc., Faraday Trans. 2, 1976, 72, 1441 RSC.
- Y. Moreno, A. Vega, S. Ushak, R. Baggio, O. Peña, E. Le Fur, J.-Y. Pivan and E. Spodine, J. Mater. Chem., 2003, 13, 2381 RSC.
- P. Phuengphai, S. Youngme, C. Pakawatchai, G. A. van Albada, M. Quesada and J. Reedijk, Inorg. Chem. Commun., 2006, 9, 147–151 CrossRef CAS.
- S. Youngme, P. Phuengphai, N. Chaichit, C. Pakawatchai, G. A. van Albada, O. Roubeau and J. Reedijk, Inorg. Chim. Acta, 2004, 357, 3603–3612 CrossRef CAS.
- J. E. Barker, Y. Liu, N. D. Martin and T. Ren, J. Am. Chem. Soc., 2003, 125, 13332–13333 CrossRef CAS PubMed.
- R. Cao, P. Müller and S. J. Lippard, J. Am. Chem. Soc., 2010, 132, 17366–17369 CrossRef CAS PubMed.
- A. M. W. Cargill Thompson, D. A. Bardwell, J. C. Jeffery and M. D. Ward, Inorg. Chim. Acta, 1998, 267, 239–247 CrossRef CAS.
- M. Raidt, M. Neuburger and T. A. Kaden, Dalton Trans., 2003, 1292–1298 RSC.
- S. Youngme, P. Phuengphai, N. Chaichit, G. A. van Albada, O. Roubeau and J. Reedijk, Inorg. Chim. Acta, 2005, 358, 849–853 CrossRef CAS.
Footnotes |
| † Dedicated to Professor Barry Lever on the occasion of his 80th birthday. |
| ‡ Electronic supplementary information (ESI) available: Table S1 with structural parameters together with Fig. S1 with schemes of different Cu–O relative angles and Fig. S2 with the virtual cones formed by the scanning of the Cu–O angles. See DOI: 10.1039/c6qi00394j |
| This journal is © the Partner Organisations 2017 |

