
A copper–amyloid-β targeted fluorescent chelator as a potential theranostic agent for Alzheimer's disease†
Tao
Yang‡
a,
Liu
Yang‡
a,
Changli
Zhang
b,
Yanqing
Wang
c,
Xiang
Ma
d,
Kun
Wang
d,
Jian
Luo
a,
Cheng
Yao
*a,
Xiaoyong
Wang
*e and
Xiaohui
Wang
 *ad
*ad
aCollege of Chemistry and Molecular Engineering, Nanjing Tech University, Nanjing 211816, P. R. China. E-mail: wangxhui@njtech.edu.cn; yaocheng@njtech.edu.cn
bDepartment of Chemistry, Nanjing Xiaozhuang College, Nanjing, 210017, P. R. China
cInstitute of Applied Chemistry and Environmental Engineering, Yancheng Teachers University, Yancheng 224002, P. R. China
dState Key Laboratory of Coordination Chemistry, Nanjing University, Nanjing 210093, P. R. China
eState Key Laboratory of Pharmaceutical Biotechnology, School of Life Sciences; State Key Laboratory of Analytical Chemistry for Life Science, Nanjing University, Nanjing, 210093, P. R. China. E-mail: boxwxy@nju.edu.cn
First published on 7th October 2016
Abstract
Alzheimer's disease (AD) is a neurodegenerative disease and is still incurable. Traditional therapies use diagnostic and therapeutic drugs separately, which is unfavourable for exploring the pathology of AD and optimizing the efficacy of drugs. Theranostic agents that combine diagnosis and targeted therapy could overcome the weakness of current approaches through the complementary action between the two functions. Owing to the intense relevance to AD pathogenesis, metal-associated amyloid-β (Aβ) species have been considered as the primary targets for anti-AD. We herein report a fluorescent chelator (BTTA) as a potential theranostic agent for both attenuating and fluorescence imaging of Cu2+-induced Aβ aggregation in the AD brain. Considerable evidence shows that BTTA is able to specifically target Cu2+-associated Aβ aggregates and capture Cu2+ ions to attenuate the aggregates and their neurotoxicity. Most notably, the disaggregation of Cu2+–Aβ aggregates can be monitored by the fluorescence changes of BTTA from both buffer and brain homogenates of AD mice. Moreover, BTTA can also be used to visually detect the Aβ aggregates via fluorescence imaging of slices of brain tissues from AD mice and is verified to penetrate the blood brain barrier of mice in vivo. These findings suggest that BTTA would provide a promising strategy to develop potential theranostic tools for AD.
Introduction
Theranostics, incorporating both diagnostic and therapeutic functions into a single platform, is a new concept aiming at simultaneous diagnostic imaging, treatment, and assessment of therapeutic efficacy in real-time.1 In contrast to conventional separate diagnostic and therapeutic agents, theranostics have exhibited sizable advantages to improve biodistribution and targeted efficacy, thereby minimizing adverse side effects in the treatment of the fatal diseases such as cancer and cardiovascular diseases.2,3 Unfortunately, only a few nanoparticle-based examples are currently plausible for Alzheimer's disease (AD),4 which is a devastating neurodegenerative disorder, the most common form of dementia worldwide, and incurable so far.5 Moreover, almost all of them are limited by poor reproducibility, targeting selectivity, and blood brain barrier (BBB) permeability.6 Alternatively, small molecules have more potential as theranostic agents for AD, because they could be more easily modified to acquire the desired properties and overcome the weakness of nanoparticles.7 Even so, due to the complicated mechanism of AD pathology, it is still a big challenge to develop target-specific small-molecular theranostics for AD currently.Amyloid-β (Aβ) aggregation is one of the primary pathological hallmarks of AD.8 Various Aβ aggregates, containing soluble oligomers and insoluble fibrils, especially oligomers, have been considered to promote neurodegeneration.9 Nevertheless, no traditional Aβ-targeted drug has reached its desired value to benefit patient, illustrating that just targeting Aβ seems deficient for AD treatment.10 The accumulations of metal ions (e.g., copper, zinc, and iron) within amyloid plaques are tightly associated with AD pathogenesis.11,12 For example, Cu2+–Aβ complexes can accelerate Aβ aggregation and generate oxidative stress, resulting in neuronal cell death, synaptic dysfunction, and cognitive impairment.13–15 Therefore, considering metal dyshomeostasis and neurotoxicity of Aβ aggregates, targeting metal–Aβ species associated with both metal ions and Aβ would be valuable for small-molecular theranostics of AD.16 Recently, some Aβ imaging probes have been developed to inhibit metal-induced Aβ aggregation.17–20 However, some common shortcomings such as lack of specific target and inability to distinguish metal-associated Aβ aggregates from various Aβ species make them unreliable as theranostic agents for AD.
Aβ-targeted chelators can specifically regulate the metal-induced Aβ aggregation and neurotoxicity through removing metal ions from Aβ aggregates.21–23 Recently, a fluorescent chelator has been reported by our group to target and disassemble Zn2+ or Cu2+-associated Aβ aggregates, and simultaneously self-monitor the metal–Aβ disaggregation by fluorescence changes.24 It offers significant potential for a functionalized chelator as small-molecular theranostics targeting metal–Aβ aggregates. Encouraged by the pioneering work, we herein report a new dual-purpose fluorescent chelator (BTTA) as both the attenuator and fluorescence imaging probe for Cu2+-associated Aβ aggregates in the AD brain (Fig. 1). BTTA consists of a cyclen group as the modulating unit and the benzothiazole aniline (BTA) group as the imaging unit. Cyclen possesses high attenuation efficacy for metal-induced Aβ aggregation according to the previously reported results.24–28 The BTA group, a derivative of the amyloid-binding fluorescent dye thioflavin T (ThT), was selected owing to its high binding affinity for Aβ species and efficient quantum yield (QY) for fluorescence imaging caused by the substitution of the 4′ position with the NH group.29 Furthermore, the amide linkage extends the distance between the two functional groups thereby abating the effect of photoinduced electron transfer (PET) of secondary amines of cyclen to the BTA group.30 As a result, BTTA may give no fluorescence response to most of the metal ions. However, Cu2+ could still quench the fluorescence of BTTA due to its strong paramagnetic nature,31 which may result in the high selectivity of BTTA for Cu2+. A synergistic effect between the two functional groups is also supposed to elevate the target-specific theranostic properties of BTTA. The synthesis and characterization of BTTA are described in the ESI (Scheme S1 and Fig. S1–S3†). As expected, BTTA could specifically target and disassemble Cu2+-associated Aβ aggregates, and visually monitor the disaggregation via fluorescence imaging in the brain of AD mice. Furthermore, BTTA is able to suppress the neurotoxicity of Cu2+–Aβ species in living cells and penetrate the BBB of mice in vivo. Thus, BTTA can serve as a potential theranostic agent of Cu2+-induced Aβ aggregation in AD mice.
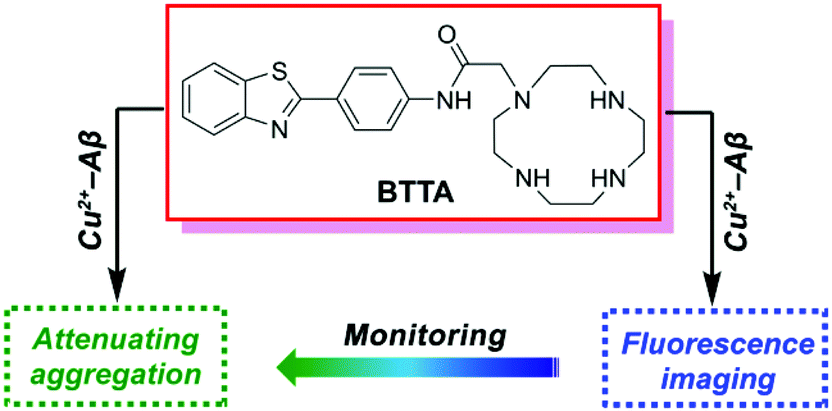 | ||
| Fig. 1 The structure and design principle of BTTA. | ||
Results and discussion
Interactions of BTTA with Cu2+-associated Aβ aggregates
The binding properties of BTTA with Cu2+ were first identified by fluorescence titration experiments. Cu2+ can significantly reduce the fluorescence of BTTA with formation of a 1![[thin space (1/6-em)]](https://www.rsc.org/images/entities/char_2009.gif) :1 metal complex, owing to its quenching effect of a strong paramagnetic nature (Fig. S4A, ESI†).31 The conditional association constant (Ka) of BTTA for Cu2+ was calculated to be 3.46 × 10¹⁰ M−1, which is sufficient to capture Cu2+ from Aβ species, but not enough for the competition with Cu-metalloenzymes.11 The detection limit (3σ/slope) of BTTA for Cu2+ was also determined to be 114 nM (Fig. S5, ESI†). As predicted, due to the subtle PET quenching effect from the cyclen group to the BTA group caused by the long distance between them, BTTA provides little fluorescence response to Zn2+, the most abundant metal ion in Aβ aggregates (Fig. S6, ESI†).32 In addition, the other metal ions show no interference in the recognition of Cu2+ as well by competition experiments (Fig. S7, ESI†). These results indicate that BTTA can specifically recognize Cu2+ with high sensitivity and binding affinity, supporting the reactivity of BTTA for Cu2+–Aβ species (vide infra).
:1 metal complex, owing to its quenching effect of a strong paramagnetic nature (Fig. S4A, ESI†).31 The conditional association constant (Ka) of BTTA for Cu2+ was calculated to be 3.46 × 10¹⁰ M−1, which is sufficient to capture Cu2+ from Aβ species, but not enough for the competition with Cu-metalloenzymes.11 The detection limit (3σ/slope) of BTTA for Cu2+ was also determined to be 114 nM (Fig. S5, ESI†). As predicted, due to the subtle PET quenching effect from the cyclen group to the BTA group caused by the long distance between them, BTTA provides little fluorescence response to Zn2+, the most abundant metal ion in Aβ aggregates (Fig. S6, ESI†).32 In addition, the other metal ions show no interference in the recognition of Cu2+ as well by competition experiments (Fig. S7, ESI†). These results indicate that BTTA can specifically recognize Cu2+ with high sensitivity and binding affinity, supporting the reactivity of BTTA for Cu2+–Aβ species (vide infra).
Based on the above findings, we next tried to determine the binding properties of BTTA with Cu2+-induced and Cu2+-free Aβ40 aggregates. Considering that ThT can specifically bind with fibrillar Aβ aggregates to give off strong fluorescence,33 the ThT fluorescence competition assay was initially performed by addition of BTTA to the solution of Aβ40 fibrils in the presence of ThT. A clearer decrease of ThT–Aβ fluorescence upon addition of BTTA is observed in the solution of Cu2+-associated Aβ aggregates than that of Cu2+-free Aβ aggregates (Fig. S8, ESI†). Moreover, the fluorescence of ThT per se hardly changes with increasing amounts of BTTA (Fig. S9, ESI†), implying that BTTA may possess higher binding affinity for Cu2+-associated than Cu2+-free Aβ40 aggregates by competing with similar binding sites of ThT in Aβ aggregates, due to the similar structure of the BTA group of BTTA and ThT. The inhibition constant (Ki) of BTTA in the presence of Cu2+ was determined to be 0.77 μM, which further consolidates the high affinity of BTTA for Cu2+-associated Aβ aggregates.34
In order to better understand the binding mode of BTTA with Aβ40 species, docking studies were further carried out using AutoDock4.35Fig. 2 depicts the lowest energy conformation of BTTA with monomeric and fibrillar Aβ40, respectively. In the case of Aβ40 monomers, the BTA group is positioned in the central hydrophobic residues (Asn27, Ala30, Ile31, Leu34, and Met35) (Fig. 2A), which is similar to ThT,36 while the cyclen group occupies the N-terminal of the peptide, which is anchored by hydrogen bonding of amino moieties with the side chains of Asp1, Ala2, Glu3, and Asp23 (Fig. 2B). Interestingly, the BTA group remains located in the central hydrophobic residues (30–34 regions) of Aβ40 fibrils (Fig. 2C), along with the hydrogen bonding interactions between the cyclen group and Ile31. The interaction energies between BTTA and involved amino acids of Aβ40 monomers or fibrils are listed in Table S1 (ESI†). BTTA apparently displays higher binding affinity for fibrils than the monomer according to the lower MolDock and ReRank scores.37 The simulation results imply that hydrophobic interactions of the BTA group with Aβ at the similar binding sites of ThT dominate the binding mode between BTTA and Aβ40, which is consistent with the result of the ThT fluorescence competition assay. However, once BTTA interacts with Cu2+–Aβ species, besides the hydrophobic interactions, the strong coordination interactions between the cyclen group and Cu2+ ions from the aggregates could inevitably be triggered by the Cu2+ specific nature of BTTA. As a result, the two different types of interactions may bring about a synergistic effect to cause the higher affinity of BTTA for Cu2+-associated Aβ aggregates. This deduction was further confirmed by ESI-MS (Fig. S10 and Table S2, ESI†). No peaks of BTTA–Aβ40 adducts are observed after the coincubation of Aβ40 with BTTA, which is probably due to the instability of BTTA–Aβ40 formed by weak noncovalent interactions. Conversely, when BTTA reacts with Aβ40 and Cu2+, new peaks at m/z 886.92, 1098.00 and 1108.67 appear, which are assigned to the Cu2+–Aβ40 adducts. Moreover, two additional peaks (m/z = 1208.00 and 1217.17) corresponding to BTTA–Cu2+–Aβ40 adducts were also observed. Obviously, the presence of Cu2+ facilitates the binding affinity of BTTA for Aβ. In short, BTTA exhibits high affinity and selectivity for Cu2+-associated Aβ aggregates governed by the synergistic effect of the two functional moieties.
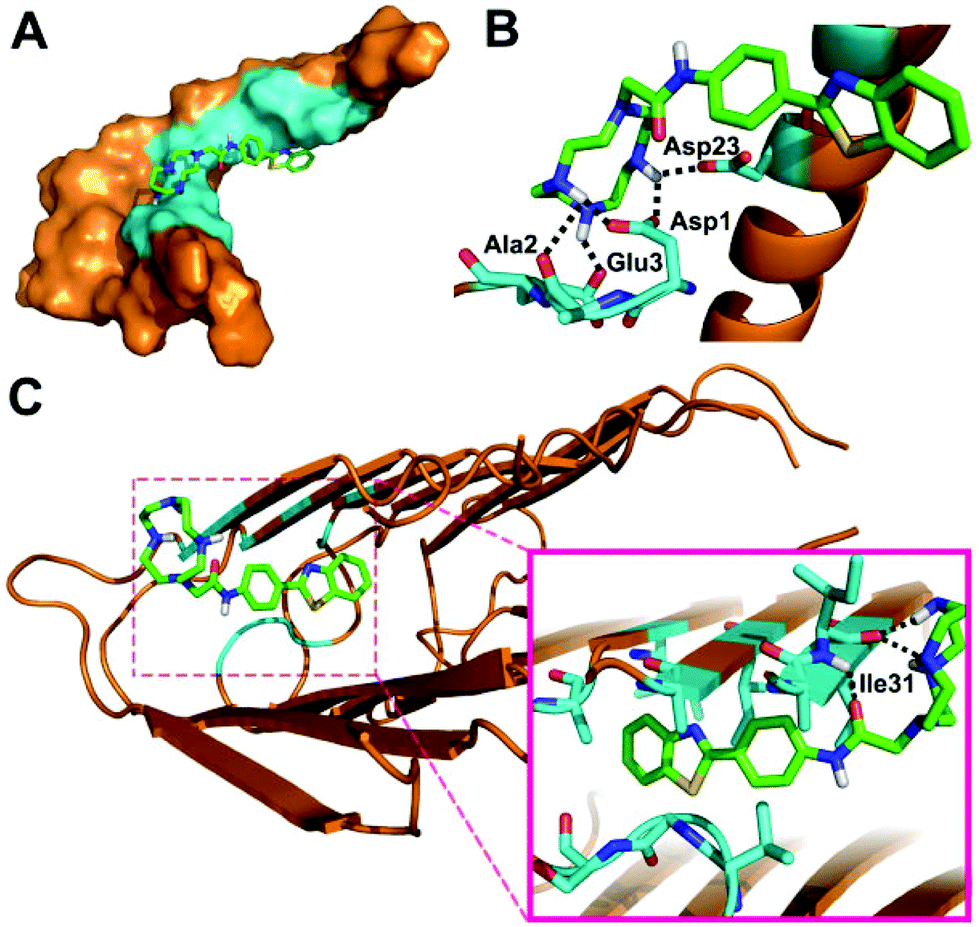 | ||
| Fig. 2 Lowest energy docked conformation of BTTA to Aβ40 monomers (PDB: 1BA4) in surface (a) and cartoon (b) representations, and fibrils (PDB: 2LMO) in cartoon (c) representation. The responsive amino acid residues are shown in cyan. Possible hydrogen bonds are highlighted by black dashed lines. | ||
Attenuating Cu2+-induced Aβ aggregation and neurotoxicity
Confirming the specific binding properties of BTTA for Cu2+-associated Aβ aggregates, the attenuating effect of BTTA on Cu2+-induced Aβ aggregation was further examined. For this purpose, Cu2+–Aβ species were prepared beforehand by short (10 min) and long (24 h) incubation times in buffer at 37 °C, respectively. The capacity of BTTA to disassemble Cu2+-associated Aβ aggregates was measured after the coincubation of BTTA with preformed Cu2+–Aβ species. Using the turbidity assay, the absorbance/turbidity at 405 nm (A405) of the samples was monitored to reflect the degree of Aβ aggregation.27 As shown in Fig. S11A (ESI†), the presence of BTTA can significantly reduce the turbidity of the solution of Cu2+–Aβ species with the total incubation time of 24 h and 48 h, respectively. Moreover, a lower turbidity is observed in 24 h than in 48 h incubation time, which most likely results from the easier disassembly of meager preformed Cu2+–Aβ aggregates by shorter preincubation time. The Micro BCA assay was further used to measure the content of soluble Aβ species in the supernatant of the reaction samples after removing the aggregated peptide by centrifugation. The samples treated with Cu2+ have only 58% and 55% soluble Aβ species for 24 h and 48 h incubation times, respectively, while those containing BTTA have greater than 80% soluble Aβ for both 24 h and 48 h incubation times (Fig. S11B, ESI†). These data correlate well with the turbidity assay and show that BTTA is able to disaggregate Cu2+-associated Aβ aggregates. To consolidate the above observations, circular dichroism (CD) spectroscopy was employed to provide conformational evidence. As shown in Fig. 3A, BTTA can strikingly reverse the Cu2+-induced Aβ aggregation according to the conversion of secondary structures from negative bands at 218 nm minimum associated with β-sheet structures to positive bands centred at 215 nm, characteristic of random coil conformations,24,38 which are more apparent for 24 h relative to 48 h incubation time. The result indicates that the relative population of β-sheet structures is significantly diminished by BTTA. Furthermore, the transmission electron microscopy (TEM) assay verifies that BTTA can transform the massive preformed Cu2+-associated Aβ aggregates into small amounts of amorphous species (Fig. 3B). In contrast, similar to ThT,33 BTTA can scarcely affect the Cu2+-free Aβ aggregates for both incubation times of 24 h and 48 h in the turbidity and Micro BCA assays (Fig. S12, ESI†), which further confirms that the replacement of ThT by BTTA rather than Aβ disaggregation results in the decrease of ThT fluorescence in the ThT fluorescence competition assay. Thus, BTTA could specifically attenuate Cu2+-induced over Cu2+-free Aβ aggregation. The chelation of the cyclen group with Cu2+ is the predominant interaction to capture Cu2+ ions from Cu2+-bound Aβ aggregates thereby attenuating the aggregation. The interactions between the BTA group and Aβ aggregates are also indispensable, which intensively cooperate with the chelating interaction to contribute the target-specific Cu2+-associated Aβ disaggregation.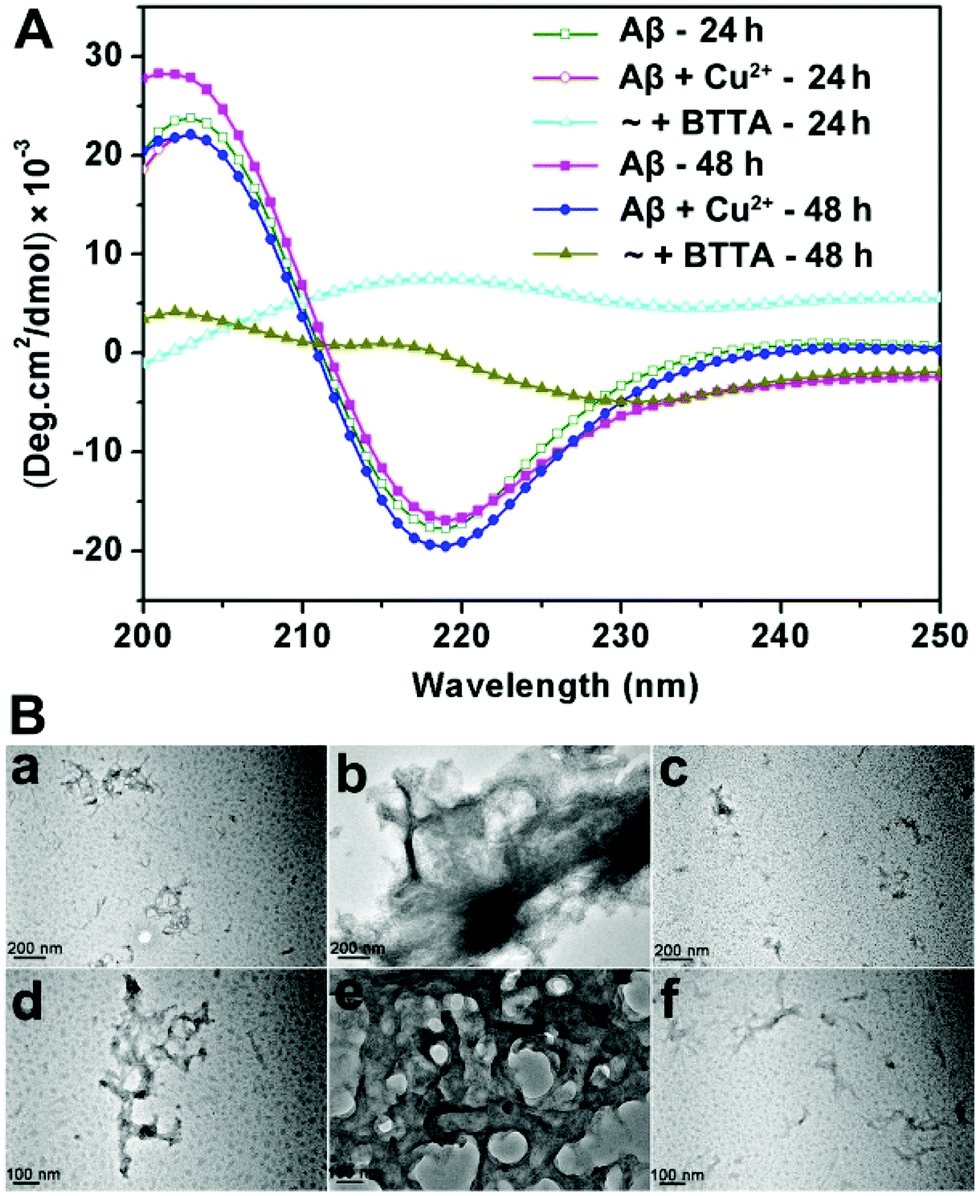 | ||
| Fig. 3 (A) The attenuation of Cu2+-induced Aβ40 aggregates by BTTA with different incubation times using CD measurement. (B) TEM images of Aβ40 species with 24 h (upper row) and 48 h (lower row) incubation times: a and d, Aβ; b and e, Aβ + Cu2+; c and f, Aβ + Cu2+ + BTTA. | ||
Taking into account its excellent properties toward Cu2+-associated Aβ aggregation in buffer, we next investigated the effect of BTTA on Cu2+–Aβ-induced neurotoxicity in PC12 cells by a MTT assay. The differentiated PC12 cells by nerve growth factor were chosen because of their sensitivity to the neurotoxicity of Aβ aggregation.39 As shown in Fig. S13A (ESI†), more than 85% cell survival is observed for cells treated with up to 20 μM BTTA, Cu2+, or Cu2+–BTTA complex, implying minimal toxicity of the compounds under such conditions. The viabilities of cells treated with Aβ40 (10 μM) alone or in the presence of Cu2+ (20 μM) are ca. 59% or ca. 43%, respectively, while a remarkable increase of cell viability is observed upon coincubation of BTTA (10 μM) with Aβ40 in the presence of Cu2+ (Fig. S13B, ESI†), likely due to the decrease of fibrils and oligomers containing β-sheet conformers, as observed by CD spectroscopy (Fig. 3A). Overall, these results suggest that BTTA is able to not only specifically attenuate Cu2+-induced Aβ aggregation but also detoxify Cu2+–Aβ-induced neurotoxicity in vitro.
Theranostic effect of BTTA on Cu2+-associated Aβ aggregates
The fluorescence responses of BTTA to the attenuation of Cu2+-induced Aβ aggregation in buffer were first explored. Preformed Cu2+–Aβ aggregates were incubated with BTTA and the degree of aggregates was determined by turbidity during incubation. As shown in Fig. 4, the fluorescence of BTTA dramatically decreases with the incubation time up to 5 h, thereafter, a plateau is observed. In the meantime, the turbidity is also time-dependently decoupled in synchronization with the fluorescence changes of BTTA, which means that the preformed Cu2+–Aβ aggregates can be gradually disassembled by BTTA. Surprisingly, a good linear correlation between the fluorescence intensity of BTTA and turbidity in the range of 0–5 h was figured out in Fig. S14 (ESI†), forcefully indicating that BTTA is capable of self-monitoring the Cu2+-associated Aβ disaggregation via the fluorescence changes. More importantly, because BTTA exhibits an efficient QY (0.18) in Tris-HCl buffer, the time-dependent fluorescence changes of BTTA are clearly visible to the naked eye under a UV lamp (365 nm), where the blue emission is quenched by degrees (inset of Fig. 4). After 5 hours, the solution is almost nonluminous, similar to that of the Cu2+–BTTA complex. In contrast, there are almost no fluorescence response and attenuation effects of BTTA on Cu2+-free Aβ aggregates during coincubation (Fig. S15, ESI†). These overall results strongly confirm that the capture of Cu2+ by BTTA from Cu2+–Aβ aggregates not only disassembles the aggregates, but also reduces the fluorescence intensity of BTTA synchronously. Consequently, the disaggregation could be visually monitored by the fluorescence imaging of BTTA.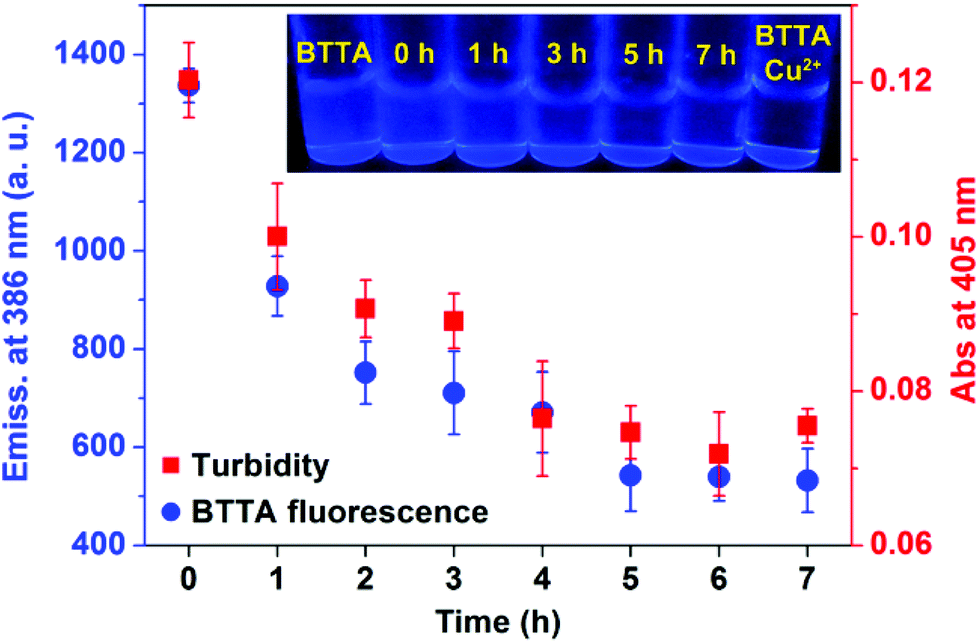 | ||
| Fig. 4 Fluorescence emission intensity at 386 nm of BTTA (20 μM, λex = 318 nm) and turbidity (A405) of performed Cu2+–Aβ40 aggregates solution in the presence of BTTA after incubation for different periods of time (n = 3). Inset: fluorescence images of BTTA in the presence of preformed Cu2+–Aβ40 aggregates under a UV lamp at 365 nm for different incubation time points. BTTA and Cu2+–BTTA complex are controls. | ||
Encouraged by the above findings, we further investigated the theranostic effect of BTTA on the Cu2+-associated Aβ aggregates in the brain of APPswe/PSEN1 transgenic mice. The ability of BTTA to combat Aβ aggregates from the AD brain was initially determined by native gel electrophoresis/western blot assay. As shown in Fig. 5, compared with control samples (lanes 1 and 3), considerable decreases of high molecular weight (MW) Aβ species in the range of 26–95 kDa are visualized in the BTTA-treated brain tissue of AD mice (lanes 2 and 4), accompanied by an increase of low MW Aβ species (<17 kDa), respectively. Quantitative analysis of Aβ species under 55 kDa by using ImageJ further consolidated the above observation (Fig. S16, ESI†). The results demonstrate that BTTA is able to disassemble Aβ aggregates from the AD brain, which probably result from the sequestration of Cu2+ from Cu2+-associated Aβ aggregates. This assumption was verified by the fluorescence decrease of BTTA upon reaction with brain homogenates of the AD mice without any interference of auto-fluorescence from the homogenates (Fig. S17, ESI†), which is stronger than that in the brain homogenates of wild-type mice (Fig. S18, ESI†). Obviously, owing to the high concentration of Cu2+ in the brain of AD mice40 and the low detection limit of BTTA, the chelation of Cu2+ is probably conducive to the fluorescence quenching of BTTA. Therefore, BTTA can also target and attenuate Cu2+-associated Aβ aggregates from the brain of AD mice, accompanied by synchronous fluorescence changes.
 | ||
| Fig. 5 Disassembly of BTTA (20 μM) against Aβ aggregates from the brain homogenates of APPswe/PSEN1 transgenic (Tg) mice by native gel electrophoresis using western blotting with an anti-Aβ antibody 6E10. Lanes 1 and 3 are brain homogenates controls of two 6-month-old Tg mice, respectively; lanes 2 and 4 are homogenates corresponding to the two Tg mice incubated with BTTA, respectively. Glyceraldehyde-3-phosphate dehydrogenase (GAPDH) was used as the internal reference to ensure equal protein loading. | ||
The imaging behavior of BTTA was then studied on brain slices of the same AD mice model using laser confocal fluorescence microscopy. Thioflavin S (ThS) was employed as the standard plaque-staining agent for the colocalization assay.41 As shown in Fig. 6, distinct fluorescence spots of Aβ plaques are observed after staining with BTTA (yellow arrowhead). The distribution pattern is highly consistent with that of ThS staining. In contrast, the brain sections from the age-matched wild-type mice (C57BL/6J) show no such staining (Fig. S19, ESI†), indicating that BTTA is capable of specifically targeting Aβ aggregates from the brain of AD mice. The results vigorously imply that BTTA could be used to visually detect the content of Aβ aggregates from the brain of AD mice via fluorescence imaging ex vivo. Taken together, BTTA exhibits efficient ability to self-monitor the disaggregation of Cu2+-associated Aβ aggregates caused by itself via fluorescence changes and imaging, and can be potentially used as the theranostic agent against Cu2+-induced Aβ aggregation in vitro.
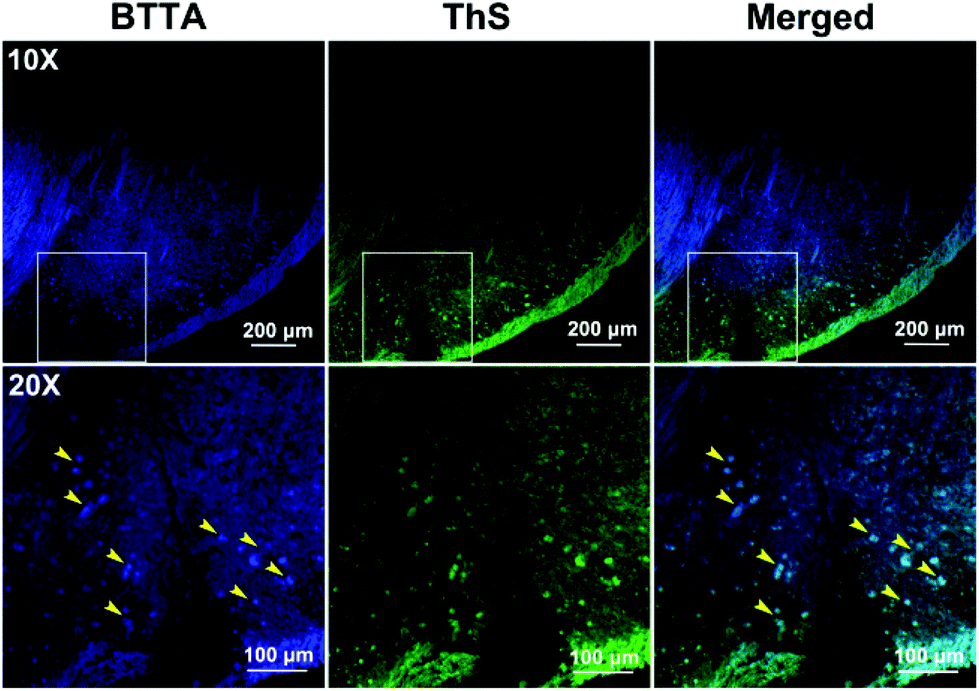 | ||
| Fig. 6 Histological staining of BTTA (100 μM) on the brain slices from APPswe/PSEN1 transgenic mice by using a laser confocal microscope. Magnification: top, 10×; bottom, 20× (region highlight in the top panel). The adjunct brain sections were stained with ThS. | ||
Blood brain barrier (BBB) permeability
BBB permeability is indispensable for agents aiming at central nervous system diseases.42 Based on the calculated values, BTTA satisfies the restrictive terms of Lipinski's rules,43 suggesting that BTTA can potentially cross the BBB (Table S3, ESI†). To confirm the predicted BBB penetration ability, we further treated C57BL/6J mice with BTTA (4 mg kg−1, n = 3) via intravenous injection in vivo. The brain homogenates were analyzed by high-performance liquid chromatography (HPLC) at different times after dosing. The same retention time (8.125 min) of BTTA in extractions can be recorded with control and standard samples (Fig. S20, ESI†), indicating that BTTA is stable and intact in vivo. Quantitative analysis further discovers that the concentration of BTTA rapidly increases to its peak level (ca. 191.008 μg kg−1) in the brain at 10 min post-injection followed by a relatively slow decrease (inset of Fig. S20B, ESI†). Additionally, ca. 1.551 μg kg−1 of BTTA is still observed after 60 min dosing. Furthermore, the fluorescence signal of BTTA can be also measured in the extractions even after 60 min post-injection, which validates the result of HPLC (Fig. S21, ESI†). Overall, both the calculated and in vivo results illustrate that BTTA is able to steadily penetrate the BBB and could be bioavailable in the potential utilities for AD in vivo.Experimental
Reagents and materials
All reagents in the synthesis were commercial products and used as received unless otherwise stated. Anhydrous CH3CN was used followed by distillation and purification. Human Aβ40 was obtained from GL Biochem Ltd (Shanghai, China). Copper chloride and thioflavin T (ThT) were purchased from Sigma-Aldrich. Stock solution of Aβ40 was prepared according to the literature method.27 Stock solution of BTTA (5 mM) was obtained by dissolving the chelator in dimethyl sulfoxide (DMSO) and filtered by using a 0.22 μm filter (organic system). All solutions and buffers were prepared using Milli-Q water, and filtered through a 0.22 μm filter (Millipore) before use. C57BL/6J mice and APPswe/PSEN1 transgenic mice were purchased from the Model Animal Research Center of Nanjing University (MARC). All animal experiments were conducted in accordance with the National Institutes of Health “Guide for the Care and Use of Laboratory Animals” and were approved by the Institutional Animal Care and Use Committee of MARC.Methods
1H and 13C NMR spectra were recorded on a Bruker DRX-400 spectrometer. Electrospray ionization mass spectroscopy (ESI-MS) was carried out with an LCQ Fleet electrospray mass spectrometer. Elemental analysis was performed on a CHNO-Rapid analyzer (Heraeus, Germany). Circular dichroism (CD) spectra were obtained by using a JASCO J-810 automatic recording spectropolarimeter (Tokyo, Japan). UV-vis spectra were acquired on a Shimadzu UV-3600 UV-VIS-NIR spectrophotometer. Fluorescence spectra were obtained on a HORIBA Fluoromax-4P fluorescence spectrometer. Turbidity, ThT, and BCA assays were determined on a Varioskan Flash microplate reader (Thermo Scientific). Transmission electron microscopy (TEM) images were recorded on a transmission electron microscope (JEOL, JEM-2100 LaB6). High-performance liquid chromatography (HPLC) was conducted on a Agilent1260 Infinity Quaternary LC system.Synthesis of BTTA
:2) and dried to afford the final product BTTA (0.268 g, yield: 61%). 1H NMR (DMSO-d6, 400 MHz, δ, ppm): 8.13 (d, 1H, J = 8.0 Hz, benzothiazole), 8.07 (d, 2H, J = 8.8 Hz, Ph), 8.02 (d, 1H, J = 8.0 Hz, benzothiazole), 7.89 (d, 2H, J = 8.8 Hz, Ph), 7.54 (t, 1H, J = 7.2 Hz, benzothiazole), 7.45 (t, 1H, J = 7.2 Hz, benzothiazole), 3.59 (s, 2H, –CH2–), 3.01 (brs, 4H, –CH2–), 2.96 (brs, 8H, –CH2–), 2.83 (brs, 4H, –CH2–). 13C NMR (DMSO-d6, 100 MHz, δ, ppm): 170.81, 166.94, 153.59, 141.53, 134.25, 127.86, 127.76, 126.57, 126.26, 119.84, 55.96, 49.66, 45.18, 44.68. IR (νmax, cm−1): 3420, 3286, 3132, 2920, 2816, 1723, 1665, 1406, 1040, 759. ESI-MS found (calcd) for C23H30N6OS (m/z): 439.58 (439.22) [M + H]+. Elemental analysis found (calcd) for C23H30N6OS (%): C, 62.67 (62.99); H, 6.55 (6.89); N, 19.02 (19.16).
Quantum yield measurements
The fluorescence quantum yield of BTTA was measured in aqueous solution (20 mM Tris-HCl, 150 mM NaCl, 8‰ v/v DMSO, pH 7.4) by using anthracene (Φs = 0.31 in methanol) as the standard sample. The fluorescence quantum yield (Φ) of BTTA was calculated by eqn (1):45| Φx/Φs = [As/Ax][Fx/Fs][nx2/ns2] | (1) |
Metal binding experiments
The fluorescence titrations of BTTA (λex = 318 nm) were determined by adding aliquots of 2.4 μL of CuCl2 aqueous solution (5 mM) to 3 mL of BTTA solution (40 μM, 20 mM Tris-HCl, 150 mM NaCl, 8‰ v/v DMSO, pH 7.4) in a cuvette. The apparent association constant (aKa) for the binding of BTTA (2 μM, λex = 318 nm) with Cu2+ was calculated to be 8.58 × 10⁵ M−1 by nonlinear fitting with eqn (2) (Fig. S4B, ESI†):46| (F − Fmin)/(Fmax − F) = aKaCMn | (2) |
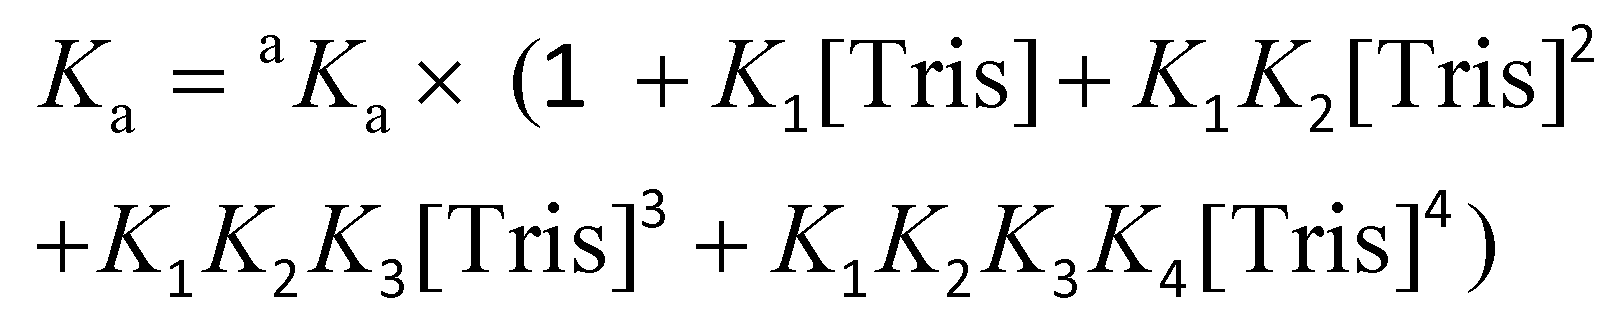
The conditional association constant (Ka) was obtained from the apparent association constant aKa with correction factors by taking into account the competitive coordination of the Cu2+ ion to the Tris buffer. Eqn (3) was used to measure the conditional Ka according to the literature:47
 | (3) |
The detection limit (3σ/slope) of BTTA for Cu2+ was obtained according to the literature method,46 and the minimum linear range of BTTA for Cu2+ is shown in Fig. S5 (ESI†). The fluorescence responses of BTTA (40 μM, λex = 318 nm) to different metal ions (40 μM) were collected in buffer (20 mM Tris-HCl, 150 mM NaCl, 8‰ v/v DMSO, pH 7.4) at 25 °C.
Aβ binding experiments
| Ki = IC50/(1 + [ThT]/Kd) | (4) |
Attenuation of Cu2+-induced Aβ aggregation assays
For all experiments described herein, the same reaction concentration (20 μM) of Aβ40, Cu2+, and BTTA was adopted and the final concentration of DMSO was 4‰. Each sample solution (199.2 μL, 20 mM Tris-HCl/150 mM NaCl, pH 7.4) consisting of Aβ40 and Cu2+ was incubated at 37 °C for 5 min or 24 h, respectively. Then, BTTA (0.8 μL, 5 mM) solution was added followed by incubation at 37 °C for further 24 h. The degree of Aβ aggregation was studied by turbidimetry, Micro BCA protein assay, CD spectroscopy, and TEM. These assays were carried out as described in the literature.24,25Cytotoxicity assay
The cytotoxicity was performed by a MTT assay with PC12 cells, via the cleavage of MTT to purple formazan crystals by cell mitochondrial dehydrogenases. Briefly, PC12 cells were differentiated by 1 ng mL−1 nerve growth factor (NGF) to obtain the neuronal differentiated cells. Then the differentiated PC12 cells were seeded in a 96-well flat bottomed microplate at 6000 cells per well and incubated for 24 h at 37 °C in a humidified atmosphere with 5% CO2. Then, Aβ40 (10 μM) or/and Cu2+(20 μM) were added to the tissue at 37 °C for 15 min, followed by addition of BTTA (10 μM, final DMSO concentration 1%). 1% (v/v) DMSO was added to wells containing BTTA, Cu2+, or BTTA plus Cu2+ (1:1 ratio) at different concentrations (2, 5, 10, 20, 40, and 80 μM, respectively) without Aβ40 for cytotoxicity controls and to untreated wells for a cell viability control. After incubation at 37 °C for 24 h, 50 μL MTT reagent (5 mg mL−1) was added to each sample solution. The samples were re-incubated for 4 h at 37 °C in a humidified atmosphere with 5% CO2. Then the supernatants were removed, and the formazan crystals were dissolved in 300 μL DMSO. The absorbance at 490 nm was determined using a Varioskan Flash microplate reader.
Self-monitoring of disaggregation of Cu2+-associated Aβ aggregates
Aβ40 (20 μM) was incubated with Cu2+ (20 μM) in buffer (20 mM Tris-HCl, 150 mM NaCl, pH 7.4) at 37 °C for 24 h. BTTA (final concentration 20 μM, 4‰ v/v DMSO) was added to the preformed Cu2+-associated Aβ aggregate solutions, followed by further incubation at 37 °C for 1, 2, 3, 4, 5, and 6 h, respectively. Each sample was measured by the turbidimetry assay (A405) and fluorescence spectroscopy of BTTA (λex = 318 nm, λem = 386 nm). The fluorescence images of solution at different incubation time points were captured by using a camera (Nikon D5200) under UV light (365 nm).Western blot analysis of brain homogenates
The extract of the APPswe/PSEN1 transgenic mice brain (6-month-old, male) was prepared according to the literature reported method.52 Each sample was treated based on the literature method.24 Bands were visualized with SuperSignal (Thermo Scientific Inc.). The membranes were then reprobed with glyceraldehyde-3-phosphate dehydrogenase (GAPDH), which was used as the internal reference to ensure equal protein loading. The fluorescence of BTTA (20 μM, λex = 318 nm) in brain homogenates was also conducted at 37 °C with different incubation times (0, 2, 4, 6, 12 and 24 h). The age-matched C57BL/6J mice were treated as the control by the same procedures.Fluorescent staining of Aβ plaques in transgenic mouse brain sections
Paraffin-embedded brain sections from transgenic mice (C57BL/6J, APPswe/PSEN1, 11 months old, male, 6 μm) were used for histological staining. The brain slices were deparaffinized by a 15 min wash in xylene, a 5 min wash in ethanol, a 2 min wash in 95% ethanol/H2O, a 1 min wash in 85% ethanol/H2O, a 1 min wash in 70% ethanol/H2O, a 2 min wash in 50% ethanol/H2O, and a 2 min wash in dd water. After that, the brain sections were incubated with BTTA in dd water (100 μM, 2% DMSO) for 30 min and then washed with 40% ethanol/H2O. The localization of Aβ plaques was confirmed by staining the adjacent sections with thioflavin-S (0.1% in dd water, a common dye for staining Aβ plaques). Finally, the sections were washed with 40% ethanol/H2O for 5 min. Fluorescent observation was performed using an LSM-710 (Zeiss, Germany) equipped with DAPI, AF488, AF546, and Cy5 filter sets. Additionally, slices from age-matched normal mice (C57BL/6J, 11 months, female) were treated following the same procedures as blank controls.Brain uptake assay
Both control and treatment groups contained three mice (C57BL/6J, female, 8–10 weeks old). Briefly, each mouse was given BTTA (4 mg kg−1, dissolved in a 10:90 DMSO/H2O mixture, 200 μL) via tail vein injection. Then mice were sacrificed after 2, 10, 30, and 60 min, and the brain tissue was collected and rinsed with cold PBS. The brain tissue was diluted with water (600 μL) and homogenized. The homogenate was mixed with MeOH (1400 μL) and centrifuged. The supernatants were filtered (0.22 μm) and concentrated to 70 μL. A 20 μL sample was subjected to HPLC analysis using a C18 reverse-phase column (250 mm × 4.6 mm) (Agilent). The mobile phase was a MeOH/H2O mixture (70:30, v/v). The flow rate was 1 mL min−1. The absorption wavelength was 318 nm. For the control experiment: C57BL/6J mice were sacrificed and the brains were removed. 200 μL of the solution of BTTA was directly injected into the brains (n = 3) and incubated for 1 h at 37 °C, and then treated by the previous procedures. The standard was obtained by analysis of the solution of BTTA (200 μL diluted to a mixture of methanol and water). The blood brain barrier penetration ability of BTTA was also investigated by recording the fluorescence spectra of each sample (λex = 318 nm) described above.
Conclusions
In summary, we have rationally designed a fluorescent chelator (BTTA) by integrating modulating and imaging functions into a single framework for Cu2+-induced Aβ aggregation. BTTA is able to specifically target and attenuate Cu2+-associated Aβ aggregates in brain homogenates of AD mice, which can be visualized by fluorescence imaging of the chelator. Moreover, BTTA also exhibits the ability to detoxify the neurotoxicity of Cu2+–Aβ aggregates and penetrate the BBB. Given the specific target, the dual-functional effect, and BBB permeability, BTTA would hold a promise as a potential theranostic agent and pave the way for dual-functional small molecules targeting both metal ions and Aβ for AD diagnosis and therapy. Due to the short fluorescence wavelength, BTTA would be limited in the bioimaging of Aβ aggregates in vivo. However, the promising in vitro theranostic potential of BTTA toward Cu2+–Aβ aggregates warrants pursuit of structural optimizations that would improve the viability of such dual-functional scaffolds for diagnosis and therapeutic evaluation through in vivo imaging. Further structural modifications for longer fluorescence emissions or even near-infrared emission with an acceptable penetration depth are ongoing in our group.Acknowledgements
We appreciate financial support from the National Natural Science Foundation of China (Grant: 21301090, 21401106, 21571154, and 21271101), the Natural Science Foundation of Jiangsu Province (Grant: BK20130923, BK20140090, and BK20161315), the Natural Science Foundation of the Jiangsu Higher Education Institutions of China (Grant: 14KJB150011), and the Jiangsu Government Scholarship for Overseas Studies. We also thank Prof. Guiquan Chen (MARC, Nanjing University) for generous supply of the brain slices.Notes and references
- R. Kumar, W. S. Shin, K. Sunwoo, W. Y. Kim, S. Koo, S. Bhuniya and J. S. Kim, Chem. Soc. Rev., 2015, 44, 6670–6683 RSC.
- J. R. McCarthy, Adv. Drug Delivery Rev., 2010, 62, 1023–1030 CrossRef CAS PubMed.
- S. S. Kelkar and T. M. Reineke, Bioconjugate Chem., 2011, 22, 1879–1903 CrossRef CAS PubMed.
- P. Hassanzadeh, Biomed. Rev., 2014, 25, 25–34 CrossRef.
- L. Mucke, Nature, 2009, 461, 895–897 CrossRef CAS PubMed.
- J. K. Sahni, S. Doggui, J. Ali, S. Baboota, L. Dao and C. Ramassamy, J. Controlled Release, 2011, 152, 208–231 CrossRef CAS PubMed.
- M. Staderini, M. A. Martín, M. L. Bolognesi and J. C. Menéndez, Chem. Soc. Rev., 2015, 44, 1807–1819 RSC.
- D. J. Selkoe, Science, 2012, 337, 1488–1492 CrossRef CAS PubMed.
- T. P. Knowles, M. Vendruscolo and C. M. Dobson, Nat. Rev. Mol. Cell Biol., 2014, 15, 384–396 CrossRef CAS PubMed.
- S. Ayton, P. Lei and A. I. Bush, Neurotherapeutics, 2015, 12, 109–120 CrossRef CAS PubMed.
- P. Faller and C. Hureau, Dalton Trans., 2009, 1080–1094 RSC.
- A. S. Pithadia and M. H. Lim, Curr. Opin. Chem. Biol., 2012, 16, 67–73 CrossRef CAS PubMed.
- G. Arena, G. Pappalardo, I. Sovago and E. Rizzarelli, Coord. Chem. Rev., 2012, 256, 3–12 CrossRef CAS.
- P. Faller, C. Hureau and O. Berthoumieu, Inorg. Chem., 2013, 52, 12193–12206 CrossRef CAS PubMed.
- J. Nasica-Labouze, P. H. Nguyen, F. Sterpone, O. Berthoumieu, N.-V. Buchete, S. Coté, A. De Simone, A. J. Doig, P. Faller and A. Garcia, Chem. Rev., 2015, 115, 3518–3563 CrossRef CAS PubMed.
- K. J. Barnham and A. I. Bush, Chem. Soc. Rev., 2014, 43, 6727–6749 RSC.
- X. Zhang, Y. Tian, Z. Li, X. Tian, H. Sun, H. Liu, A. Moore and C. Ran, J. Am. Chem. Soc., 2013, 135, 16397–16409 CrossRef CAS PubMed.
- X. Zhang, Y. Tian, P. Yuan, Y. Li, M. A. Yaseen, J. Grutzendler, A. Moore and C. Ran, Chem. Commun., 2014, 50, 11550–11553 RSC.
- B. Muthuraj, S. Layek, S. Balaji, V. Trivedi and P. K. Iyer, ACS Chem. Neurosci., 2015, 6, 1880–1891 CrossRef CAS PubMed.
- Y. Li, D. Xu, S.-L. Ho, H.-W. Li, R. Yang and M. S. Wong, Biomaterials, 2016, 94, 84–92 CrossRef CAS PubMed.
- J.-S. Choi, J. J. Braymer, R. P. Nanga, A. Ramamoorthy and M. H. Lim, Proc. Natl. Acad. Sci. U. S. A., 2010, 107, 21990–21995 CrossRef CAS PubMed.
- A. K. Sharma, S. T. Pavlova, J. Kim, D. Finkelstein, N. J. Hawco, N. P. Rath, J. Kim and L. M. Mirica, J. Am. Chem. Soc., 2012, 134, 6625–6636 CrossRef CAS PubMed.
- S. Lee, X. Zheng, J. Krishnamoorthy, M. G. Savelieff, H. M. Park, J. R. Brender, J. H. Kim, J. S. Derrick, A. Kochi, H. J. Lee, C. Kim, A. Ramamoorthy, M. T. Bowers and M. H. Lim, J. Am. Chem. Soc., 2013, 136, 299–310 CrossRef PubMed.
- T. Yang, X. Wang, C. Zhang, X. Ma, K. Wang, Y. Wang, J. Luo, L. Yang, C. Yao and X. Wang, Chem. Commun., 2016, 52, 2245–2248 RSC.
- X. Wang, X. Wang, C. Zhang, Y. Jiao and Z. Guo, Chem. Sci., 2012, 3, 1304–1312 RSC.
- W. Wu, P. Lei, Q. Liu, J. Hu, A. P. Gunn, M. Chen, Y. Rui, X. Su, Z. Xie, Y.-F. Zhao, A. I. Bush and Y. Li, J. Biol. Chem., 2008, 283, 31657–31664 CrossRef CAS PubMed.
- T. Chen, X. Wang, Y. He, C. Zhang, Z. Wu, K. Liao, J. Wang and Z. Guo, Inorg. Chem., 2009, 48, 5801–5809 CrossRef CAS PubMed.
- P. Gonzalez, V. C. da Costa, K. Hyde, Q. Wu, O. Annunziata, J. Rizo, G. Akkaraju and K. N. Green, Metallomics, 2014, 6, 2072–2082 RSC.
- S. Noël, S. Cadet, E. Gras and C. Hureau, Chem. Soc. Rev., 2013, 42, 7747–7762 RSC.
- E. A. Majzoub, C. Cadiou, I. Déchamps-Olivier, B. Tinant and F. Chuburu, Inorg. Chem., 2011, 50, 4029–4038 CrossRef PubMed.
- H. S. Jung, P. S. Kwon, J. W. Lee, J. I. Kim, C. S. Hong, J. W. Kim, S. Yan, J. Y. Lee, J. H. Lee and T. Joo, J. Am. Chem. Soc., 2009, 131, 2008–2012 CrossRef CAS PubMed.
- M. G. Savelieff, A. S. DeToma, J. S. Derrick and M. H. Lim, Acc. Chem. Res., 2014, 47, 2475–2482 CrossRef CAS PubMed.
- L. P. Jameson, N. W. Smith and S. V. Dzyuba, ACS Chem. Neurosci., 2012, 3, 807–819 CrossRef CAS PubMed.
- A. Lockhart, L. Ye, D. B. Judd, A. T. Merritt, P. N. Lowe, J. L. Morgenstern, G. Hong, A. D. Gee and J. Brown, J. Biol. Chem., 2005, 280, 7677–7684 CrossRef CAS PubMed.
- G. M. Morris, R. Huey, W. Lindstrom, M. F. Sanner, R. K. Belew, D. S. Goodsell and A. J. Olson, J. Comput. Chem., 2009, 30, 2785–2791 CrossRef CAS PubMed.
- A. A. Reinke and J. E. Gestwicki, Chem. Biol. Drug Des., 2011, 77, 399–411 CAS.
- A. J. Veloso, A. M. Chow, H. V. Ganesh, N. Li, D. Dhar, D. C. Wu, S. Mikhaylichenko, I. R. Brown and K. Kerman, Anal. Chem., 2014, 86, 4901–4909 CrossRef CAS PubMed.
- K. Rajasekhar, S. Suresh, R. Manjithaya and T. Govindaraju, Sci. Rep., 2015, 5, 8139 CrossRef CAS PubMed.
- M. Li, S. E. Howson, K. Dong, N. Gao, J. Ren, P. Scott and X. Qu, J. Am. Chem. Soc., 2014, 136, 11655–11663 CrossRef CAS PubMed.
- K. P. Kepp, Chem. Rev., 2012, 112, 5193–5239 CrossRef CAS PubMed.
- M. Cui, M. Ono, H. Watanabe, H. Kimura, B. Liu and H. Saji, J. Am. Chem. Soc., 2014, 136, 3388–3394 CrossRef CAS PubMed.
- W. M. Pardridge, Alzheimer's Dementia, 2009, 5, 427–432 CrossRef PubMed.
- H. Van De Waterbeemd and E. Gifford, Nat. Rev. Drug Discovery, 2003, 2, 192–204 CrossRef CAS PubMed.
- N. Saini, R. Varshney, A. K. Tiwari, A. Kaul, M. Allard, M. Ishar and A. K. Mishra, Dalton Trans., 2013, 42, 4994–5003 RSC.
- K. Hanaoka, K. Kikuchi, H. Kojima, Y. Urano and T. Nagano, J. Am. Chem. Soc., 2004, 126, 12470–12476 CrossRef CAS PubMed.
- X. Wang, T. Yang, J. Luo, L. Yang and C. Yao, Chem. Commun., 2015, 51, 8185–8188 RSC.
- L. Q. Hatcher, L. Hong, W. D. Bush, T. Carducci and J. D. Simon, J. Phys. Chem. B, 2008, 112, 8160–8164 CrossRef CAS PubMed.
- C. Yung-Chi and W. H. Prusoff, Biochem. Pharmacol., 1973, 22, 3099–3108 CrossRef.
- M. J. Frisch, G. W. Trucks, H. B. Schlegel, G. E. Scuseria, M. A. Robb, J. R. Cheeseman, G. Scalmani, V. Barone, B. Mennucci, G. A. Petersson, H. Nakatsuji, M. Caricato, X. Li, H. P. Hratchian, A. F. Izmaylov, J. Bloino, G. Zheng, J. L. Sonnenberg, M. Hada, M. Ehara, K. Toyota, R. Fukuda, J. Hasegawa, M. Ishida, T. Nakajima, Y. Honda, O. Kitao, H. Nakai, T. Vreven, J. A. Montgomery Jr., J. E. Peralta, F. Ogliaro, M. Bearpark, J. J. Heyd, E. Brothers, K. N. Kudin, V. N. Straroverov, R. Kobayashi, J. Normand, K. Raghavachari, A. Rendell, J. C. Burant, S. S. Iyengar, J. Tomasi, M. Cossi, N. Rega, J. M. Millam, M. Klene, J. E. Knox, J. B. Cross, V. Bakken, C. Adamo, J. Jaramillo, R. Gomperts, R. E. Stratmann, O. Yazyev, A. J. Austin, R. Cammi, C. Pomelli, J. W. Ochterski, R. L. Martin, K. Morokuma, V. G. Zakrzewski, G. A. Voth, P. Salvador, J. J. Dannenberg, S. Dapprich, A. D. Daniels, Ö. Farkas, J. B. Foresman, J. V. Ortiz;J. Cioslowski and D. J. Fox, Gaussian 09 Revision D.01. 2009, Gaussian. Inc., Wallingford, CT, 2013 Search PubMed.
- M. Coles, W. Bicknell, A. A. Watson, D. P. Fairlie and D. J. Craik, Biochemistry, 1998, 37, 11064–11077 CrossRef CAS PubMed.
- A. T. Petkova, W.-M. Yau and R. Tycko, Biochemistry, 2006, 45, 498–512 CrossRef CAS PubMed.
- T. Bolmont, F. Clavaguera, M. Meyer-Luehmann, M. C. Herzig, R. Radde, M. Staufenbiel, J. Lewis, M. Hutton, M. Tolnay and M. Jucker, Am. J. Pathol., 2007, 171, 2012–2020 CrossRef CAS PubMed.
Footnotes |
| † Electronic supplementary information (ESI) available: Experimental details and additional figures, tables, and scheme. See DOI: 10.1039/c6qi00268d |
| ‡ These authors contributed equally. |
| This journal is © the Partner Organisations 2016 |