DOI:
10.1039/C6QI00260A
(Research Article)
Inorg. Chem. Front., 2016,
3, 1306-1316
Structure–property relationships in hybrid (C3H5N2)3[Sb2I9] and (C3H5N2)3[Bi2I9] isomorphs†
Received
19th July 2016
, Accepted 21st August 2016
First published on 22nd August 2016
Abstract
Two hybrid crystals imidazolium iodoantimonate(III) and iodobismuthate(III), (C3H5N2)3[Sb2I9] (ImIA) and (C3H5N2)3[Bi2I9] (ImIB), have been synthesized and characterized in a wide temperature range (100–350 K) by means of X-ray diffraction, dielectric spectroscopy, proton magnetic resonance (1H NMR), FT-IR spectroscopy and optical observations. They undergo two temperature induced solid–solid structural phase transitions. The first one, quasi-continuous (with temperature hysteresis below 1 K), occurs at 324 K in ImIA and 327 K in ImIB, and the second one, clearly of the first order, at 273/278 (cooling/heating) and 291/295 K, in ImIA and ImIB, respectively. Ferroelastic properties are maintained in low-temperature phases. Both materials are isomorphic in the corresponding phases. High temperature phase I has a hexagonal P63/mmc symmetry, and phase II has orthorhombic Cmcm. The crystal architecture is composed of discrete, face-sharing bioctahedra [M2I9]3− (M: Sb, Bi) and imidazolium cations which are highly disordered over phases I and II. The dynamics of the imidazolium cations has a prominent impact on the stability of the particular phases.
Introduction
For the past nearly twenty years numerous alkylammonium and heteroaromatic haloantimonates(III) and halobismuthates(III) have been attracting great interest because of their promising nonlinear electric (ferroelectrics) and nonlinear optical (NLO) properties.1–8 The majority of such ferroelectrics found so far crystallize with the R3M2X9![[thin space (1/6-em)]](https://www.rsc.org/images/entities/char_2009.gif) 9–11 or R5M2X1112–14 chemical compositions. The R3M2X9 salts exhibit four forms of the anionic substructure: 2D structure, infinite one dimensional chains (1D), discrete bioctahedra (0D) or isolated [M4X18]4− groups.15 The ferroelectric properties occur in the structures with the 2D units. The anionic framework of R5M2X11 is built up exclusively of discrete bioctahedra, [M2X11]5− and all the salts with this stoichiometry exhibit ferroelectric properties. The ferroelectricity in both R3M2X9 and R5M2X11 subclasses results from an orientational ordering of dipolar organic cations associated with an enhanced electric polarizability of the anionic substructures.
9–11 or R5M2X1112–14 chemical compositions. The R3M2X9 salts exhibit four forms of the anionic substructure: 2D structure, infinite one dimensional chains (1D), discrete bioctahedra (0D) or isolated [M4X18]4− groups.15 The ferroelectric properties occur in the structures with the 2D units. The anionic framework of R5M2X11 is built up exclusively of discrete bioctahedra, [M2X11]5− and all the salts with this stoichiometry exhibit ferroelectric properties. The ferroelectricity in both R3M2X9 and R5M2X11 subclasses results from an orientational ordering of dipolar organic cations associated with an enhanced electric polarizability of the anionic substructures.
In recent years, a new class of photovoltaic organic–inorganic perovskite-like materials have started to gain increasing attention. The chemical formula of these layered hybrid compounds is given by (CH3NH3)[MX3] (M = Sn, Pb and X = Cl, Br, I).16–20 Their general traits are a good charge carrier mobility, high absorption coefficient and tailored electronic parameters. The best characterized and the most promising for applications (solar cells) is (CH3NH3)[PbI3].16 Its serious drawback is, however, a content of toxic lead. In the search for new, less harmful materials, bismuth-based derivatives have been, thus, explored. In particular, methylammonium iodobismuthate(III) (CH3NH3)3[Bi2I9] has been reported as a new potential absorber for photovoltaics.21–24 It crystallizes in the space group P63/mmc of a hexagonal system. Its structure consists of discrete [Bi2I9]3− bioctahedra and highly disordered methylammonium cations. Guanidinium analogs, [C(NH2)3]3[Sb2I9]25 and [C(NH2)3]3[Bi2I9],25 exhibiting a complex sequence of phase transitions, appear to be isomorphic to (CH3NH3)3[Bi2I9]26 in the high-temperature disordered phases. Since [C(NH2)3]3[Bi2I9] shows structural similarities to its methylammonium analogs one can expect promising properties useful, e.g., in photovoltaics.
Similar halogenoantimonates(III) and halogenobismuthates(III) based on the guanidinium crystallize with three different chemical compositions: R2MX5, R3M2X9 and R3MX6.27–29 The findings concerning (CH3NH3)3[Bi2I9] and its guanidinium analogs have motivated us to extend the study on other R3M2I9 iodide compounds to check how the replacement of the guanidinium or methylammonium cations by imidazolium modifies the structure and ferroicity of the compound.
The aim of the present paper is to give an account of the physicochemical properties of two new ferroic materials containing imidazolium cations and iodobismuthate(III) and iodoantimonate(III) anions, respectively. We present here the results of single-crystal X-ray diffraction, the proton magnetic resonance (spin–lattice relaxation T1) and FT-IR as a function of temperature. We also report on our studies of thermal properties (differential scanning calorimetry (DSC)) of (C3H5N2)3[Sb2I9] (ImIA) and (C3H5N2)3[Bi2I9] (ImIB). The microscopic mechanism of the ferroic phase transitions is discussed.
Results and discussion
Thermal properties
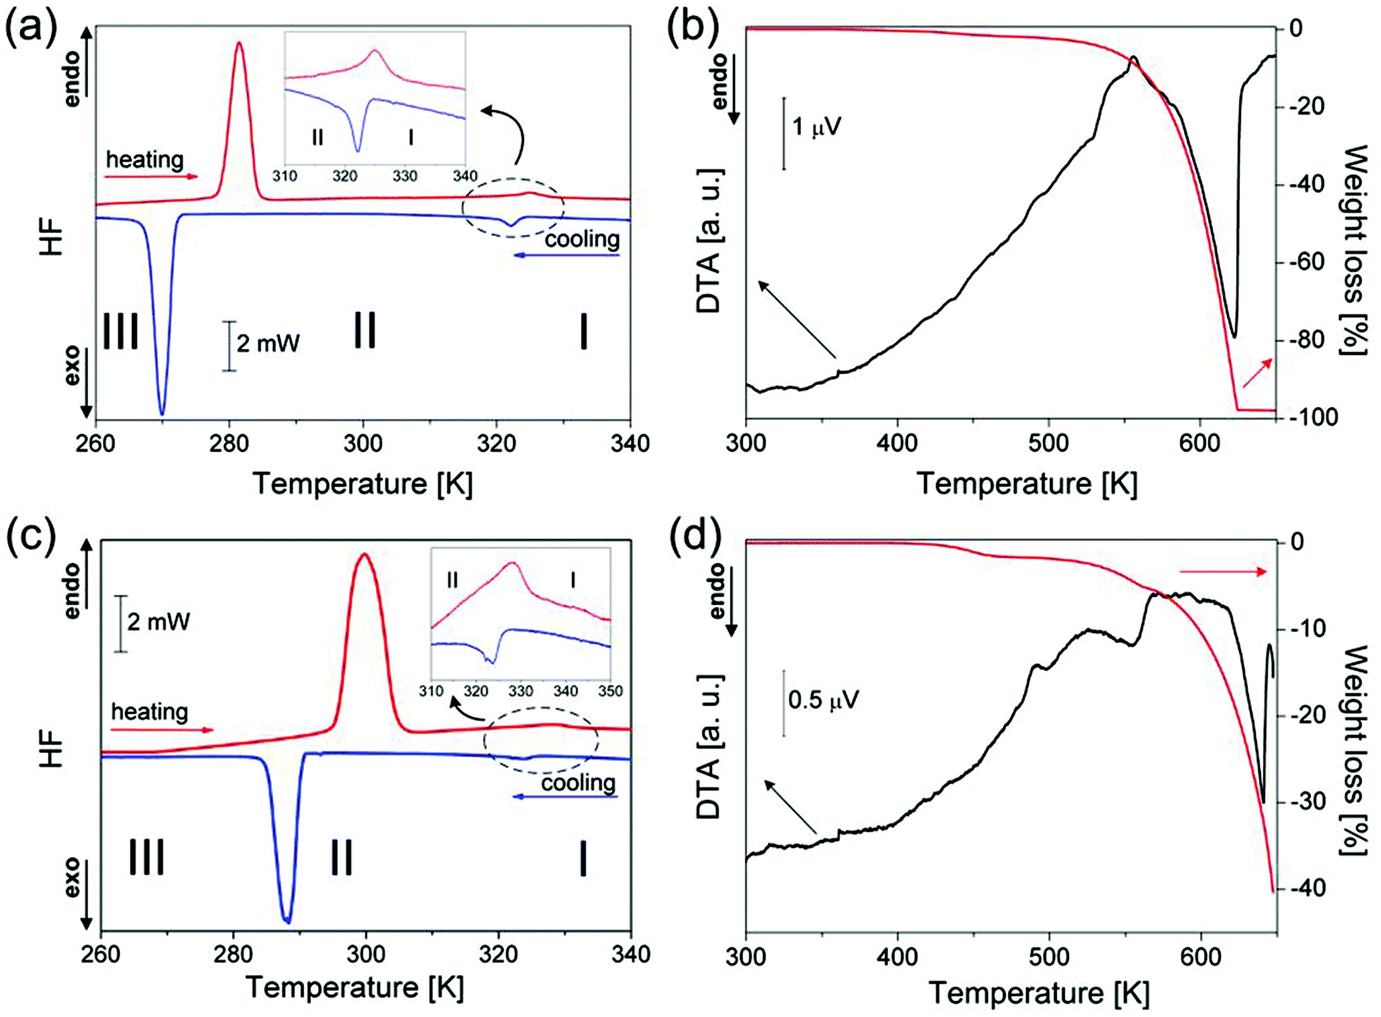
The thermal properties of ImIA and ImIB were studied by means of DSC, TGA, and DTA. DSC traces on cooling and heating are presented in Fig. 1(a) and (c) for ImIA and ImIB, respectively. The sequence of phase transitions (PTs) on heating/cooling is characterized by two, well reproducible and reversible peaks. The first thermal anomaly, at high temperatures, was assigned in both compounds to structural apparently continuous PTs: at 324 K in ImIA and 327 K in ImIB. The temperature hysteresis extrapolated to the scanning rate of 0 K min−1 in both cases was found to be narrower than 1 K. This quasi-continuous PT separates the high-temperature phase I from phase II. The second anomaly gives clear evidence of a first order PT between phases II and III at 278/273 and 295/291 K, in ImIA and ImIB, respectively. The magnitude of the transition entropy accompanying the PT III → II was estimated to be ΔStr = 32 J mol−1 K−1 for ImIB and ΔStr = 33 J mol−1 K−1 for ImIA. These values indicate an order–disorder mechanism of the III → II PT. Simultaneous Thermogravimetric Analysis (TGA) and Differential Thermal Analysis (DTA) shown in Fig. 1(b) and (d) reveal that ImIA and ImIB are thermally stable up to about 420–440 K. Above this temperature, they decompose continuously without any visible melting point.
 |
| | Fig. 1 (a) and (c) DSC traces during heating and cooling cycles for ImIA and ImIB, respectively (scan rate: 10 K min−1); (b) and (d) simultaneous curves of thermogravimetric analysis and differential thermal analysis (2 K min−1). | |
Crystal structure
The crystal structures of ImIA and ImIB are isomorphic in the corresponding phases. The compounds crystallize, at ambient temperature, in the orthorhombic system with Cmcm symmetry and transform to the hexagonal P63/mmc at 324 K (ImIA) and 327 K (ImIB). The PT from the P63/mmc to Cmcm space group is of the ‘equitranslational’ type, i.e. some symmetry elements are eliminated but the set of translations is retained. The volume and the base vectors of the primitive orthorhombic cell correspond to those of the hexagonal phase.
The volume of the unit cell (non-primitive) in the Cmcm structure is, however, doubled due to the C-centering. The hexagonal cell is transformed to the orthorhombic one by the matrix [1−10 110 001] and the relationship between the magnitude of the new and old lattice parameters is as follows:  . Fig. 2 illustrates the unit cells and the crystal packing in both phases.
 |
| | Fig. 2 The crystal structure of ImIA in the high temperature phase I, T = 445 K, P63/mmc (a); in the low-temperature phase II, T = 298 K, Cmcm (b). [Sb2I9]3− bioctahedra are drawn in orange. At the bottom of simplified models of disordered imidazolium cations are presented in both phases with the c direction emphasized. The in-plane rotations of A and B imidazolium in phase II and hydrogen atoms in both phases have been omitted for the picture clarity. | |
The anionic substructure is built of discrete, face-sharing [M2I9]3− bioctahedra with M–I distances and I–M–I angles characteristic of this type of compound.15,30,31 The ‘trans’ effect32,33 observed in halogenoantimonates(III) and halogenobismuthates(III) is preserved in both phases of ImIA and ImIB. The bridging M–Ib bonds are considerably longer than the terminal M–It distances. The difference of M–I distance Δd ∼ 0.35 Å for ImIA and Δd ∼ 0.30 Å for ImIB at room temperature (see Table 1) is conserved in the PT, also the I–M–I angles do not change significantly. Thus, the bioctahedra are stable in both phases and experience only minor distortion reflecting the site symmetry reduction from D3h (its centre of gravity is at c 6(–)m2) in the hexagonal phase to C2v (the centre of gravity is at c m2m).
Table 1 Selected geometric structural parameters (Å, °) for the title crystals
| ImIA |
ImIB |
| 445 K |
298 K |
350 K |
298 K |
| Symmetry code(s): i −y + 1, x − y + 1, z; ii −x + y, −x + 1, z; iii −x + y, −x + 2, z; iv −y + 2, x − y + 2, z; v −x + y, y, −z + 1/2; vi −x, y, z; vii −x, y, −z + 1/2; viiix, y, −z + 1/2. |
| Sb1–I1 |
2.884(2) |
Sb1–I3 |
2.890(2) |
Bi1–I1 |
2.941(2) |
Bi1–I3 |
2.950(2) |
| Sb1–I1i |
2.884(2) |
Sb1–3vi |
2.889(2) |
Bi1–I1i |
2.941(2) |
Bi1–I3vi |
2.950(2) |
| Sb1–I1ii |
2.884(2) |
Sb1–I4 |
2.887(2) |
Bi1–I1ii |
2.941(2) |
Bi1–I4 |
2.951(2) |
| Sb1–I2i |
3.236(2) |
Bi1–I1 |
3.2442(2) |
Bi1–I2i |
3.251(2) |
Bi1–I1 |
3.248(2) |
| Sb1–I2ii |
3.236(2) |
Sb1–I2vii |
3.238(2) |
Bi1–I2ii |
3.251(2) |
Bi1–I2vii |
3.253(2) |
| Sb1–I2 |
3.236(2) |
Sb1–I2 |
3.238(2) |
Bi1–I2 |
3.251(2) |
Bi1–I2 |
3.253(2) |
| I–Sb–Icis |
82.80(5)–93.90(6) |
I–Sb–Icis |
80.56(6)–93.83(6) |
I–Bi–Icis |
82.01(5)–93.78(6) |
I–Bi–Icis |
82.04(4)–94.05(5) |
| I–Sb–Itrans |
172.24(7) |
I–Sb–Itrans |
172.41(6) |
I–Bi–Itrans |
171.80(7) |
I–Bi–Itrans |
171.90(5) |
The most pronounced structural manifestations of the PT I → II in both compounds concern the spatial arrangement of the [M2I9]3− bioctahedra and imidazolium cations. Similarly to [C(NH2)3]3[M2I9] hybrids25 both ImIA and ImIB exhibit a layered anionic framework which accommodates the cations within the layers. The lack of strong directional hydrogen-bonding interactions in the high-temperature phases, that could stabilize the structure, makes this system very prone to the temperature induced displacements and favors the steric effects in the organization of the structural motifs.
In high temperature phase I, both types of the imidazolium cations (A and B) are disordered. Thus, the A type cations are disordered around the site of the C3v (3m, Wyckoff position f) symmetry. Each cation may occupy one of the three possible positions generated around this site. The B type cations are disordered around the site of the D3h (6(–)m2, Wyckoff position b) site symmetry. Each B cation may occupy one of the three symmetry equivalent positions. It is important to say that the molecular ring planes of the cations of type B are strictly perpendicular to the c hexagonal axis, whereas the molecular planes of the A-type cations are almost, although not completely, parallel to the c hexagonal axis.
Lowering of temperature gives rise to large deformations of the anionic framework in phase II. The distance between the layers grows, which is well reflected in the increase in the c lattice parameter from 22.285(3) Å at 445 K to 22.372(2) Å at room temperature for ImIA, but the most pronounced changes take place inside the layers. The crystal significantly expands in the bo direction which is equivalent to  in the hexagonal phase; the lattice constant bo increases from 16.20 Å to 16.91 Å for ImIA and from 16.09 Å to 16.75 Å for ImIB with decreasing temperature. Both crystals exhibit a negative thermal expansion in the bo direction which is compensated by a huge compression of the structure in the a direction. In ImIA the a lattice parameters decrease from 9.35 Å to 8.92 Å with lowering temperature, which is almost 4.5% of the initial (hexagonal) value. In ImIB the reduction of the a distance is also substantial: from 9.29 to 8.94 Å. Altogether, this gives a negative thermal expansion for ImIB for which the volume of the primitive cell increases with lowering temperature (from 1682 Å3 at 350 K to 1684 Å3 at room temperature). The volume of ImIA does not change within the 3σ limit (σ-standard uncertainty) and is equal to 1688.1(3) at 445 K and 1687.7(3) at room temperature. The observed structural changes are principally associated with a reconstruction of the cationic substructure. In the hexagonal phase there are two inequivalent imidazolium cations A and B. Both are heavily disordered; see Fig. 2(a) and 3(a). Each of them may occupy at least three equivalent positions with the same site occupation factor equal to 1/3. Large voids of 255/256 Å3 for B and 132/138 Å3 for A, for ImIA/ImIB allows for thermally induced rotation of the cations (calculated by Platon34). The diffused electron density around the A and B positions which is reflected in the large displacement parameters of the ring atoms implies almost free in-plane motions of the cations. In the PT the imidazolium B ions change their spatial arrangement by out-of-plane rotations by 90°. In the new position the B ring plane is parallel to the c-axis, while it was perpendicular to the c-axis in the hexagonal phase. Formally, in the orthorhombic phase the number of the orientation states of B ions is reduced from three to one, in fact, in both phases the imidazolium B may freely rotate in-plane as is evidenced by the diffused electron density, see Fig. S1.† Thus, in both phases the number of imidazolium B states formally may be the same. After the transition all the imidazolium cations are directed with their ring planes almost perpendicular to the a-axis, this explains the contraction of the unit cell in this direction, see Fig. 2(b) and 3(b). The cations A exhibit weaker alternation of the spatial arrangement compared to the cations B. The number of orientation states that may be accommodated by A is reduced from 3 to 2 in the orthorhombic phase where the A cations may adopt two positions related by the symmetry plane perpendicular to the a-axis, see Fig. 2(b). The disorder is maintained due to the increase in the volume of the crystal void which is occupied by the A ion. It doubles after the transition from 132/138 to 264/262 Å3, at the same time the space accessible for the ion B is drastically reduced from 255/256 to 128/127 Å3 in ImIA/ImIB. It is worth noting that the electron density of imidazolium A and B in the plane of the rings is still highly diffused in the orthorhombic phase evidencing some in-plane dynamics (rotations and librations) of the cations. In the orthorhombic phase weak N–H⋯I and C–H⋯I hydrogen bonds appear between the [M2I9]3− bioctahedra and imidazolium cations. Table S1† summarises the geometry whereas Fig. S1† illustrates these interactions. The long donor-to-acceptor distances ranging from 3.50(3) to 3.77(3) Å as well as large atomic displacement parameters for both imidazolium and iodide ions suggest that at room temperature both A and B may easily perform in-plane rotations. Additionally, imidazolium A may dynamically switch between the two positions generated by the mirror plane. Probably the last II → III PT stabilizes the crystal structure. Unfortunately, the crystal structure of phase III could not be resolved due to a heavy twinning.
 |
| | Fig. 3 The view of the crystal structure along chex = co direction. The PT is associated with a reconstruction of the imidazolium substructure. In both phases, both imidazolium A and B may perform free in-plane rotations. Imidazolium A and B in phase I adopt three equivalent positions with a site occupation factor of 1/3, in phase II A is distributed among two disordered positions with 1/2 occupancy, and B formally adopts ‘ordered’ sites. | |
Dielectric properties
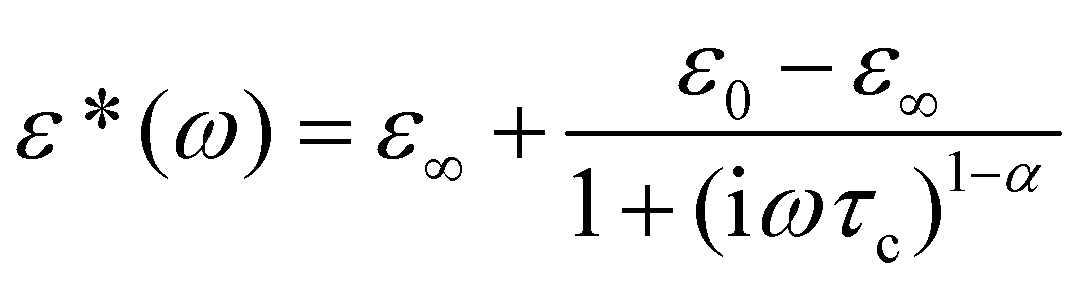
The temperature dependence of the real and imaginary part of the complex dielectric permittivity, ε′ and ε′′ at selected frequencies during the cooling cycle for ImIB and ImIA is presented in Fig. 4 and 5, respectively (see also ESI, Part 2†). In the case of ImIB the lower temperature II → III PT is dielectrically active. It manifests itself as a rapid decrease in ε′ (Δε′ ≈ 1.5–2.5), whereas the I → II PT seems to be masked by the conductivity. Below 140 K a low frequency relaxation process is observed. Dielectric function in the low temperature range can be described by the Cole–Cole relationship:| |  | (1) |
where ε0 and ε∞ are the low and high frequency limits of the dielectric permittivity, respectively, ω is the angular frequency, and τc is the macroscopic dielectric relaxation time. The Cole–Cole diagrams of ImIB at four temperatures are illustrated in Fig. S2.† In all the analyzed temperature regions they deviate from semi-circles and the parameter α retains an approximately constant value, ca. 0.27 ± 0.03, which indicates that the relaxation process is polydispersive. The activation energy estimated for this process (see Fig. S3†) is equal to 44 kJ mol−1 and is unexpectedly high as for crystals containing organic cations of such a small size.
 |
| | Fig. 4 Temperature dependence of the complex dielectric permittivity, (a) real (ε′) and (b) imaginary (ε′′) part, recorded during the cooling cycle for the polycrystalline sample of ImIB. | |
 |
| | Fig. 5 Temperature dependence of the real part of the complex dielectric permittivity recorded for the polycrystalline sample of ImIA. | |
In turn, the dielectric anomalies in ImIA are well visible around two PT points. At 278 K the PT is accompanied by a step-wise change in ε′ with the dielectric increment of the order of 8–12 units. The PT at 324 K reveals a clear anomaly of ε′. Nevertheless, the dielectric relaxation processes were not found in ImIA (more in ESI, Part 2†).
Optical properties
The PT I → II involves an equitranslational symmetry reduction from the P63/mmc to Cmcm space group. This is, therefore, a proper ferroelastic PT with three orientational variants (see also Fig. S5† and attached Film F1).35,36
As discussed in ref. 25 and in references cited therein a variant can be obtained from another by a mirror reflection “lost” in the phase transition (see Fig. 6). The domain wall along such a plane is a W wall. The domain wall which is perpendicular to the W wall in the limit of infinitesimal deformation strain is classified as a W′ wall. The angles between the domain walls change for finite strains. The angles between the W and W′ domain walls separating the same variants or a selected variant from the reaming two are:23
| | 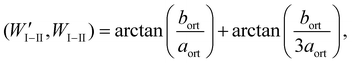 | (2a) |
| |  | (2b) |
| | 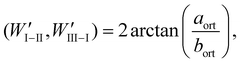 | (2c) |
where
aort and
bort are the lattice parameters in the orthorhombic phase perpendicular to the hexagonal axis.
 |
| | Fig. 6 Three variants VI, VII and VIII of phase Cmcm as a result of symmetry reduction P63/mmc. Thick lines and thin dashed lines correspond to W and W′ wall orientation without orthorhombic strain. | |
Using the data for the orthorhombic phase for ImIA at 298 K one easily gets:
| | | (W′I–II,WI–II) ≅ 85.5°, | (3a) |
| | | (WI–II,WI–III) ≅ 57.7°, | (3b) |
| | | (W′I–II,W′III–I) ≅ 55.6°, | (3c) |
and for ImIB one gets
| | | (W′I–II,WI–II) ≅ 86.1°, | (4a) |
| | | (WI–II,WI–III) ≅ 58.0°, | (4b) |
| | | (W′I–II,W′III–I) ≅ 56.2°. | (4c) |
The experimental macroscopic angles presented in
Fig. 7(a) and (b) are in a general agreement with geometrical microscopy predictions, given by
eqn (2a)–(2c). However, the angles seen in
Fig. 7 differ slightly from those calculated in
eqn. (3) and (4) because the temperature of the crystallographic measurements and that of the optic observations were different. Consequently we see in
Fig. 7(a) the values 59° and 56° instead of 58° and 56.2° respectively as predicted in
eqn. (4b) and (4c). The corresponding domain walls can be, therefore, identified with the
W and
W′ boundaries separating a given variant from both the remaining ones. The system apparently avoids junctions of
W and
W′ walls for the same variant (see
eqn (4a)). Two other angles, 65° and 62°, are visible in
Fig. 7(a). They result from the external surfaces of the sample. One can see that the short edges of the plate in
Fig. 7(a), making an angle of 124°, are parallel to the domain walls. The long edges of the sample are not parallel to the internal domain walls. This produces the angle 65° = 180° − 56° − 59°. An analogous effect occurs at the other (bottom) side. Small deviations resulting from the exact values occur, however, due to dagger-like intrusions of a domain into another (best visible in the range close to the angle 124° in
Fig. 7(a)). This is the origin of the angle 62° compared to 59° on the other side. The domain pattern for ImIA (
Fig. 7(b)) is less developed, but an example of a junction (
W,
W′) for the same pair of domains is visible (see
eqn (3a)). It is interesting that for the ImIB sample the
W domain walls, related to the lost mirror planes, are practically absent from the microscopy images similarly to [C(NH
2)
3]
3[Sb
2I
9].
25 The domain pattern in ImIA is quite different in spite of the chemical similarity.
 |
| | Fig. 7 Ferroelastic domain structure of (a) ImIB and (b) ImIA in the orthorhombic phase along the c-axis. | |
The optical observations at lower temperatures (see Fig. S5†) provide an insight into the structure of the phase III of ImIB despite the lack of crystallographic data. The PT II → III turns out to be ferroelastic, although it cannot be stated if phase III is a proper or improper ferroelastic with respect to phase II. A comparison of angles implies that a stress-free orientation of domain walls in phase III is perpendicular to the longest edge of the plate visible in Fig. 7a and Fig. S5.† At the same time the plane halves the angle 56° that should correspond to the (W′I–II, W′I–III) angle in phase II. Such being the case, the longest edge of the plate would be parallel to the plane (a, c) of the orthorhombic phase and the stress-free domain boundary of orientational variants of phase III would be parallel to the plane (b, c). This is in accordance with Fig. 2 and 3 showing that the plane (0 1 0), i.e. the one with the longest edge, in phase is in fact the closest packed. Such planes are usually the preferable facets of the crystal as deduced from the Wulff construction.34
Proton magnetic resonance studies (1H NMR)
The temperature dependencies of the 25 MHz proton nuclear relaxation times T1 for ImIB and ImIA are shown in Fig. 8. Both temperature dependencies of T1 are comparable, with a double wide minimum at low temperatures and strongly increasing left slope up to the III → II PT. Above this, a clear lowering of slopes of the linear logT1vs. T−1 curve takes place.
 |
| | Fig. 8
1H spin–lattice relaxation time T1versus temperature for ImIB (red circles) and ImIA (blue circles) at 25 MHz and theoretical predictions (solid lines) obtained as a sum of three relaxation processes (eqn (5) and (6)). | |
The complex crystal structures of both compounds and their temperature evolution result in a complex spin–lattice relaxation process. It is shaped by the spatial disorder as well as by the fact that the imidazolium cations may adopt different motion modes: (i) small-angle librations, (ii) pseudo-C5 in-plane rotations, (iii) rotations around axes which are in-plane or (iv) tumbling. The three relaxation minima occurring in phase III result from the dynamics of three structurally and dynamically non-equivalent imidazolium cations. It is known that for the dipole–dipole couplings of protons with neighboring nuclei, the most important is the dipole–dipole interaction between protons of the same imidazolium ring. In fact, protons of the imidazolium cation may relax in different relaxation pathways, which are summed up as effective relaxation times (eqn (5)):
| |  | (5) |
where
T1(H–H) describes the contribution to the proton relaxation resulting from dipole–dipole couplings between the protons of the given imidazolium cations and the protons of neighboring cations, the
T1(H–N) describes the contribution of the proton–nitrogen dipole–dipole interactions,
T1(H–X) (where: X = Sb, Bi) and
T1(H–J) correspond to the antimony, bismuth and iodine dipolar interactions. An insight into the distances between protons and neighboring nuclei leads to the conclusion that the H–H contributions are dominating. According to the dominating proton–proton relaxation pathway, we carried out the fitting procedure using a sum of three proton–proton relaxation processes associated with three imidazolium cations with different dynamics:
| | 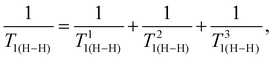 | (6) |
where each component of
eqn (6) has the suitable form of
eqn (3) (see ESI, Part 4
†) and for each cation the proper Arrhenius law is applied. The solid line in
Fig. 8 shows the final results of the fitting; the obtained parameters are summarized in Table S2.
† The parameters are typical of heteroaromatic cations.
37–45
At the present stage we are not able to describe exactly the movements of the relaxing imidazolium cations in both the studied compounds in phase III. We may suppose that the different types of the small-angle librations of the imidazolium rings in-plane and out-of plane appear as it is postulated from X-ray diffraction. Noteworthy is that all the parameters with relatively small values of correlation times (typical of ring cations) listed in Table S2† represent a fast motion mode of imidazolium. At low temperatures, when the influence of quadrupole interactions is usually relevant, both the fitting lines have no deviations.43 It means that in ImIA and ImIB the quadrupolar interaction may appear, if at all, at much lower temperatures than these reached in the present study. On the other hand, at higher temperatures in both crystals the fitting lines definitely deviate from experimental points just before III → II PT temperatures. The values of the measured relaxation times significantly higher than those predicted by the theory may be related to the critical effects of upcoming rapid structural reconstruction at the PT. As a result, the deviation of both the observed slopes of the temperature dependencies of longitudinal relaxation times T1 drops to Ea within 1.7–2.0 kcal mol−1. The second moment of the 1H NMR line as a function of temperature (95–340 K) displays only minor anomalies around PTs in both compounds (see Fig. S6†).
Vibrational properties
Since the imidazolium derivatives are isomorphous in their corresponding phases we decided to analyze the temperature dependence of the vibrational properties for one of them (ImIB) in the temperature range covering the III → II first-order PT (see also Part 5 in the ESI†). The increase in temperature affects the spectrum produced by the motions of the cations.
The most spectacular changes which occur due to the (III → II) PT are assigned to the vibrations of the ring (R). Fig. 9 shows the evolution of the τ(R) modes in ImIB between 600 and 630 cm−1 with temperature. At the lowest temperature (11 K) seven components are observed at 625, 623, 617, 614, 611, 608 and 606 cm−1. Four of them (625, 611, 606 and 623 cm−1) disappear over phase III at ca. 100 K. With further heating the triplet structure of the τ(R) mode evolves continuously into a doublet. At the PT temperature (295 K) one of the components disappears (608 cm−1) whereas the mode at 614 cm−1 shifts step-wisely by ca. 1 cm−1 towards the higher values.
 |
| | Fig. 9 (a) Infrared spectra between 595 and 630 cm−1 of the ImIB as a function of temperature, (b) plot of the τ(R) mode frequencies of ImIB as a function of temperature. | |
Fig. 10 shows the region of the deformation ring mode δ(R) (i.e. ν(R) β(CH) β(NH)) (1570–1590 cm−1) as a function of temperature. On cooling from 320 K to 297 K a single band is visible. Below II → III PT a gradual splitting takes place and finally, at 250 K, a new component appears. It should be noticed that the sign of the temperature coefficient (dν/dT) of a central band (1578 cm−1 at 11 K) is changed at ca. 200 K.
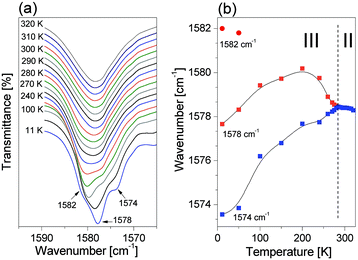 |
| | Fig. 10 (a) Infrared spectra between 1570–1590 cm−1 of the ImIB as functions of temperature, (b) plot of the deformation band: δ(R) mode frequencies of ImIB as a function of temperature. | |
Discussion
Iodoantimonates(III) and iodobismuthates(III) based on small-size alkylammonium and non-substituted heteroaromatic cations have a tendency to crystallize in the chemical R3M2I9 stoichiometry, which is characterized by separated bioctahedral units [M2I9]3−. The compounds from this family of crystals were found to exhibit pronounced dynamical disorder of cations at high temperatures. With decreasing temperature the freedom of motion of these cations is reduced, most often step-wisely, that is reflected in numerous structural PTs. Methylammonium (MA), guanidinium (G) and imidazolium (Im) analogues exhibit a rich polymorphism in the solid-state and interesting ferroic properties. The phase situation in the listed compounds is illustrated in the diagram below:
All the presented compounds are isomorphic in their high-temperature phases (I) where they adopt the hexagonal symmetry (
P6
3/
mmc). However, at low temperatures the physical properties of MAIA
46 and MAIB
26 substantially differ from those of guanidinium and imidazolium ones with respect to the dipole–dipole interactions and the type of the order of the organic substructure. The dipole–dipole interactions in the methylammonium analogs are of the long-range order which is reflected in an enhanced dielectric permittivity. In consequence, the low-temperature ordered phases (II) in MAIA and (III) in MAIB are antiferroelectric and ferrielectric, respectively.
On the other hand, GIA/GIB and ImIA/ImIB display large similarities both from the structural and dynamical point of view. The PT I → II in all the cases belong to the proper ferroelastic species of Aizu: 6/mmmFmmm.47 In all the crystals the PTs are driven by a mixed order–disorder and displacive mechanism. The latter component is related to significant relative displacement of the anionic and cationic substructures. Nevertheless, the character of cation arrangement is substantially different in both subclasses. One can observe considerable changes in the mutual positions of the A and B guanidinium cations through the PT. The distance between the centers of gravity of both of them diminishes along the b-axis, which is accompanied by a leaning out of the B cations toward the c-axis (up and down). This effect deepens in the subsequent PT (II → III). The ring plane of the cation A in each phase is practically unchanged with regard to its surroundings (see Fig. 10 in ref. 25).
In the case of the imidazolium analogs the observed structural changes through the I → II and II → III PT are essentially assigned to the reconstruction of the cationic substructure. During the PT imidazolium cations type B change their spatial arrangement by the out of plane rotation equal to 90°. This reorientation is an essential order–disorder contribution to the I → II PT. The X-ray diffraction patterns at room temperature indicate that the electron density of imidazolium A and B in the plane of the rings is still highly diffused in phase II evidencing the in-plane dynamics (rotations and librations) of the cations. This, together with the calorimetric and 1H NMR results, allows us to propose the mechanism of II → III PT in both compounds. The entropy transition (ΔStr) for II → III PT in ImIA and ImIB is of the order of 32–33 J mol−1 K−1 (3·Rln 4) which indicates huge changes in the dynamical state of cations. The PT II → III is, most probably, accompanied by a freezing of the motion of cations within the ring plane, which is distinctly reflected on the T1vs. 1/T curve, as a rapid jump. Below II → III PT a small-angle libration motion is admitted that is confirmed by the dielectric relaxation process observed in ImIB at low temperatures. The 1H NMR studies suggest the presence of three non-equivalent imidazolium cations in phase (III). The structure of the phase III of ImIA and ImIB could not be resolved by XRD. In spite of the huge thermal effect the samples do not lose their integrity in the PT II → III. The microscopy image of the ImIB (Fig. S5†) suggests a ferroelastic character of the transformation with a stress-free orientation of domain walls perpendicular to the long edge of the sample. This orientation apparently bisects an angle of the stress-free domain walls in phase II. Therefore one can expect that the transformation shear plane lies in the (b,c) crystallographic plane of phase II. Such a shear can be engendered by an ordering of the A imidazolium cations if they all selected the left (or right in the other domain) position out of two shown in Fig. 3(b).
Summary
In summary, switchable molecular-ionic dielectric compounds, (C3H5N2)3[Sb2I9] (ImIA) and (C3H5N2)3[Bi2I9] (ImIB), with a zero-dimensional perovskite-like structure are found to be ferroic (ferroelastic) in phases II and III. The PT I → II belongs to the category of proper ferroelastic with three ferroelastic domains predicted by the symmetry reduction. The optical observations confirm the predictions with an interesting lack of W walls in ImIB. Phase III also shows ferroelastic properties reflected in a system of stress-free coherent domain boundaries. Several complementary techniques confirm the PTs and reveal the dynamic properties in subsequent phases. The PTs (at 324 and 273 K in ImIA and 327 and 291 K in ImIB) are triggered by the reorientational motions of the imidazolium cations and the huge distortion of the inorganic networks (discrete [M2I9]3− units). Complex molecular motions and their direct contribution to the PT mechanism are confirmed by 1H NMR studies. ImIB, which from the structural point of view resembles the recently widely studied (CH3NH3)3[Bi2I9] (as a promising absorber for photovoltaics), will provide an important impulse for the development of multifunctional materials.
Experimental
Synthesis of the complex
All materials used for the synthesis of (C3H5N2)3[Sb2I9] (ImIA) and (C3H5N2)3[Bi2I9] (ImIB) were purchased from commercial sources (Sigma-Aldrich and Merck (HI)) and used without further purification: C3N2H4 (>99%), Bi2O3/Sb2O3 (99.99%), HI (57%).
The crystals were grown by a slow evaporation of a concentrated HI solution containing the 3:2 ratio of C3N2H4 and SbI3 (ImIA) or BiI3 (ImIB). The salts obtained were twice re-crystallized and their composition was verified by an elemental analysis: ImIB C: 8.25% (theor. 8.34%), N: 6.77% (theor. 6.49%), H: 1.55% (theor. 1.17%); ImIA C: 8.89% (theor. 9.08%), N: 7.35% (theor. 7.06%), H: 1.55% (theor. 1.27%). The single-crystals were grown from an aqueous solution at constant room temperature.
General
Thermal studies
Differential scanning calorimetry (DSC) runs were recorded using a Perkin Elmer DSC-7 in the temperature range 100–470 K with a scanning rate of 10 K min−1. The TGA and DTA measurements were performed on a Setaram SETSYS 16/18 instrument in the temperature range 300–650 K with a ramp rate of 2 K min−1. The scan was performed in flowing nitrogen (flow rate: 1 dm3 h−1).
Dielectric studies
The complex dielectric permittivity ε* = ε′ − iε′′ was measured using an Agilent 4284A Precision LCR meter in the frequency range between 100 Hz and 2 MHz and in the temperature range from 90 to 400 K. The sizes of the samples were of the order of 3 × 3 × 0.8 mm3.
Optical observations
The ferroelastic domain structure of the ImIA and ImIB crystals were studied by means of an Olympus BX53 optical polarization microscope. The samples were placed in a LINKAM THM-600 heating/cooling stage, where the temperature was stabilized to within 0.1 K.
IR measurements
The infrared spectra of ImIB were recorded in a wide temperature range (from 18 to 320 K) in KBr pellets with a Bruker IFS-88 spectrometer in a wavenumber range 4000–500 cm−1 with a resolution of 1 cm−1. An APD Cryogenics Displex Closed Cycle Refrigenerating System, Model CSW-202 was used to study the temperature dependence of the spectra. The temperature of the sample was stabilized at the accuracy of 0.1 K by using a Scientific Instruments INC controller Series 5500. The Grams/368 Galactic Industries program was used for numerical fitting of the experimental data. The Gaussian functions were used for fitting the infrared bands.
Proton magnetic resonance
1H spin–lattice NMR relaxation measurements were performed in the temperature range of 90–375 K using an ELLAB TEL-Atomic PS 15 spectrometer. The spin–lattice relaxation times T1 at 25 MHz were measured using a saturation sequence of π/2 pulses followed by a variable time interval τ and a reading π/2 pulse. The magnetization was found to be single-exponential within experimental error at all temperatures. The second moment of the 1H NMR line was measured using an ELLAB TEL-Atomic CWS 12–50 spectrometer in the temperature range from 101 K to 295 K by using a continuous wave spectrometer working on protons at the frequency of 28.2 MHz. The second moment values were found by numerical integration of the absorption curve derivatives. The temperature of the sample was controlled by using a UNIPAN 660 temperature controller operating on a Pt 100 sensor providing long time temperature stability better than 1 K. All measurements were made on heating the sample from liquid nitrogen temperature. The powdered samples were evacuated at room temperature and then sealed under vacuum in a glass ampoule.
Crystal structure analysis
The crystal structure analyses of ImIA and ImIB were performed using the single-crystal X-ray diffraction data in phases I and II (Table 2). The diffraction intensities were collected on a KM4CCD diffractometer operating in ω-geometry with MoKα radiation (0.71073 Å). Acquisition and data reduction were done using CrysAlis PRO, Oxford Diffraction Ltd, Version 1.171.34.44. Empirical absorption correction was applied using spherical harmonics, implemented in the SCALE3 ABSPACK scaling algorithm. High temperatures were maintained by using an open-flow hot-air system. At room temperature, i.e., in phase II, the crystals were often heavily twinned. Thin and small, single-domain samples were, thus, carefully selected under a polarising microscope, measured at room temperature and then heated to the high temperature phase. The structures were solved by direct methods and refined by the full-matrix least squares method against F2 by means of the SHELXL97 program package.48 Because of a large disorder in the imidazolium substructure the isotropic displacement parameters of carbon and nitrogen were refined in both structural phases. Additional constraints on the C–N distances and C–N–C angles were imposed to keep the appropriate geometry of imidazolium cations. The hydrogen atoms were introduced in the geometrically calculated positions (C–H 0.96 Å, N–H 0.89 Å) and treated as riding atoms. The details of the crystal data, data collection and refinement are presented in Table S2. ESI (Part 2)† contains information about the main structural motifs in the ellipsoid representation. CCDC no. 1494297–1494300.
Table 2 Experimental details
| |
(C3H5N2)3[Sb2I9] (ImIA) |
(C3H5N2)3[Bi2I9] (ImIB) |
|
Crystal data
|
| Chemical formula |
C9H15I9N6Sb2 |
C9H15Bi2I9N6 |
|
M
r
|
1592.77 |
1592.89 |
1767.33 |
1767.33 |
| Crystal system, space group |
Hexagonal, P63/mmc |
Orthorhombic, Cmcm |
Hexagonal, P63/mmc |
Orthorhombic, Cmcm |
| Temperature (K) |
445 |
298 |
350 |
300 |
|
a, b, c (Å) |
9.3526(9), 9.3526(9), 22.285(3) |
8.9215(7), 16.9118(10), 22.3716(15) |
9.2914(9), 9.2914(9), 22.503(3) |
8.9409(14), 16.749(2), 22.494(3) |
|
α, β, γ (°) |
90, 90, 120 |
90, 90, 90 |
90, 90, 120 |
90, 90, 90 |
|
V (Å3) |
1688.1(3) |
3375.4(4) |
1682.4(3) |
3368.5(8) |
|
Z
|
2 |
4 |
2 |
4 |
|
μ (mm−1) |
9.84 |
18.71 |
| Crystal size (mm) |
0.20 × 0.08 × 0.01 |
0.13 × 0.05 × 0.05 |
| |
|
Data collection
|
|
T
min, Tmax |
0.291, 1.000 |
0.401, 1.000 |
| No. of measured, independent and observed [I > 2σ(I)] reflections |
15508, 654, 220 |
18024, 1751, 697 |
13217, 520, 156 |
17455, 1517, 451 |
|
R
int
|
0.130 |
0.074 |
0.044 |
0.060 |
|
Θ
max (°) |
25.7 |
25.7 |
23.5 |
25.7 |
| (sinΘ/λ)max (Å−1) |
0.610 |
0.609 |
0.562 |
0.610 |
| |
|
Refinement
|
|
R[F2 > 2σ(F2)], wR(F2), S |
0.065, 0.234, 0.95 |
0.065, 0.233, 1.05 |
0.041, 0.101, 0.88 |
0.047, 0.113, 0.85 |
| No. of reflections |
652 |
1751 |
520 |
1747 |
| No. of parameters |
27 |
48 |
27 |
46 |
| No. of restraints |
16 |
13 |
18 |
13 |
| Δρmax, Δρmin (e Å−3) |
0.73, −0.59 |
1.06, −0.55 |
0.59, −0.33 |
0.72, −0.48 |
Acknowledgements
This work was supported by the National Science Centre; grant no. 2013/11/D/ST8/03297 (A. Piecha-Bisiorek).
References
- N. Mercier, Eur. J. Inorg. Chem., 2013, 19 CrossRef.
- S. A. Adonin, M. N. Sokolov and V. P. Fedin, Coord. Chem. Rev., 2016, 312, 1 CrossRef CAS.
- R. Lin, G. Xu, M. Wang, G. Lu, P. Li and G. Guo, Inorg. Chem., 2013, 52, 1199 CrossRef CAS PubMed.
- T. Hang, W. Zhang, H. Ye and R. Xiong, Chem. Soc. Rev., 2011, 40, 3577 RSC.
- W. Zhang and R. Xiong, Chem. Rev., 2012, 112, 1163 CrossRef CAS PubMed.
- G. Xu, Y. Li, W.-W. Zhou, G.-J. Wang, X.-F. Long, L.-Z. Cai, M.-S. Wang, G.-C. Guo, J.-S. Huang, G. Bator and R. Jakubas, J. Mater. Chem., 2009, 19, 2179 RSC.
- M. Owczarek, P. Szklarz, R. Jakubas and A. Miniewicz, Dalton Trans., 2012, 41, 7285 RSC.
- A. Piecha, A. Białońska and R. Jakubas, J. Mater. Chem., 2012, 22, 333 RSC.
- R. Jakubas, Solid State Commun., 1986, 60, 389 CrossRef CAS.
- J. Zaleski, C. Z. Pawlaczyk, R. Jakubas and H.-G. Unruh, J. Phys.: Condens. Matter, 2000, 12, 7509 CrossRef CAS.
- A. Miniewicz, J. Sworakowski, R. Jakubas, M. Bertault and C. Ecolivet, Ferroelectrics, 1989, 94, 323 CrossRef CAS.
- P. Carpentier, J. Lefebvre and R. Jakubas, Acta Crystallogr., Sect. B: Struct. Sci., 1995, 51, 167 Search PubMed.
- A. Piecha, A. Pietraszko, G. Bator and R. Jakubas, J. Solid State Chem., 2008, 118, 1155 CrossRef.
- A. Piecha, A. Białońska and R. Jakubas, J. Phys.: Condens. Matter, 2008, 20, 325224 CrossRef.
- L. Sobczyk, R. Jakubas and J. Zaleski, Pol. J. Chem., 1997, 71, 265 CAS.
- J. H. Heo, D. H. Song, H. J. Han, S. Y. Kim, J. H. Kim, D. Kim, H. W. Shin, T. K. Ahn, C. Wolf, T. Lee and S. H. Im, Adv. Mater., 2015, 27, 3424 CrossRef CAS PubMed.
- H. Hodes, Science, 2013, 342, 317 CrossRef PubMed.
- F. Hao, C. C. Stoumpos, P. Guo, N. Zhou, T. J. Marks, R. P. H. Chang and M. G. Kanatzidis, J. Am. Chem. Soc., 2015, 137, 11445 CrossRef CAS PubMed.
- S. Chen, R. Shang, K.-L. Hu, Z.-M. Wang and S. Gao, Inorg. Chem. Front., 2014, 1, 83 RSC.
- Y. Zhang, H.-Y. Ye, W. Zhang and R.-G. Xiong, Inorg. Chem. Front., 2014, 1, 118 RSC.
- B.-W. Park, B. Philippe, X. Zhang, H. Rensmo, G. Boschloo and E. M. J. Johansson, Adv. Mater., 2015, 27, 6806 CrossRef CAS PubMed.
- K. Eckhardt, V. Bon, J. Getzschmann, J. Grothe, F. M. Wisser and S. Kaskel, Chem. Commun., 2016, 52, 3058 RSC.
-
S. Sun, S. Tominaka, J.-H. Lee, F. Xie, P. D. Bristowe and A. K. Cheetham, 2015, arXiv preprint arXiv:1509.08126.
- S. Oez, J. Hebig, E. Jung, T. Singh, A. Lepcha, S. Olthof, J. Flohre, Y. Gao, R. German, P. H. M. Van Loosdrecht, K. Meerholz, Th. Kirchartz and S. Mathur, Sol. Energy Mater. Sol. Cells, 2016 DOI:10.1016/j.solmat.2016.01.035.
- P. Szklarz, A. Pietraszko, R. Jakubas, G. Bator, P. Zieliński and M. Gałązka, J. Phys.: Condens. Matter, 2008, 20, 255221 CrossRef.
- R. Jakubas, J. Zaleski and L. Sobczyk, Ferroelectrics, 1990, 108, 109 CrossRef CAS.
- J. Zaleski and R. Jakubas, Z. Naturforsch., A: Phys. Sci., 1994, 49, 709 CAS.
- J. Zaleski, R. Jakubas, G. Bator and J. Baran, J. Mol. Struct., 1994, 325, 95 CrossRef CAS.
- G. Bator, Th. Zeegers-Huyskens, R. Jakubas and J. Zaleski, J. Mol. Struct., 2001, 570, 61 CrossRef CAS.
- J. Zaleski and A. Pietraszko, Acta Crystallogr., Sect. B: Struct. Sci., 1996, 52, 287 Search PubMed.
- T. Kawai, E. Takao, S. Shimanuki, M. Iwata, A. Miyashita and Y. Ishibashi, J. Phys. Soc. Jpn., 1999, 68, 2848 CrossRef CAS.
- J. Laane and P. W. Jagodzinsky, Inorg. Chem., 1980, 19, 44 CrossRef CAS.
- A. Gągor, M. Węcławik, B. Bondzior and R. Jakubas, CrystEngComm, 2015, 17, 3286 RSC.
-
A. L. Spek, PLATON, A Multipurpose Crystallographic Tool, Utrecht University, 2001 Search PubMed.
-
V. Janovec and J. Přívratská, 2006. Domain structures. International Tables for Crystallography. D:3:3.4:449–505.
-
A. Zangwill, Physics at Surfaces, University Press, Cambridge, 1988, p. 12 Search PubMed.
-
D. Kruk, Theory of evolution and relaxation of multi-spin systems, Application to Nuclear Magnetic Resonance (NMR) and Electron Spin Resonance (ESR), Abramis Academic, Arima Publishing UK, 2007 Search PubMed.
- A. Piecha, V. Kinzhybalo, R. Jakubas, J. Baran and W. Medycki, Solid State Sci., 2007, 9, 1036 CrossRef CAS.
- A. Piecha, A. Białońska, R. Jakubas and W. Medycki, Solid State Sci., 2008, 10, 1469 CrossRef CAS.
- K. Hołderna-Natkaniec, I. Natkaniec, R. Jakubas, D. Nowak and W. Medycki, J. Mol. Struct., 2008, 891, 143 CrossRef.
- D. Kruk, W. Medycki, J. Przesławski, S. Dacko, A. Piecha and R. Jakubas, Chem. Phys., 2011, 380, 86 CrossRef CAS.
- A. Piecha, R. Jakubas, A. Pietraszko, J. Baran, W. Medycki and D. Kruk, J. Solid State Chem., 2009, 182, 2949 CrossRef CAS.
- J. Przesławski, W. Medycki, A. Piecha, R. Jakubas and D. Kruk, Chem. Phys., 2013, 410, 19 CrossRef.
- M. Węcławik, A. Gągor, A. Piecha, R. Jakubas and W. Medycki, CrystEngComm, 2013, 15, 5633 RSC.
- A. Piecha-Bisiorek, R. Jakubas, W. Medycki, M. Florek-Wojciechowska, M. Wojciechowski and D. Kruk, J. Phys. Chem. A, 2014, 118, 3564 CrossRef CAS PubMed.
- J. Zaleski, R. Jakubas, L. Sobczyk and J. Mróz, Ferroelectrics, 1990, 103, 83 CrossRef CAS.
- K. Aizu, Phys. Rev. B: Solid State, 1970, 2, 754 CrossRef.
- G. M. Sheldrick, Acta Crystallogr., Sect. A: Fundam. Crystallogr., 2008, 64, 112 CrossRef CAS PubMed.
Footnote |
| † Electronic supplementary information (ESI) available: Crystal characterization, dielectric, vibrational and optical properties as well as proton magnetic resonance studies (1H NMR). CCDC 1494297–1494300. For ESI and crystallographic data in CIF or other electronic format see DOI: 10.1039/c6qi00260a |
|
| This journal is © the Partner Organisations 2016 |
Click here to see how this site uses Cookies. View our privacy policy here. 
 . Fig. 2 illustrates the unit cells and the crystal packing in both phases.
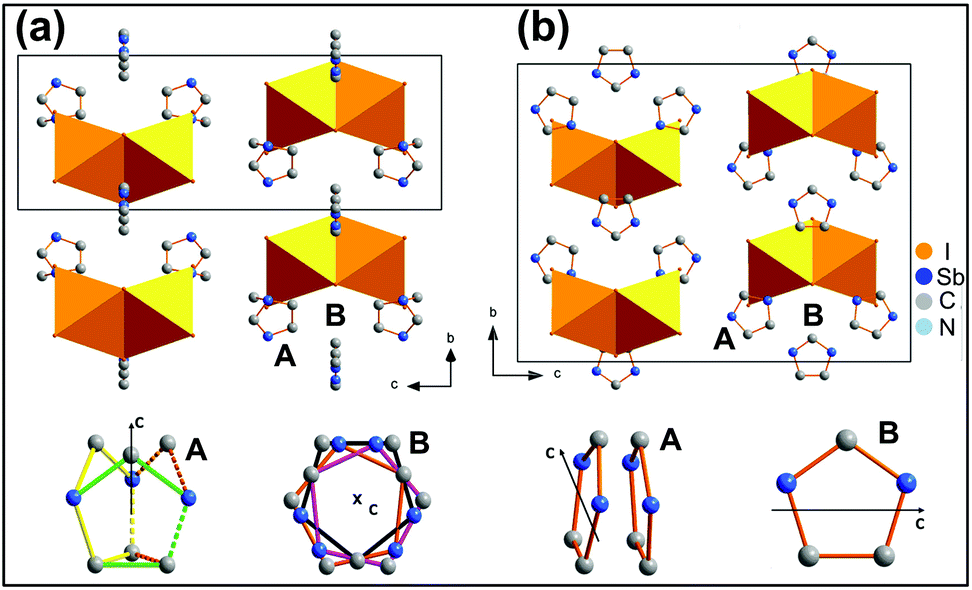
 in the hexagonal phase; the lattice constant bo increases from 16.20 Å to 16.91 Å for ImIA and from 16.09 Å to 16.75 Å for ImIB with decreasing temperature. Both crystals exhibit a negative thermal expansion in the bo direction which is compensated by a huge compression of the structure in the a direction. In ImIA the a lattice parameters decrease from 9.35 Å to 8.92 Å with lowering temperature, which is almost 4.5% of the initial (hexagonal) value. In ImIB the reduction of the a distance is also substantial: from 9.29 to 8.94 Å. Altogether, this gives a negative thermal expansion for ImIB for which the volume of the primitive cell increases with lowering temperature (from 1682 Å3 at 350 K to 1684 Å3 at room temperature). The volume of ImIA does not change within the 3σ limit (σ-standard uncertainty) and is equal to 1688.1(3) at 445 K and 1687.7(3) at room temperature. The observed structural changes are principally associated with a reconstruction of the cationic substructure. In the hexagonal phase there are two inequivalent imidazolium cations A and B. Both are heavily disordered; see Fig. 2(a) and 3(a). Each of them may occupy at least three equivalent positions with the same site occupation factor equal to 1/3. Large voids of 255/256 Å3 for B and 132/138 Å3 for A, for ImIA/ImIB allows for thermally induced rotation of the cations (calculated by Platon34). The diffused electron density around the A and B positions which is reflected in the large displacement parameters of the ring atoms implies almost free in-plane motions of the cations. In the PT the imidazolium B ions change their spatial arrangement by out-of-plane rotations by 90°. In the new position the B ring plane is parallel to the c-axis, while it was perpendicular to the c-axis in the hexagonal phase. Formally, in the orthorhombic phase the number of the orientation states of B ions is reduced from three to one, in fact, in both phases the imidazolium B may freely rotate in-plane as is evidenced by the diffused electron density, see Fig. S1.† Thus, in both phases the number of imidazolium B states formally may be the same. After the transition all the imidazolium cations are directed with their ring planes almost perpendicular to the a-axis, this explains the contraction of the unit cell in this direction, see Fig. 2(b) and 3(b). The cations A exhibit weaker alternation of the spatial arrangement compared to the cations B. The number of orientation states that may be accommodated by A is reduced from 3 to 2 in the orthorhombic phase where the A cations may adopt two positions related by the symmetry plane perpendicular to the a-axis, see Fig. 2(b). The disorder is maintained due to the increase in the volume of the crystal void which is occupied by the A ion. It doubles after the transition from 132/138 to 264/262 Å3, at the same time the space accessible for the ion B is drastically reduced from 255/256 to 128/127 Å3 in ImIA/ImIB. It is worth noting that the electron density of imidazolium A and B in the plane of the rings is still highly diffused in the orthorhombic phase evidencing some in-plane dynamics (rotations and librations) of the cations. In the orthorhombic phase weak N–H⋯I and C–H⋯I hydrogen bonds appear between the [M2I9]3− bioctahedra and imidazolium cations. Table S1† summarises the geometry whereas Fig. S1† illustrates these interactions. The long donor-to-acceptor distances ranging from 3.50(3) to 3.77(3) Å as well as large atomic displacement parameters for both imidazolium and iodide ions suggest that at room temperature both A and B may easily perform in-plane rotations. Additionally, imidazolium A may dynamically switch between the two positions generated by the mirror plane. Probably the last II → III PT stabilizes the crystal structure. Unfortunately, the crystal structure of phase III could not be resolved due to a heavy twinning.