An ideal detector composed of a 3D Gd-based coordination polymer for DNA and Hg2+ ion†
Shu-Na
Zhao
ab,
Lan-Lan
Wu
ab,
Jing
Feng
a,
Shu-Yan
Song
*a and
Hong-Jie
Zhang
*a
aState Key Laboratory of Rare Earth Resource Utilization, Changchun Institute of Applied Chemistry, Chinese Academy of Sciences, 5625 Renmin Street, Changchun, 130022, P.R. China. E-mail: songsy@ciac.ac.cn; hongjie@ciac.ac.cn
bUniversity of Chinese Academy of Sciences, Beijing, 100049, P.R. China
First published on 24th December 2015
Abstract
A Gd-based coordination polymer (CP) was synthesized solvothermally with 5-triazole isopthalic acid (H2L) and Gd3+ ion. The crystal structure of GdL showed high thermal stability up to 400 °C and water stability for a wide pH range (pH 2–10). It can be noted that it showed the ability to highly quench the fluorescence and had a different affinity toward ssDNA and dsDNA. The Gd-based CP was employed as an effective fluorescent sensing platform for DNA and Hg2+ ion detection with sensitivity and selectivity.
Introduction
In previous years, the detection of biomolecules has drawn great interest due to its importance in clinical diagnostic, industrial and environmental monitoring, and gene profiling.1 Although many methods have been developed for biomolecular detection, these detection techniques are limited by their high cost and risk of contamination.2 Recently, the development of fluorescent sensors for assaying biomolecules has received considerable attention due to the inherent advantages such as high sensitivity, cost effectiveness and operation convenience.3 To date, there were several structures that have been demonstrated as fluorescent sensing platforms for biomolecule detection. For instance, gold nanoparticles,4 graphene oxide (GO),5 single-walled carbon nanotubes (SWNTs),6 and carbon nanoparticles7 were used as the most universal fluorescence quenchers. The fluorophore labelled probes could be bound via hydrophobic and π-stacking interactions between the nucleobases and the nanostructures, which leads to fluorescence quenching due to fluorescence resonance energy transfer (FRET).8 Although these nanostructures have been proven to be effective sensing platforms to detect biomolecules successfully, the respective drawbacks limit their practical use. Thus, it is a challenging task to synthesize novel materials for fluorescence detection of biomolecules.Recently, coordination polymers (CPs) are an emerging class of crystalline materials assembled out of inorganic metal ions or clusters and polydentate organic linker ligands.9 They have been widely investigated for their structural diversity and potential applications in gas storage and separation,10 heterogeneous catalysis,11 drug delivery,12 energy storage and conversion,13 and chemical sensing.14 The different recognition/binding events with guest substrates, which can be transduced into externally optical signals, have enabled CPs to be excellent candidates as fluorescence detection materials. In CPs, the organic ligands usually contain a conjugated π-electron system and provide a source for possible hydrogen bonds, allowing for binding single-stranded DNA (ssDNA).15 The metal ions are usually used as coordination centers and open sites, which have an intrinsic fluorescence quenching property due to photoinduced electron transfer (PET) processes.16 Therefore, CPs could be used to recognize DNA molecules via fluorescence changes.
In addition, the formation of duplex structure between nucleic acid and different metal ions has been proven to be a versatile tool for detection of metal ions. It is well known that Hg2+ ions can specifically bind between two DNA thymine bases (thymine–Hg2+–thymine) and promote these T–T mismatches to form stable base pairs.17 This property has been applied to design of a fluorescent Hg2+ sensor using a functional T-rich DNA. In this study, we also demonstrated the detection of Hg2+ ion with a T-rich DNA, because the Hg2+ ion is one of the largest mercuric pollutants in environment water.18
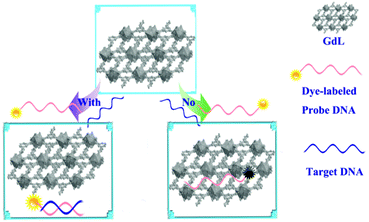
In this study, we have developed a 3D CP, [Gd(L)(HCOO)]n (GdL), as an efficient sensing platform for detecting DNA with high selectivity. The principle for this assay is illustrated in Scheme 1. The dye-labeled ssDNA probe (P) can be absorbed onto the surface or come in close proximity with GdL via π⋯π stacking hydrogen bond interactions between nucleobases in the ssDNA and GdL, resulting in substantial fluorescence quenching of the dye, possibly due to the PET. After the ssDNA probe hybridized with its complementary target DNA (T), the double-stranded DNA (dsDNA) had relatively weak interaction with GdL and detached from GdL, which resulted in fluorescence recovery in the presence of GdL. As a result, the GdL can be used as the sensing platform for detecting DNA sequences due to the fluorescence changes.
Experimental section
Materials and methods
Elemental analyses were determined with a VarioEL analyzer. Thermogravimetric analysis (TGA) was performed on a NetzschSTA 449F3 TG/DTA instrument under an air atmosphere. The samples were heated from about 40 °C to 800 °C at a 10 °C min−1 heating rate. The experimental powder X-ray diffraction data (PXRD) were obtained on a Bruker D8-FOCUS diffractometer equipped with a Cu Kα1 source (λ = 1.5406 Å; 1600 W, 40 kV, 40 mA) with the step of 0.02°. Temperature-dependent PXRD data were recorded on a Bruker D8-ADVANCE X-ray powder diffractometer using Cu Kα radiation. The simulated PXRD patterns were calculated using single-crystal X-ray diffraction data and processed by the free Mercury v1.4 program provided by the Cambridge Crystallographic Data Center. UV-VIS spectra were obtained on a SHIMADZU UV-VIS-IR spectrophotometer. The fluorescence excitation and emission spectra were obtained at room temperature with a Hitachi F-4500 spectrophotometer equipped with a 150 W Xenon lamp as an excitation source. The photomultiplier tube (PMT) voltage was 700 V; the scan speed was 240 nm min−1. The slit widths of excitation and emission were set the same in each sensing experiment. Excitation slit width was 10.0 nm and for emission it was 10.0 nm.X-ray crystallography
The X-ray intensity data for the three compounds were obtained on a Bruker SMART CCD diffractometer with graphite monochromatized Mo-Kα radiation (λ = 0.71073 Å, 45 kV, 35 mA). Data integration and reduction were processed with SAINT software.19 Multiscan absorption corrections were applied with the SADABS program.20 The crystal structure was solved by means of direct methods and refined employing full-matrix least-squares on F2 (SHELXTL-97).21 All the hydrogen atoms were generated geometrically and refined isotropically using the riding model. All non-hydrogen atoms were refined with anisotropic displacement parameters.The detailed crystallographic data and structure refinement parameters for this compound are summarized in Table S1.† CCDC reference number of crystal GdL is 1423187.
DNA
DNA sequences (as shown below) used in this study were synthesized by Shanghai Sangon Biotechnology Co. Ltd (Shanghai, China):Probe DNA1 (P1): 5′-TTCTTCATCGAGAGTGTAGTCG-FAM-3′
Probe DNA2 (P2): 5′-TTCTTTCTTCCCCTTGTTTGTT-FAM-3′
Target DNA1 (T1): 5′-CGACTACACTCTCGATGAAGAA-3′
Single-base mismatch DNA (SM1): 5′-CGACTACACTCTGGATGAAGAA-3′
Random DNA (R): 5′-TAGCTTATCAGACAGATGTTGA-3′
DNA buffer solutions were prepared by dissolving DNA into 20 mM tris-HCl buffer (100 mM NaCl, 5.0 mM KCl, pH 7.4). All solutions were prepared using water from a Milli-Q water system.
Preparation of GdL
5-Triazole isophthalic acid (H2L) was synthesized according to a literature method.22 All the other starting materials employed were purchased from commercial sources and used as received without further purification.Fluorescence measurements
Results and discussion
Design and synthesis
Single-crystal X-ray analysis revealed that compound GdL crystallizes in the monoclinic space group P21/n. The asymmetric unit of GdL was composed of one crystallographically independent Gd(III) center, one L2− ligand, and one formic ion. The Gd(III) ion was surrounded by four carboxylate oxygen atoms from four individual L2− ligands, three oxygen atoms from two formic ions, and one nitrogen atoms from one L2− ligand, which resembles a distorted square antiprismatic geometry (Fig. S1†) The Gd–O bond lengths varied from 2.322(3) to 2.567(3) Å, and the Gd–N bond distance was 2.592(4) Å. All the bond lengths were in accordance with reported literature.23 The coordination modes of carboxyl groups belonging to the L2− ligand were in the μ2–η1:η1-bridging mode. Each Gd(III) ion was bridged by carboxylic oxygen atoms and formic oxygen atoms into a 1D chain along the b axis as secondary unit building (Gd⋯Gd distance was 4.158(2) Å) (Fig. S2a†). Moreover, the 1D chains were interconnected by L2− ligands resulting in a 3D non-interpenetrating framework (Fig. S2b†). To demonstrate the feasibility of employing GdL as a fluorescent sensing platform for DNA detection, an oligonucleotide sequence P1 was employed as a model system.The PXRD of GdL was recorded at room temperature for checking the phase purity. As shown in Fig. S3,† the positions of the experimental pattern closely matched those of the simulated pattern, which indicates phase purity of the as-synthesized samples. Moreover, the dissimilarities of the intensity may be due to the preferred orientation of the crystalline powder samples. Thermogravimetric analysis was investigated for the stability, revealing that the crystal structure of GdL was stable up until 400 °C (Fig. S4†). Moreover, the temperature-dependent PXRD also confirmed the thermal stability of GdL (Fig. S5†). Furthermore, to investigate the stability and biological application of GdL, the crystal GdL was first ground, and then transferred into the solutions of pH 2–10 for one week. The solutions were filtered to separate and gather the samples. As exhibited in Fig. S6,† the PXRD spectra in the solutions of pH = 2–10 show almost no change except for a very slight variation, which indicated the GdL possessed relative good stability over a wide pH range. To demonstrate the feasibility of employing GdL as a fluorescent sensing platform for DNA detection, an oligonucleotide sequence P1 was employed as a model system.
Sensing platform for DNA and Hg2+ ion detection
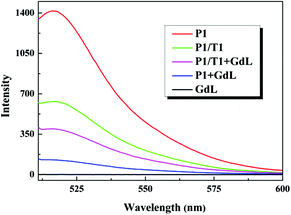
Fig. 1 shows the fluorescence emission spectra of P1 under different conditions in tris-HCl buffer (pH = 7.4). It was observed that the free P1 with fluorescein-based dye (FAM) at its 3′ end had fairly strong fluorescence emission upon exciting at 494 nm in the absence of GdL (red curve in Fig. 1). While the fluorescence intensity was quenched by about 91% after adding GdL within 15 min (Fig. S10†), thus suggesting that the GdL has a strong interaction with ssDNA and can quench the dye fluorescence effectively (blue curve in Fig. 1). In contrast, the P–GdL complex exhibited remarkable fluorescence enhancement upon incubation with complementary target T1 (tDNA), resulted in a 62.8% fluorescence recovery (pink curve in Fig. 1). The fluorescence recovery could be ascribed to the formation of dsDNA hybridized by P1 with target T1. It should be pointed out that the fluorescence intensity of P1/T1 duplex at 517 nm was lower than that of P1 in the absence of GdL, due to the different effect of primary and secondary structures of DNA on the fluorescence properties of labeled dyes.8bActually, the GdL sample itself had no fluorescence emission in the investigated wavelength range (black curve in Fig. 1). In addition, the UV-Vis diffuse reflectance spectrum (DSR) of GdL was tested, which suggests that it has no absorption at the investigated emission wavelength of FAM (Fig. S7†). This means that there was no spectral overlap between the emission band of P1 and the adsorption of GdL, thus the FRET cannot occur between these two. Therefore, the reasonable quenching mechanism should be PET, which is different from that of carbon nanostructures.16
The influence of the amount of tDNA introduced into the system was also investigated. In a typical experiment, various concentrations of T1 ranging 0–50 nM were added in a series of suspensions containing P1 (50 nM) and GdL (5 μg mL−1). As shown in Fig. 2, the fluorescence intensity enhanced along with the increase of the T1 concentration and exhibited a linear relationship over the range from 0 to 50 nM, thus indicating that GdL can be used as an effective sensing platform for DNA detection.
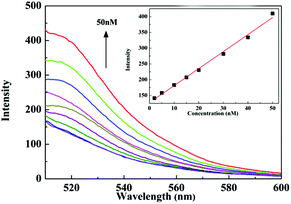 | ||
| Fig. 2 Fluorescence spectra of the FAM-labeled P1–GdL in the presence of different concentrations of target DNA. Inset: plot of fluorescence intensity vs. concentration of target DNA. | ||
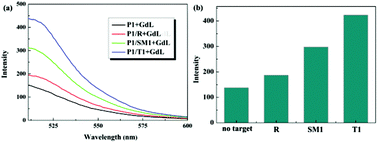
In addition to the perfect complementary target T1, mismatched sequences (single-base mismatch DNA (SM), random DNA (R)) were introduced into the system to evaluate the platforms sensing specificity (Fig. 3). It was observed that the F/F0 value obtained upon adding of SM1 was about 70% of the value obtained upon adding T1 (where F0 and F are the fluorescence intensity at 517 nm without and with the presence of target, respectively). However, the fluorescence intensity of the system in the presence of R only exhibited a slight enhancement. These results indicate that the sensing platform had a high selectivity for its target DNA.
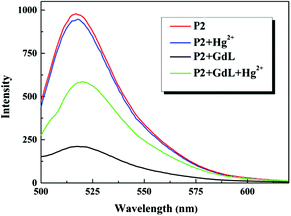
Moreover, this sensing platform not only offers a new approach to detect DNA, but also may has applications in detecting other target molecules such as heavy metal ions when complemented with the use of functioned DNA structures.17 Herein, we demonstrated the detection of mercuric ion (Hg2+) with a T-rich DNA (P2). In the absence of Hg2+, P2 was in the single-stranded state and not fluorescent in the presence of GdL. However, the addition of Hg2+ led to the formation of the double helical structure that could not be quenched by GdL (Fig. 4). Thus, the fluorescence intensity of P2 depended on the concentration of Hg2+ (Fig. S14†). Furthermore, this Hg2+ sensor possessed an excellent selective signal towards Hg2+ with respect to a range of interference metal ions (Fig. 5).
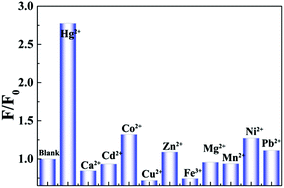 | ||
| Fig. 5 Selectivity of the sensing system against other metals, F and F0 represent the fluorescence intensity of P/GdL with and without metal ions (10.0 μM), respectively. λex/λem = 480/517 nm. | ||
Conclusions
In conclusion, a novel strategy of a CP, GdL, as the sensing platform for fluorescence-enhanced detection of DNA sequences and Hg2+ ions was presented. The crystal structure of GdL showed high thermal stability to 400 °C and water stability for a wide pH range (pH 2–10). The fluorescence emission of ssDNA could be quenched effectively by GdL, whereas it would recover with target DNA sequence or Hg2+ ion. This sensing platform was further demonstrated with good selectivity to distinguish complementary and mismatched DNA sequences. Therefore, the strategy described herein would promote biological applications of CPs and offer new insights into design of CPs-based biosensors for biomolecule detection.Acknowledgements
The authors are grateful for the financial aid from the National Natural Science Foundation of China (Grant No. 51372242, 91122030 and 21210001), the National Key Basic Research Program of China (No. 2014CB643802), and Jilin Province Youth Foundation (20130522122JH).Notes and references
- (a) M. J. Heller, Annu. Rev. Biomed. Eng., 2002, 4, 129–153 CrossRef CAS PubMed; (b) D. Gresham, D. M. Ruderfer, S. C. Pratt, J. Schacherer, M. J. Dunham, D. Botstein and L. Kruglyak, Science, 2006, 311, 1932–1936 CrossRef PubMed.
- I. M. Mackay, K. E. Arden and A. Nitsche, Nucleic Acids Res., 2002, 30, 1292–1305 CrossRef CAS PubMed.
- (a) X. Liu, R. Aizen, R. Freeman, O. Yehezkeli and I. Willner, ACS Nano, 2012, 6, 3553–3563 CrossRef CAS PubMed; (b) C. Zhu, Z. Zeng, H. Li, F. Li, C. Fan and H. Zhang, J. Am. Chem. Soc., 2013, 135, 5998–6001 CrossRef CAS PubMed.
- (a) D. Li, S. Song and C. Fan, Acc. Chem. Res., 2010, 43, 631–641 CrossRef CAS PubMed; (b) F. S. Diba, S. Kim and H. J. Lee, Biosens. Bioelectron., 2015, 72, 355–361 CrossRef CAS PubMed.
- S. He, B. Song, D. Li, C. Zhu, W. Qi, Y. Wen, L. Wang, S. Song, H. Fang and C. Fan, Adv. Funct. Mater., 2010, 20, 453–459 CrossRef CAS.
- (a) E. H. Zhao, B. Ergul and W. Zhao, J. Phys. Chem. B, 2015, 119, 4068–4075 CrossRef CAS PubMed; (b) J. Zheng, J. Bai, Q. Zhou, J. Li, Y. Li, J. Yang and R. Yang, Chem. Commun., 2015, 51, 6552–6555 RSC.
- H. Li, Y. Zhang, L. Wang, J. Tian and X. Sun, Chem. Commun., 2011, 47, 961–963 RSC.
- (a) K. Wang, Z. Tang, C. J. Yang, Y. Kim, X. Fang, W. Li, Y. Wu, C. D. Medley, Z. Cao, J. Li, P. Colon, H. Lin and W. Tan, Angew. Chem., Int. Ed., 2009, 48, 856–870 CrossRef CAS PubMed; (b) Y. Zhang, B. Zheng, C. Zhu, X. Zhang, C. Tan, H. Li, B. Chen, J. Yang, J. Chen, Y. Huang, L. Wang and H. Zhang, Adv. Mater., 2015, 27, 935–939 CrossRef CAS PubMed.
- (a) V. Guillerm, D. Kim, J. F. Eubank, R. Luebke, X. Liu, K. Adil, M. S. Lah and M. Eddaoudi, Chem. Soc. Rev., 2014, 43, 6141–6172 RSC; (b) S.-N. Zhao, L.-J. Li, X.-Z. Song, M. Zhu, Z.-M. Hao, X. Meng, L.-L. Wu, J. Feng, S.-Y. Song, C. Wang and H.-J. Zhang, Adv. Funct. Mater., 2015, 25, 1463–1469 CrossRef CAS.
- (a) J. Liu, W. Xia, W. Mu, P. Li, Y. Zhao and R. Zou, J. Mater. Chem. A, 2015, 3, 5275–5279 RSC; (b) J. A. Mason, T. M. McDonald, T. H. Bae, J. E. Bachman, K. Sumida, J. J. Dutton, S. S. Kaye and J. R. Long, J. Am. Chem. Soc., 2015, 137, 4787–4803 CrossRef CAS PubMed.
- (a) E. Lopez-Maya, C. Montoro, L. M. Rodriguez-Albelo, S. D. Aznar Cervantes, A. A. Lozano-Perez, J. L. Cenis, E. Barea and J. A. Navarro, Angew. Chem., Int. Ed., 2015, 54, 6790–6794 CrossRef CAS PubMed; (b) K. Manna, T. Zhang, M. Carboni, C. W. Abney and W. Lin, J. Am. Chem. Soc., 2014, 136, 13182–13185 CrossRef CAS PubMed.
- Y. Wang, J. Yang, Y. Y. Liu and J. F. Ma, Chem. – Eur. J., 2013, 19, 14591–14599 CrossRef CAS PubMed.
- (a) P. Wen, P. Gong, J. Sun, J. Wang and S. Yanga, J. Mater. Chem. A, 2015, 3, 13874–13883 RSC; (b) T. Wang, Q. Zhou, X. Wang, J. Zheng and X. Li, J. Mater. Chem. A, 2015, 3, 16435–16439 RSC.
- (a) X.-Z. Song, S.-Y. Song, S.-N. Zhao, Z.-M. Hao, M. Zhu, X. Meng, L.-L. Wu and H.-J. Zhang, Adv. Funct. Mater., 2014, 24, 4034–4041 CrossRef; (b) Y. Cui, Y. Yue, G. Qian and B. Chen, Chem. Rev., 2012, 112, 1126–1162 CrossRef PubMed.
- (a) S. Liu, L. Wang, J. Tian, Y. Luo, G. Chang, A. M. Asiri, A. O. Al-Youbi and X. Sun, ChemPlusChem, 2012, 77, 23–26 CrossRef CAS; (b) X. Zhu, H. Zheng, X. Wei, Z. Lin, L. Guo, B. Qiu and G. Chen, Chem. Commun., 2013, 49, 1276–1278 RSC.
- (a) X. Wei, L. Zheng, F. Luo, Z. Lin, L. Guo, B. Qiu and G. Chen, J. Mater. Chem. B, 2013, 1, 1812–1817 RSC; (b) Y. Wu, J. Han, P. Xue, R. Xu and Y. Kang, Nanoscale, 2015, 7, 1753–1759 RSC.
- (a) D. Wu, Q. Zhang, X. Chu, H. Wang, G. Shen and R. Yu, Biosens. Bioelectron., 2010, 25, 1025–1031 CrossRef PubMed; (b) S. Wen, T. Zeng, L. Liu, K. Zhao, Y. Zhao, X. Liu and H. C. Wu, J. Am. Chem. Soc., 2011, 133, 18312–18317 CrossRef CAS PubMed.
- (a) H. Li, J. Zhai, J. Tian, Y. Luo and X. Sun, Biosens. Bioelectron., 2011, 26, 4656–4660 CrossRef CAS PubMed; (b) X. Tang, H. Liu, B. Zou, D. Tian and H. Huang, Analyst, 2012, 137, 309–311 RSC.
- SAINT, Program for Data Extraction and Reduction, Bruker AXS, Inc., Madison, WI, 2001 Search PubMed.
- G. M. Sheldrick, SADABS, University of Göttingen, Göttingen, Germany, 1996 Search PubMed.
- G. M. Sheldrick, SHELXL-97, Program for Refinement of Crystal Structures, University of Göttingen, Germany, 1997 Search PubMed.
- T. Panda, P. Pachfule and R. Banerjee, Chem. Commun., 2011, 47, 7674–7676 RSC.
- (a) X.-H. Zhou, Y.-H. Peng, X.-D. Du, C.-F. Wang, J.-L. Zuo and X.-Z. You, Cryst. Growth Des., 2009, 9, 1028–1035 CrossRef; (b) S.-N. Zhao, X.-Z. Song, M. Zhu, X. Meng, L.-L. Wu, S.-Y. Song, C. Wang and H.-J. Zhang, RSC Adv., 2015, 5, 93–98 RSC.
Footnote |
| † Electronic supplementary information (ESI) available: Information of materials and measurements, synthesis and characterization data, supplementary data and figures, TGA and powder X-ray diffraction analyses. CCDC 1423187. For ESI and crystallographic data in CIF or other electronic format see DOI: 10.1039/c5qi00252d |
| This journal is © the Partner Organisations 2016 |

