
Phase and morphology evolution during the solvothermal synthesis of VO2 polymorphs†
Liangmiao
Zhang‡
a,
Fang
Xia‡
b,
Zhengdong
Song
c,
Nathan A. S.
Webster
d,
Jingchao
Song
ef,
Hongjie
Luo
ac and
Yanfeng
Gao
*c
aShanghai Institute of Ceramics (SIC), Chinese Academy of Sciences (CAS), 1295 Dingxi Rd, Shanghai 200050, China
bSchool of Engineering and Information Technology, Murdoch University, Murdoch, WA 6150, Australia
cSchool of Materials Science and Engineering, Shanghai University, 99 Shangda Rd, Shanghai 200444, China. E-mail: yfgao@shu.edu.cn
dCSIRO Mineral Resources, Private Bag 10, Clayton South, VIC 3169, Australia
eCSIRO Manufacturing, Clayton, VIC 3168, Australia
fDepartment of Materials Science and Engineering, Monash University, Clayton, VIC 3800, Australia
First published on 11th November 2015
Abstract
The phase and morphological features of materials are often tunable by adjusting the reaction parameters of solvothermal synthesis but this versatility also poses a challenge for preparing materials with a desired phase and morphology if the behaviors of phase and morphological evolution during the solvothermal synthesis are not known. In this work, the formation and growth of VO2 nanomaterials in the solvothermal systems via the reduction of V2O5 by ethylene glycol (EG) were investigated by in situ powder X-ray diffraction (PXRD). The results show that both fast and slow heating produce the same VO2(B) final product but the phase evolution during the synthesis is very sensitive to the heating rate. Fast heating (10 °C min−1) involves an unknown intermediate while V3O7·H2O is the intermediate phase at slow heating (2 °C min−1). The formation mechanism was employed to design the synthesis of VO2(B) nanorods and the phase transformation paths were verified by large-scale batch synthesis. Furthermore, ex situ PXRD and SEM were employed to follow the structure and morphology evolution during growth. This research indicates that in situ PXRD, as a powerful tool to monitor the whole reaction process and to collect information such as phase evolution and the fate of the transient intermediates, can be used to direct the controlled synthesis of materials.
1. Introduction
Vanadium dioxide (VO2) is one of the most important metal oxides and has been widely studied and applied in the field of sensors,1 catalysts,2 smart windows,3 lithium-ion batteries,4 and so on. To date, VO2 has been found to exhibit the richest family of crystalline polymorphs, such as thermodynamically stable VO2(M), VO2(R) phases, metastable VO2(A), VO2(B), VO2(D), VO2(P) phases, etc.5 The distinguishing feature of each VO2 polymorph is the arrangement scheme of edge- or corner-sharing VO6 octahedra.6 It is well known that the chemical and physical properties of nanomaterials are greatly influenced by the size, shape and crystal structure of the materials. Therefore, it is of paramount importance to understand the material formation and growth behaviour and ultimately enable the tailored synthesis of VO2 with a controllable phase, size and morphology.Various physical and chemical methods have been employed to prepare vanadium dioxides, including chemical vapour deposition,7 the ion implantation technique,8 hydro/solvothermal growth,9 sol–gel synthesis,10 and precursor pyrolysis.11 However, most of the methods are expensive, inefficient, and energy-intensive. Among the aforementioned methods, the hydro/solvothermal route is promising as it offers advantages of low cost, high yield, and is relatively environmentally benign. Selective formation of vanadium oxides with desired phase compositions can be achieved by hydrolysis of vanadium containing precursors,12,13 reduction of pentavalent vanadium compounds (V2O5, NH4VO3) by reducing agents (oxalic acid,14,15 PEG,16 or EG17), and homogeneous precipitation of VOSO4 with urea under mild hydro/solvothermal conditions.18 The synthesis is very sensitive to reaction parameters such as temperature, solvent composition, precursor concentration, reaction time, pH value, and autoclave filling ratio.19 As we know, tuning the experimental parameters in a hydrothermal reaction system, various VO2 polymorphs can be successfully synthesized. Nevertheless, the interplay between these parameters is complicated, and hence the synthesis of vanadium oxides with desired composition often requires many ‘trial and error’ experiments and strictly controlled conditions. Although a number of reaction mechanisms have been proposed, they are based on ex situ characterization and little direct evidence has been gathered for the phase transformations and complex redox reactions that occurred under the hydro/solvothermal synthesis conditions. A clearer understanding of the process is essential for more efficient and tailored synthesis of vanadium dioxides, and this requires in situ monitoring of the hydro/solvothermal synthesis.
In situ PXRD offers such an opportunity to monitor the hydro/solvothermal synthesis and is able to provide a clear synthesis mechanism that can guide the batch autoclave synthesis. Compared with traditional ex situ PXRD characterization, in situ PXRD allows for observation of the short-lived intermediate phases which are often missed by ex situ characterization. In situ PXRD has been shown to be a powerful tool for understanding the hydro/solvothermal syntheses of a number of materials, including MnO2,20 colloid Au nanoparticles,21 CoAPO-5 molecular sieves,22 Bi2SexTe3−x (x = 0–3) hexagonal nanoplatelets,23 mesoporous TiO2 beads,24 WOx–ethylenediamine nanowires,25 γ/β-MnO2![[thin space (1/6-em)]](https://www.rsc.org/images/entities/char_2009.gif) 26 and VO2(A).5
26 and VO2(A).5
In this paper, we prepared various nano-VO2 polymorphs by the reduction of V2O5 using ethylene glycol (EG) as the reducing agent. In order to understand the process involved, we employ in situ PXRD to follow the phase evolution during the synthesis of VO2 polymorphs via a redox reaction between V2O5 and EG. Clear phase transformation paths have been revealed. The obtained mechanism was used for the design of batch autoclave syntheses and the desired products were successfully prepared and characterized by ex situ XRD, XPS, SEM and TEM. Moreover, the intermediate phases were captured by ex situ PXRD and the morphology evolution process was investigated by ex situ SEM.
2. Experimental section
2.1 In situ PXRD experiments
One synchrotron-based in situ PXRD (SB-PXRD) experiment was conducted on the powder diffraction beamline at the Australian Synchrotron and another laboratory-based in situ PXRD (LB-PXRD) experiment was carried out using an Inel Equinox 3000 instrument at CSIRO Mineral Resources. For the SB-PXRD experiment, the X-ray wavelength (λ = 0.6889 Å) was calibrated using the LaB6 standard (NIST SRM 660b). For the LB-PXRD experiment, Mo Kα radiation (λ = 0.7093 Å) from a tube operated at 40 kV and 40 mA was used. The sample presentation setups used in SB-PXRD and LB-PXRD experiments were the same and have been described in detail elsewhere.5,23–25 The starting precursor (homogenized mixture of 0.25 g V2O5, 0.077 mL EG and 1.331 mL Milli-Q water) was injected into a quartz glass capillary (1 mm in outer diameter, 0.1 mm in wall thickness, and 40 mm in length), which was then fitted to a custom-made stainless steel holder. 4 MPa and 3 MPa external N2 pressures were applied to the capillary during the synthesis to prevent oxidation and boiling of the solvent in the SB-PXRD and LB-PXRD experiments, respectively. The slurry-containing capillary was fixed at the X-ray beam center and was heated to synthesis temperature by using a hot air blower beneath the capillary. To study the effect of heating rate on the synthesis mechanism, a fast heating rate (10 °C min−1) was used in the SB-PXRD experiment, while a slower heating rate (2 °C min−1) was used in the LB-PXRD experiment. The temperature was monitored by using a K-type thermocouple located 3.5 mm beneath the capillary and in the stream of hot air. In situ PXRD patterns were collected continuously during the synthesis, with individual datasets collected for ∼2 min. The detectors for both the SB-PXRD and LB-PXRD experiments were wide-angle 1D detectors capable of collecting >80° 2θ simultaneously. The capillary was oscillated continuously during the measurements, which ensured temperature homogeneity and minimized potential effects of preferred orientation. In the LB-PXRD experiment, a surveillance camera was also used to monitor the visual appearance of the contents in the capillary reaction vessel as the synthesis reaction progressed (Fig. S4†).2.2 Designed batch autoclave synthesis
The synthesis mechanism obtained from in situ PXRD was used to design the large scale synthesis using conventional laboratory autoclaves. The samples from autoclave syntheses also provided an opportunity to study the morphological evolution during the syntheses. Typically, 20 mL deionized water was mixed with 0.43 mL EG. Subsequently, 1.41 g V2O5 was added into the mixed solvent with continuous magnetic stirring to form an orange suspension. The mixture was then transferred into a 25 mL Teflon-lined stainless steel autoclave. The autoclave was heated at the designed temperature for several hours and cooled down to room temperature naturally. The as-prepared powders were separated by centrifugation, washed with distilled water and absolute ethanol several times and dried under vacuum at 60 °C in an oven overnight.2.3 Ex situ characterization
The morphology of the as-prepared batch autoclave samples was examined using field-emission scanning electron microscopy (FESEM, JSM-6700F, JEOL, Japan) and high-resolution transmission electron microscopy (TEM, JEM-2010F, JEOL). The phase structure was identified using PXRD on a Rigaku D/Max-RB X-ray diffractometer with Cu Kα radiation (λ = 1.5418 Å). X-ray photoelectron spectroscopy (XPS) spectra were recorded on a VG ESCALAB MK II system equipped with Al KR radiation as the X-ray source.3. Results and discussion
3.1 In situ PXRD characterization
The accumulated time-resolved in situ SB-PXRD patterns viewed down the intensity axis, for synthesis of VOx nanostructures with equivalent moles of EG and V2O5, are shown in Fig. 1. The SB-PXRD pattern of the starting material can be indexed to the orthorhombic phase of V2O5 (JCPDS card No. 01-0359) (Fig. S1†). When the heating rate was 10 °C min−1, V2O5 transformed to a new compound in the temperature interval 210–240 °C, which does not match any vanadium oxide or hydrated vanadium oxide phase in the latest ICDD PDF database. The crystal structure could not be determined for this intermediate phase as the signal to noise ratio of the in situ diffraction pattern is not sufficiently high (Fig. S2†). With further heating, the typical peaks of the intermediate faded very quickly. Meanwhile, the peaks of VO2(B) (JCPDS card No. 81-2392) (Fig. 1 and S3†) grew rapidly and the three strongest peaks appeared at 11.2°, 13.4°, and 21.4°, corresponding to the (110), (111), and (020) lattice planes of the VO2(B) crystallites, respectively. | ||
| Fig. 1 Accumulated time-resolved in situ SB-PXRD patterns (viewed down the intensity axis) collected during the synthesis at 250 °C with a heating rate of 10 °C min−1. | ||
Fig. 2 shows the results of the in situ LB-PXRD experiment, where a slower heating rate (2 °C min−1) was employed. As shown in Fig. 2, the peaks of the monoclinic V2O5 (JCPDS card No. 01-0359) precursor continuously diminish at 220 °C, until it is consumed to form the intermediate compound V3O7·H2O (JCPDS card No. 28-1433). In order to capture this phase in more detail, the temperature was maintained at 220 °C for 60 min, before the temperature was increased to 240 °C upon which the intermediate V3O7·H2O was further reduced to the monoclinic VO2(B) (JCPDS card No. 81-2392).
 | ||
| Fig. 2 Accumulated time-resolved in situ LB-PXRD patterns (viewed down the intensity axis) collected during the synthesis at 240 °C with slow heating (2 °C min−1). | ||
Although the same final products (VO2(B)) are obtained under fast and slow heating conditions, different intermediate phases are involved. As the reaction proceeds, the fraction of VO2(B) increases at the expense of the intermediates. The in situ data reveal that the formation mechanism for VO2(B) is highly dependent on the heating rate. The reducing process from V2O5 to VO2(B) with a reducing agent (EG) can be described as a two-step process from partial reduction–hydration to complete reduction and dehydration with the following equations:
Fast heating (10 °C min−1)
Step 1: V2O5 + H2O + EG → unknown intermediate
Step 2: unknown intermediate + EG → VO2(B) + H2O
Slow heating (2 °C min−1)
Step 1: V2O5 + H2O + EG → V3O7·H2O
Step 2: V3O7·H2O + EG → VO2 (B) + H2O
Note that the above reactions are not balanced because the oxidation products of EG are unknown. As shown in the equations above, V2O5 and EG completely react with each other to form a reaction intermediate in the early stage of the reduction process. The intermediate is V3O7·H2O for the synthesis at 240 °C with a slow heating rate of 2 °C min−1 and the vanadium presents as a mixture of V(IV) and V(V). For fast heating (10 °C min−1) at 250 °C, it is also likely that the vanadium presents as a mixture of V(IV) and V(V). As the reaction progresses, the remaining V(V) in the intermediate compound is further reduced, resulting in VO2(B). The mechanisms determined here are quite different from the mechanism proposed by Pollet,27 who reported the formation of the intermediate compound VO2·xH2O between V10O24·9H2O and VO2(B).
3.2 Designed batch autoclave synthesis
In situ experiments give us the first-hand information about the synthesis in real time, and provide the basis for the design of batch autoclave synthesis. Batch autoclave synthesis of VO2(B) was conducted using the same precursor, and at 220 °C for 12 h with a heating rate of 4 °C min−1. The chemical composition and phase structure of the as-synthesized powders were identified by PXRD and XPS, and the results are shown in Fig. 3 and 7e. All the diffraction peaks can be perfectly indexed to the monoclinic phase of VO2(B) (JCPDS card, no. 81-2392) (Fig. 7e). The V 2p peaks of the sample (Fig. 3b) can be fitted to three main peaks centred at 516.2 and 523.6 eV, which correspond to V4+ according to previous reports.28 Therefore, the as-prepared materials are pure monoclinic VO2(B).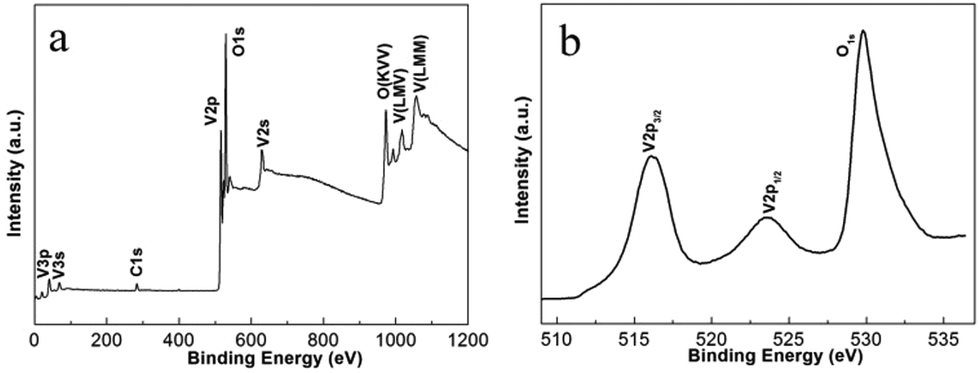 | ||
| Fig. 3 XPS of VO2(B) products (a) full survey spectrum; (b) core-level spectra of V2p and O1s. | ||
The morphologies of the samples prepared at 220 °C for 12 h were investigated using SEM and TEM. Fig. 4a illustrates a representative SEM image of the as-prepared VO2(B) materials. A large quantity of uniform and well-dispersed nanorods were obtained with an average cross-section dimension of 200 nm × 300 nm and an average length of ∼1 μm. Fig. 4b shows the detailed morphology at the end of an individual nanorod, distinctly showing the round tip and smooth edge surface. Further inspection using high-resolution TEM (HRTEM) (Fig. 4d) reveals the well-resolved lattice fringes with an interplanar distance of 0.357 nm, in accordance with the spacing of (110) planes of VO2(B). The corresponding selected area electron diffraction (SAED) pattern (Fig. 4c) taken from the area marked by red circle (Fig. 4b) displays a regular diffraction pattern, further affirming the single-crystal nature of these nanorods. When the samples were synthesized at 250 °C for 12 h (heating rate = 10 °C min−1), VO2(B) were also obtained (Fig. 5e), demonstrating that the large-scale batch synthesis results agree well with the final phases observed in the in situ experiments (Fig. 1). The TEM and SEM images (Fig. S5a, b† and 6e) distinctly show that the product consists of monodispersed nanorods and irregular nanoparticles. The interplanar distance of 0.357 nm matches well with the (110) plane spacing of monoclinic VO2(B), which indicates a preferred growth direction along [001] of monoclinic VO2(B). The corresponding SAED pattern (Fig. S5c†) also reveals the crystalline nature of these nanorods.
 | ||
| Fig. 4 (a) SEM and (b) TEM images of VO2(B). (d) Its corresponding HRTEM image and (c) SAED pattern. | ||
 | ||
| Fig. 5 PXRD patterns of samples prepared at 250 °C (heating rate = 10 °C min−1) for different times. (a) 1 h, (b) 2 h, (c) 3 h, (d) 6 h, (e) 12 h, (f) 18 h. The JCPDS patterns for V5O12·6H2O, VO2(B) and VO2(D) are also shown. Patterns have been offset in the intensity axis for clarity. | ||
 | ||
| Fig. 6 SEM images of samples prepared at 250 °C (heating rate = 10 °C min−1) for various times. (a) 1 h; (b) 2 h; (c) 3 h; (d) 6 h; (e) 12 h; (f) 18 h. | ||
3.3 Morphology and phase evolution
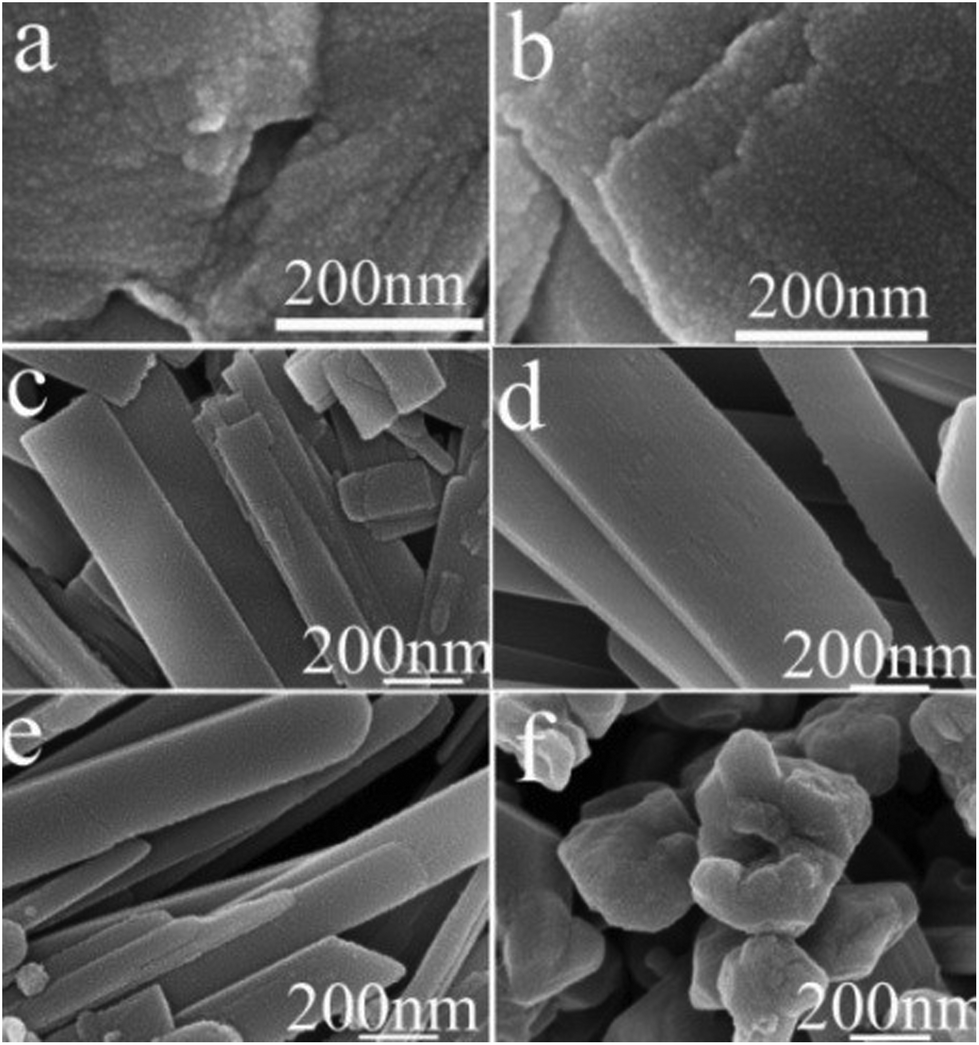
Both ex situ and in situ studies play important roles in understanding in detail the formation mechanism of materials. To further verify the in situ PXRD results and monitor the morphology evolution, a series of time-dependent experiments were designed and carried out, and the products were characterized by ex situ PXRD and SEM. When the reaction temperature was 220 °C (heating rate = 4 °C min−1), different morphologies were obtained with the reaction time increasing from 1 to 2, 3, 6, 12, and 18 h. The H2O molecules rapidly intercalate into the interlayer of V2O5 resulting in V3O7·H2O with a layer structure when the reactions were stopped after 1 and 2 h (Fig. 7a and b). Most of the irregular V2O5 microparticles (Fig. 8a) fused and combined together (Fig. 8b) to form nanorods covered on the surface of the original V2O5 microparticles, as shown in Fig. 8c and d. With the increase of the reaction time to 3, 6 and 12 h, abundant uniform nanorods were obtained and grown longer and thicker (Fig. 8e–j). When the reaction was terminated at 18 h, some nanorods broke and cavities were developed on the surface (Fig. 8k and l). The typical VO2(B) spheres with inner hollow structures emerged in the product, which are shown by a white arrow in Fig. 8l. Simultaneously, the samples transformed from a mixture of V3O7·H2O and VO2(B) to pure VO2(B) (Fig. 7c–f). When the reaction temperature was 250 °C (heating rate = 10 °C min−1), an obvious phase-forming sequence was observed: V2O5 to layered V5O12·6H2O assembled with nanocrystals and then to VO2(B) nanorods (Fig. 5 and 6). It is most likely that the unknown intermediate phase which was detected by in situ PXRD is only stable under the solvothermal synthesis conditions and this is why a different reaction intermediate V5O12·6H2O was detected by ex situ PXRD. When the reaction time was further increased to 18 h, the VO2(D) phase formed (Fig. 5f). Accordingly, the nanorods formed initially were broken completely into irregular nanoparticles with deep cavities (Fig. 6f).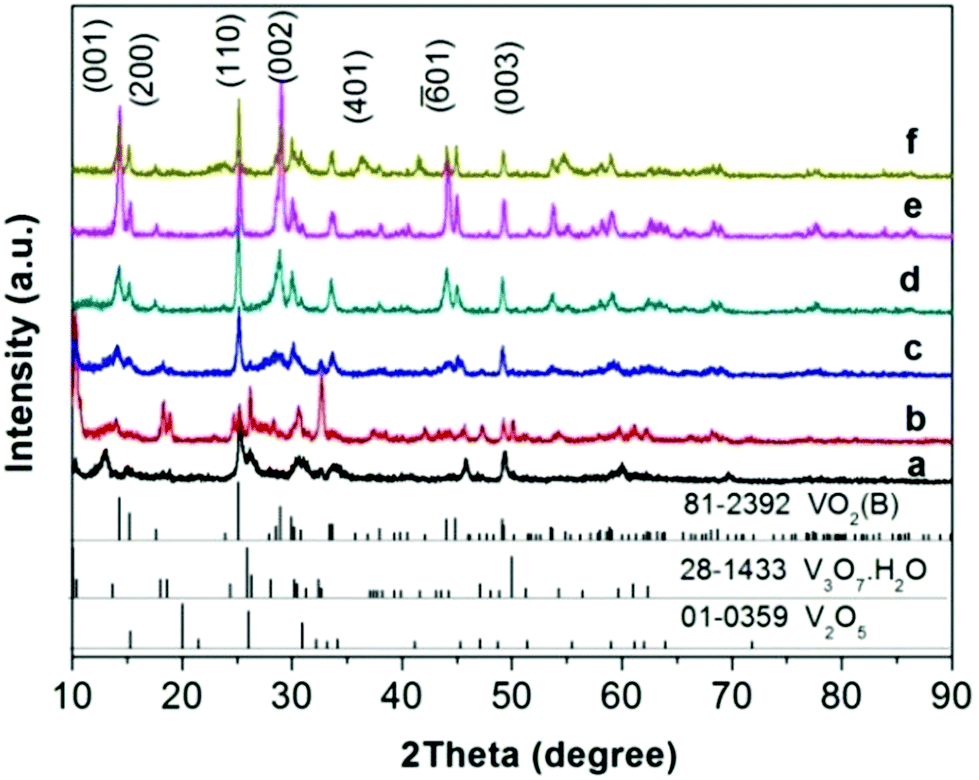 | ||
| Fig. 7 PXRD patterns of samples prepared at 220 °C (heating rate = 4 °C min−1) for various times. (a) 1 h, (b) 2 h, (c) 3 h, (d) 6 h, (e) 12 h, (f) 18 h. The JCPDS patterns for V2O5, V3O7·H2O and VO2(B) are also shown. Patterns have been offset in the intensity axis for clarity. | ||
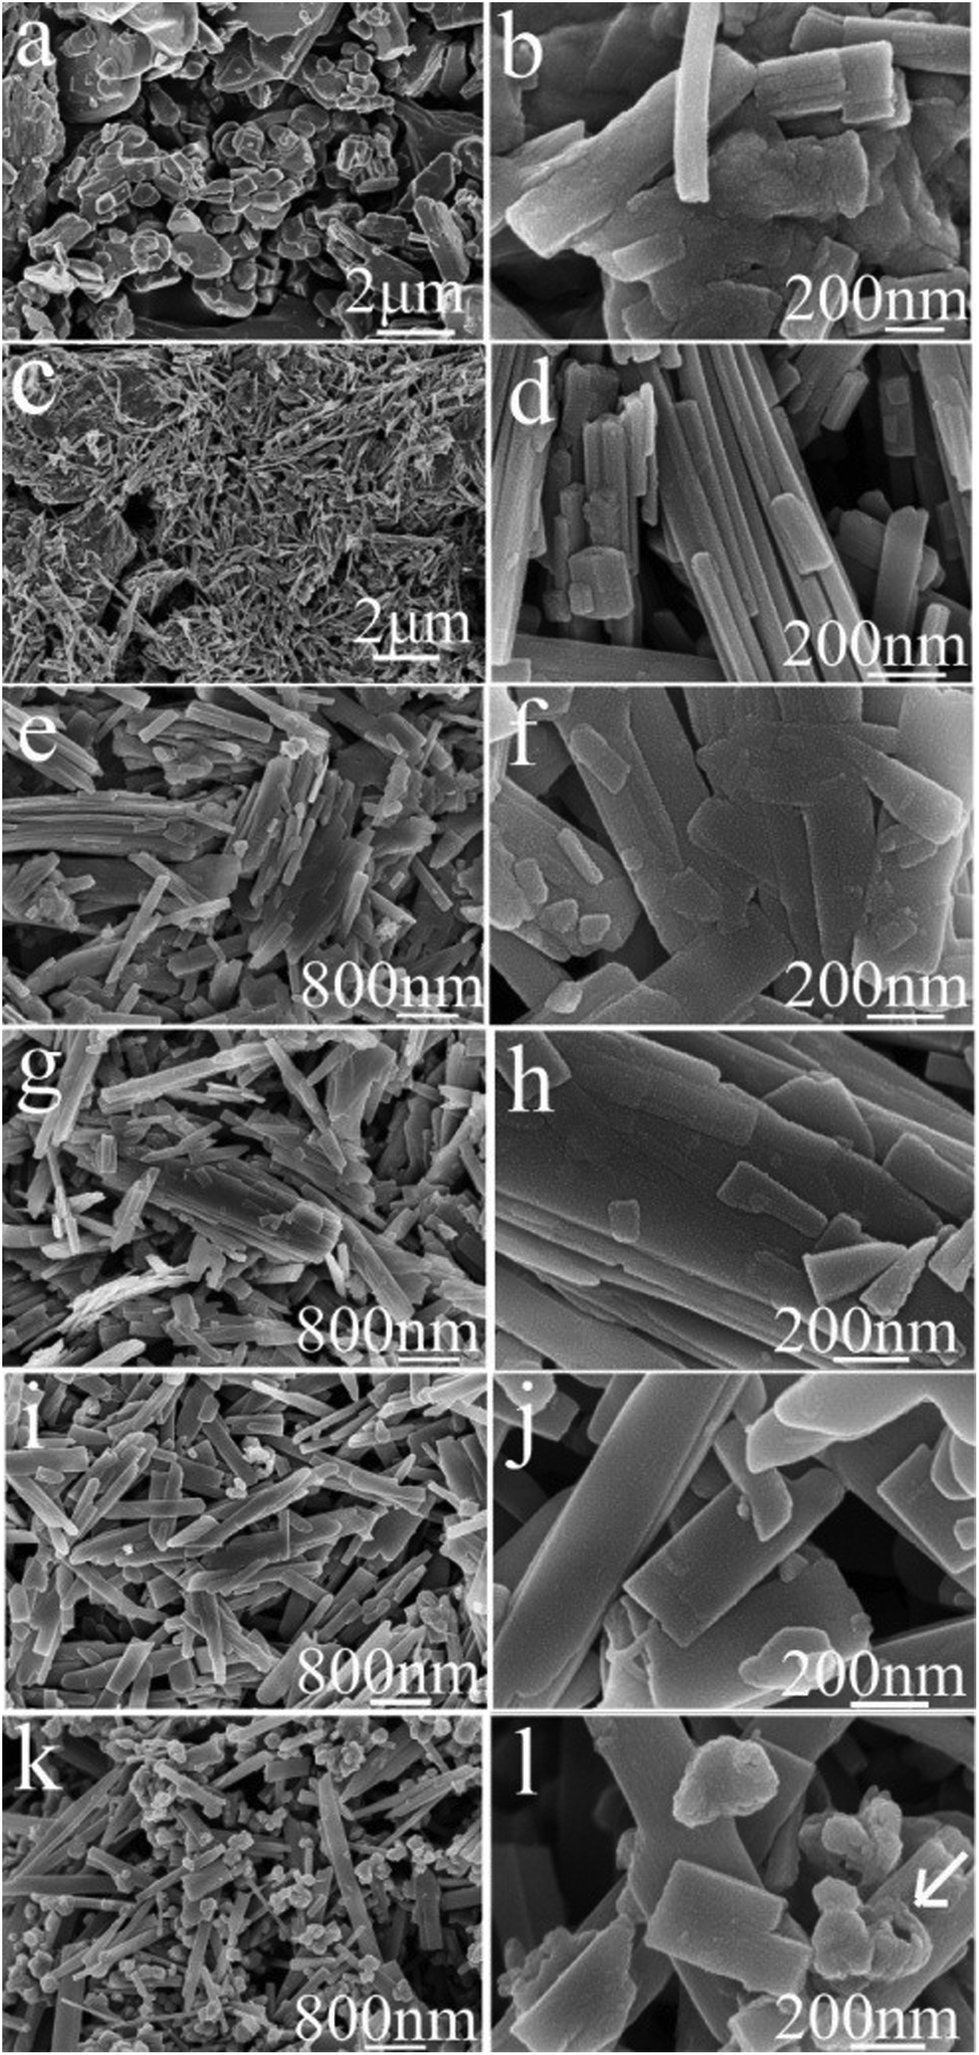 | ||
| Fig. 8 SEM images of (a) V2O5 and the products prepared at 220 °C (heating rate = 4 °C min−1) for different times. (b) 1 h; (c, d) 2 h; (e, f) 3 h; (g, h) 6 h; (i, j) 12 h; (k, l) 18 h. | ||
It was also found that the reaction temperature has a significant influence on the morphology and phase evolution. Fig. 9a, b, e and f show SEM images of VO2 materials prepared by autoclaving the V2O5 and EG at different temperatures with a constant holding time of 24 h; their corresponding PXRD patterns are reported in Fig. 9c, d, g and h. It can be seen that the aligned VO2(B) nanorods with diameters of 40–80 nm and lengths up to 1 μm were obtained at 180 °C (Fig. 9a and c).These nanorods grew in size with increasing temperatures. At a higher temperature of 240 °C, the nanorods intersected with each other and quite a few etched polyhedra were obtained (Fig. 9e). With a further increase in temperature to 260 °C, homogeneous VO2(D) nano-dodecahedra with open holes were observed, as shown in Fig. 9f, which suggests that the as-obtained VO2(D) nano-dodecahedra with a unique architecture are monodispersed and in high yield. In all, further increasing the temperature or prolonging the reaction time, VO2(D) may be formed, but they are not observed by the in situ PXRD due to its long generation time. Usually, more than ten hours are required to obtain the pure VO2(D) phase.
 | ||
| Fig. 9 SEM images and their corresponding PXRD patterns of samples prepared at different temperatures for 24 h. (a, c) 180 °C; (b, d) 200 °C; (e, g) 240 °C; (f, h) 260 °C. | ||
EG has been extensively used as a solvothermal solvent for the synthesis of vanadium oxide nanomaterials with a hierarchical structure.2,14,17,29 For example, Du and coworkers17 have synthesized V4O7 hierarchical structures in a water–EG mixed medium by simply adjusting the amount of water in the EG solvent. Qian and coworkers30 have prepared VO2(B) nanowire arrays by reduction of V2O5 in a pure EG solvent. Cao and coworkers31 have fabricated nanostructured V2O5 hollow microspheres by calcination of vanadyl glycolate precursors also formed in pure EG solvent. The morphologies and phases of VO2 are reported to be extremely dependent on the reaction temperature and time. When the reaction temperature is varied, the physical and chemical properties of the solvent such as density, viscosity, dielectric constant, and ionic product can be changed. Thus, the reactivity, solubility, and diffusion rate of the reagents and intermediates can be greatly influenced, leading to various morphologies and structures of the products. On the basis of in situ and ex situ results, a plausible formation mechanism for the formation of various VO2 polymorphs can be illustrated in Scheme 1. Under the solvothermal synthesis conditions, irregular V2O5 particles, exhibiting layers of edge- and corner-sharing VO5 square pyramids,32 are initially reduced and fused into layered hydrated vanadium oxide intermediate compounds, with the vanadium presenting as a mixture of V(IV) and V(V). The very loosely stacked V–O layers in the intermediate phases endow the ability to insert guest species of H2O between the interlayers of these materials (Fig. S6a†). Further reduction results in reassembly into VO2(B) nanorods growing along a preferred orientation [001]. As time elapses further, the well formed structure is broken, and the irregular nanoparticles reassemble into hollow dodecahedra, hollow spheres or particles of VO2(B) (Fig. S6b†) or VO2(D) (Fig. S6c†). These nanostructures contain deep cavities and the inside-out Ostwald ripening may be responsible for the controllable growth of these hollow structures. A similar formation process has also been reported for the synthesis of AlOOH hollow core–shell microspheres,33 hollow VO2 microspheres34, SnO2 hollow nanospheres,35etc. As reported by previous theoretical computation,36–38 the formation energy of VO2(D) is similar to the stable VO2(R) phase, and is lower than that of VO2(B). Therefore, the transformation from the monoclinic VO2(B) phase to VO2(D) is driven by thermodynamics.
 | ||
| Scheme 1 Schematic representation of the evolution process for various VO2 polymorph formations. | ||
We also found that the formation of VOx polymorphs strongly depends on the molar ratios of EG to V2O5. As for the lower EG content, a microemulsion system formed, the morphology is greatly dependent on the shape of the emulsion. When the molar ratio of EG to V2O5 was changed, the volume ratio of EG to water was changed accordingly. The lower molar ratios favour the formation of VO2(B) nanorods or the mixture of V2O3 and V5O9 phases with a plate-like morphology (Fig. 10a and d). When the molar ratio is increased to 4 or above, spherical V2O3 nanoparticles with a narrow size distribution of 15–30 nm are the dominant products (Fig. 10b–d). Their detailed formation mechanism needs further study.
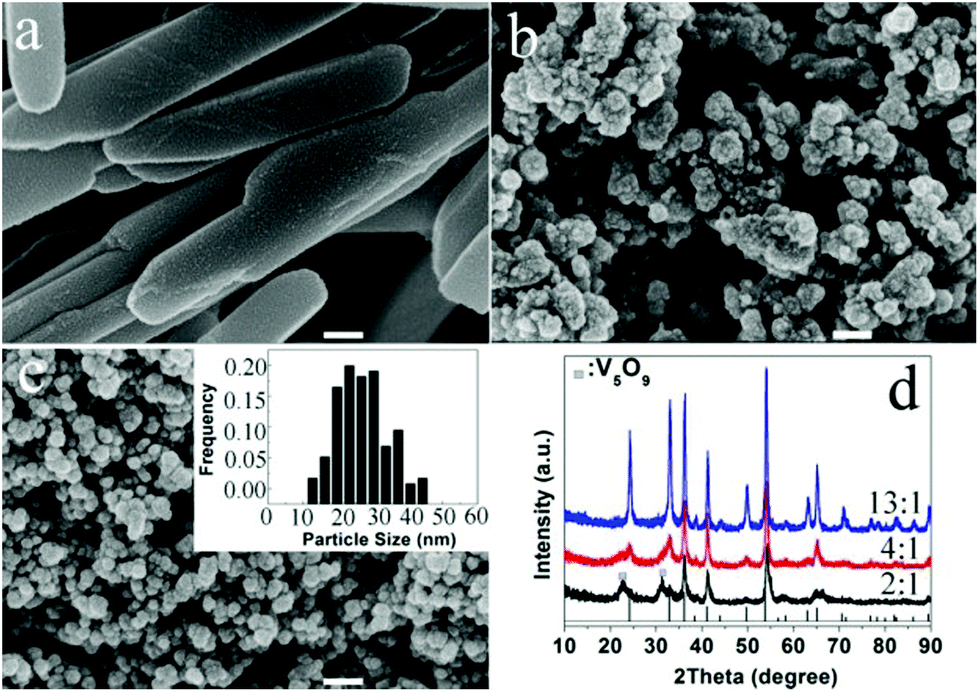 | ||
| Fig. 10 (a–c) SEM images of samples prepared with various molar ratio of EG:V2O5 (2:1, 4:1, 13:1) at 260 °C for 4 h. The scale bar is 100 nm. The inset figure in c is the particle size distribution. (d) Their corresponding PXRD patterns. | ||
4. Conclusions
In summary, two in situ PXRD experiments demonstrate the phase evolution process during the solvothermal synthesis of VO2(B) nanorods through a facile solvothermal reduction of V2O5 by EG. These results were used to guide the ex situ batch autoclave synthesis. In addition, various VOx polymorphs including nanorods, nanospheres and hollow nanododecahedra can be successfully synthesized. The phase and morphology of these products can be tailored by simply adjusting the reaction time, temperature and molar ratio of EG to V2O5. The instructive and meaningful results may help to understand the formation mechanism on fundamental aspects during the hydro/solvothermal synthesis and improving the controlled synthesis technologies of vanadium oxide and other nanomaterials. Our ongoing research will focus on the underlying phase transformation based on structure analysis and their applications as catalysts, sensors, electrode materials, etc.Acknowledgements
The authors are grateful for the financial support from the National Natural Science Foundation of China (51172265 and 51325203), the Ministry of Science and Technology of China (2014AA032802), the Science and Technology Commission of Shanghai Municipality (13521102100), the Education Commission of Shanghai Municipal (14ZZ099), the Guangdong Provincial Department of Science and Technology (2011A091104001), the Materials Genome Institute of Shanghai University (14DZ2261200) and the China Postdoctoral Science and Foundation (2014M561528). This research was partially undertaken on the powder diffraction beamline at the Australian Synchrotron, Victoria, Australia, through the Science and Industry Endowment Fund Special Research Program-Synchrotron Science. We thank Dr Helen Brand and Dr Justin Kimpton for the beamline setup.Notes and references
- G. D. Nie, L. Zhang, J. Y. Lei, L. Yang, Z. Zhang, X. F. Lu and C. Wang, J. Mater. Chem. A, 2014, 2, 2910 CAS.
- X. Chen, F. Wang and J. Xu, Top. Catal., 2011, 54, 1016 CrossRef CAS.
- Y. F. Gao, H. J. Luo, Z. T. Zhang, L. T. Kang, Z. Chen, J. Du, M. Kanehira and C. X. Cao, Nano Energy, 2012, 1, 221 CrossRef CAS.
- C. Z. Wu and Y. Xie, Energy Environ. Sci., 2010, 3, 1191 CAS.
- L. M. Zhang, F. Xia, Z. D. Song, N. A. S. Webster, H. J. Luo and Y. F. Gao, RSC Adv., 2015, 5, 61371 RSC.
- L. Dai, Y. F. Gao, C. X. Cao, Z. Chen, H. J. Luo, M. Kanehira, J. Jin and Y. Liu, RSC Adv., 2012, 2, 5265 RSC.
- Z. J. Li, Z. P. Hu, J. Peng, C. Z. Wu, Y. C. Yang, F. Feng, P. Gao, J. L. Yang and Y. Xie, Adv. Funct. Mater., 2014, 24, 1821 CrossRef CAS.
- R. Lopez and L. A. Boatner, Phys. Rev. B: Condens. Matter Mater. Phys., 2002, 65, 224113 CrossRef.
- C. Z. Wu, F. Feng and Y. Xie, Chem. Soc. Rev., 2013, 42, 5157 RSC.
- O. Berezina, D. Kirienko and A. Pergament, Thin Solid Films, 2015, 574, 15 CrossRef CAS.
- N. Peys, P. Adriaensens, S. V. Doorslaer, S. Gielis, E. Peeters, C. D. Dobbelaere, S. D. Gendt, A. Hardy and M. K. V. Bael, Dalton Trans., 2014, 43, 12614 RSC.
- Y. F. Sun, B. Y. Qu, S. S. Jiang, C. Z. Wu, B. C. Pan and Y. Xie, Nanoscale, 2011, 3, 2609 RSC.
- Y. F. Sun, S. S. Jiang, W. T. Bi, R. Long, X. G. Tan, C. Z. Wu, S. Q. Wei and Y. Xie, Nanoscale, 2011, 3, 4394 RSC.
- C. J. Niu, J. S. Meng, C. H. Han, K. N. Zhao, M. Y. Yan and L. Q. Mai, Nano Lett., 2014, 14, 2873 CrossRef CAS PubMed.
- G. P. Nagabhushana and G. T. Chandrappa, J. Mater. Chem. A, 2013, 1, 11539 CAS.
- M. Li, F. Y. Kong, L. Li, Y. X. Zhang, L. Chen, W. W. Yan and G. H. Li, Dalton Trans., 2011, 40, 10961 RSC.
- X. R. Wang, S. L. Zheng, X. C. Mu, Y. Zhang and H. Du, Chem. Commun., 2014, 50, 6775 RSC.
- W. J. Li, S. D. Ji, Y. M. Li, A. B. Huang, H. J. Luo and P. Jin, RSC Adv., 2014, 4, 13026 RSC.
- J. H. Jung, C. Y. Chen, W. W. Wu, J. Hong, B. K. Yun, Y. S. Zhou, N. Lee, W. Jo, L. J. Chen, L. J. Chou and Z. L. Wang, J. Phys. Chem. C, 2012, 116, 22261 CAS.
- X. F. Shen, Y. S. Ding, J. C. Hanson, M. Aindow and S. L. Suib, J. Am. Chem. Soc., 2006, 128, 4570 CrossRef CAS PubMed.
- S. Peng, J. S. Okasinski, J. D. Almer, Y. Ren, L. Wang, W. G. Yang and Y. G. Sun, J. Phys. Chem. C, 2012, 116, 11842 CAS.
- D. Grandjean, A. M. Beale, A. V. Petukhov and B. M. Weckhuysen, J. Am. Chem. Soc., 2005, 127, 14454 CrossRef CAS PubMed.
- J. Song, F. Xia, M. Zhao, Y. L. Zhong, W. Li, K. P. Loh, R. A. Caruso and Q. Bao, Chem. Mater., 2015, 27, 3471 CrossRef CAS.
- F. Xia, D. Chen, N. V. Y. Scarlett, I. C. Madsen, D. Lau, M. Leoni, J. Ilavsky, H. E. A. Brand and R. A. Caruso, Chem. Mater., 2014, 26, 4563 CrossRef CAS.
- W. Li, F. Xia, J. Qu, P. Li, D. Chen, Z. Chen, Y. Yu, Y. Lu, R. A. Caruso and W. Song, Nano Res., 2014, 7, 903 CrossRef CAS.
- T. Gao, H. Fjellvåg and P. Norby, Nanotechnology, 2009, 20, 055610 CrossRef PubMed.
- S. R. Popuri, M. Miclau, A. Artemenko, C. Labrugere, A. Villesuzanne and M. Pollet, Inorg. Chem., 2013, 52, 4780 CrossRef CAS PubMed.
- L. Liu, T. Yao, X. G. Tan, Q. H. Liu, Z. Q. Wang, D. C. Shen, Z. H. Sun, S. Q. Wei and Y. Xie, Small, 2012, 8, 3752 CrossRef CAS PubMed.
- Q. Ji, Y. C. Jiang, Z. P. Zhang, Y. T. Tian and Z. Y. Wang, Z. Anorg. Allg. Chem., 2014, 640, 1965 CrossRef CAS.
- X. Y. Chen, X. Wang, Z. H. Wang, J. X. Wan, J. W. Liu and Y. T. Qian, Nanotechnology, 2004, 15, 1685 CrossRef CAS.
- E. Uchaker, N. Zhou, Y. W. Li and G. Z. Cao, J. Phys. Chem. C, 2013, 117, 1621 CAS.
- M. Winter, J. O. Besenhard, M. E. Spahr and P. Novák, Adv. Mater., 1998, 10, 725 CrossRef CAS.
- L. M. Zhang, W. C. Lu, R. R. Cui and S. S. Shen, Mater. Res. Bull., 2010, 45, 429 CrossRef CAS.
- F. Y. Kong, M. Li, X. Y. Yao, J. M. Xu, A. D. Wang, Z. P. Liu and G. H. Li, CrystEngComm, 2012, 14, 3858–3861 RSC.
- X. W. Lou, Y. Wang, C. Yuan, J. Y. Lee and L. A. Archer, Adv. Mater., 2006, 18, 2325 CrossRef CAS.
- L. Liu, F. Cao, T. Yao, Y. Xu, M. Zhou, B. Y. Qu, B. C. Pan, C. Z. Wu, S. Q. Wei and Y. Xie, New J. Chem., 2012, 36, 619 RSC.
- S. D. Zhang, B. Shang, J. L. Yang, W. S. Yan, S. Q. Wei and Y. Xie, Phys. Chem. Chem. Phys., 2011, 13, 15873 RSC.
- C. Z. Wu, X. D. Zhang, J. Dai, J. L. Yang, Z. Y. Wu, S. Q. Wei and Y. Xie, J. Mater. Chem., 2011, 21, 4509 RSC.
Footnotes |
| † Electronic supplementary information (ESI) available: In situ SR-XRD patterns, images and movie captured by using the surveillance camera, TEM images of samples prepared at 250 °C for 12 h, crystal structure models of (a) V3O7, (b) VO2(B) and (c) VO2(D). See DOI: 10.1039/c5qi00195a |
| ‡ These authors contributed equally to this work. |
| This journal is © the Partner Organisations 2016 |