 Open Access Article
5-Bromo-2′-deoxycytidine—a potential DNA photosensitizer†
Magdalena
Zdrowowicz
,
Paweł
Wityk
,
Barbara
Michalska
and
Janusz
Rak
*
Faculty of Chemistry, University of Gdańsk, Wita Stwosza 63, 80-308 Gdańsk, Poland. E-mail: janusz.rak@ug.edu.pl; Fax: +4858523 5771; Tel: +4858 523 5118
First published on 30th August 2016
Abstract
A double-stranded oligonucleotide, 80 base pairs in length, was multiply labeled with 5-bromo-2′-deoxycytidine (BrdC) using polymerase chain reaction (PCR). The modified oligonucleotide was irradiated with 300 nm photons and its damage was assayed by employing DHPLC, LC-MS and denaturing polyacrylamide gel electrophoresis (PAGE). Two types of damage were demonstrated, namely, single strand breaks (SSBs) and intrastrand cross-links (ICLs); the ICLs were in the form of d(G^C) and d(C^C) dimers. The former species are probably formed due to photoinduced electron transfer between the photoexcited BrdC and the ground state 2′-deoxyguanosine (dG), whereas the latter is a result of a cycloaddition reaction. Since SSBs and ICLs are potentially lethal to the cell, BrdC could be considered as a nucleoside with possible clinical applications.
1. Introduction
In the late 1950s, it was already demonstrated that 5-bromo-2′-deoxyuridine (BrdU) sensitizes E. coli cells to ultraviolet light,1,2 which is related to the incorporation of BrdU into cellular DNA. The strand breaks and cross-links belong to the most common damage induced by UV photons in BrdU-substituted DNA.3 As indicated by several photochemical studies, single strand breaks in such a system are formed primarily via the UV-induced long-range electron transfer (ET) from a distant ground-state guanine to the photo-excited BrdU.4 This process leads to the formation of a short-lived BrdU anion that releases the bromide anion5–7 and leaves the reactive uridine-5-yl radical in the DNA. The latter species is stabilized by abstracting a hydrogen atom from the adjacent sugar moiety that ultimately gives a strand break.8 On the other hand, cross-links, both intra- (intra-CLs) and interstrand (inter-CLs), appear, due to the attack of the uridine-5-yl radical on an adjacent base, giving a covalent base-base dimer as the end-product.9Much less is known about the photochemical properties of the remaining bromonucleosides (BrNucs). Discussing sparse data concerning the photochemistry of non-BrdU labeled DNA, one should mention the studies of Wang et al.,10,11 which demonstrate the formation of UV-induced intra-CLs in duplex oligonucleotides, point labeled with 5-bromo-2′-deoxycytidine (BrdC). Furthermore, the Chatgilialoglu group12,13 has shown the efficient photodebromination of 8-bromo-2′-deoxyadenosine (BrdA) and 8-bromo-2′-deoxyguanosine (BrdG) incorporated into dsDNA, induced by long-range electron transfer from a flavin electron donor to the brominated base. Although the rate of debromination was significantly smaller for bromopurine nucleosides than for BrdU, the overall process proceeds in a similar fashion in all the systems compared, which suggests that the brominated purines may play the role of DNA sensitizers. The properties of BrNucs mentioned above suggest that they could be exploited in a photodynamic therapy (PDT) that does not involve singlet oxygen—a species inherently related to PDT treatment.14 Since tumors are frequently hypoxic,15 the oxygen-independent mode of action is a clear advantage of BrNucs, as compared to most PDT drugs.
In the current work, we study the UVB damage to a double-stranded oligonucleotide, multiply substituted with 5-bromo-2′-deoxycytidine, in order to assess its photosensitizing properties. By comparison to the BrdU photosensitizer whose main mode of action is related to long range photoinduced ET,16 we assumed that BrdC should possess similar properties. Employing the PCR method, we synthesized an 80 bp DNA fragment in which all but the dC nucleosides present in the primers were replaced by BrdC. Using denaturing HPLC (DHPLC), gel electrophoresis and high-resolution mass spectrometry against the UV irradiated samples, we demonstrated the photochemically induced formation of strand breaks and intrastrand cross-links in the BrdC labeled oligonucleotide. Interestingly, all SSBs were formed in “hot spot” sequences, similar to those characteristic of photochemically induced SSBs in DNA labeled with BrdU (i.e. in the fragments where BrdC was separated from the G base by several AT base pairs). Since SSBs may lead to double strand breaks (DSBs; even a single unrepaired DSB is sufficient to kill a eukaryotic cell17) during DNA repair or biosynthesis,18 and intra-CL causes the most cytotoxic19 damage; the studied nucleoside (possibly in the form of an appropriate pro-drug) could broaden a very modest pool of PDT drugs used nowadays.20
2. Experimental section
Chemicals and reagents
The enzymes for enzymatic digestion [DNase I, snake venom phosphodiesterase (SVP), calf spleen phosphodiesterase (CSP), the bacterial alkaline phosphatase (BAP) and nuclease P1], the mobile phases components [LC-MS grade acetonitrile, methanol, hexafluoroisopropanol (HFIP), formic acid, acetic acid and triethylamine] and standard deoxynucleotide set were purchased from Sigma Aldrich; the DNA purification kit from Eurx Molecular Biology Products (Gdansk, Poland), and Marathon DNA polymerase from A&A Biotechnology (Gdynia, Poland). The 5-bromo-2′-deoxycytidine-5′-triphosphate (BrdCTP) was bought from TriLink Biotechnologies (San Diego, CA, United States). The oligonucleotides (PCR primers and template) were obtained from GeneSys (Wroclaw, Poland). Ultrapure water was obtained using the Millipore system (Merck Millipore).PCR Reaction with BrdCTP
The double-stranded oligonucleotide labeled with BrdC was obtained in the PCR reaction. The resulting PCR products were 80 bp in length (see Fig. 1). The amplified DNA fragments were purified with the use of a PCR/DNA clean up purification kit and then with HPLC.UV irradiation
Photolysis was carried out in quartz capillaries (3 mm × 3 mm) filled with a DNA solution (200 ng μl−1, 4.54 × 10⁻⁶ M) containing Tris-HCl (pH ∼ 8.0) in a total volume of 50 μl with the use of a 500 W high-pressure mercury lamp. The 300 nm wavelength of incident light (half-width 2.5 nm) was selected using a grating monochromator (M250 Optel, Poland). The incident light intensity for the above irradiation setup was c. 41 W m−2. This value was determined with a Maestro11 laser power/energy meter, equipped with an 11PD photodetector (Standa, Lithuania).Denaturing PAGE
15% denaturing (7 M urea) polyacrylamide gels were prepared in 1× TBE buffer. Samples were incubated at 95 °C for 10 min before loading onto the gel. The gel was electrophoresed at 200 V for 2 hours. Then the gel was visualized after staining with Sybr Gold using a Fusion FX imaging system (Vilber Lourmat, Germany).Enzymatic digestion
0.2 U of nuclease P1 and 0.005 U of calf spleen phosphodiesterase were added to a solution containing 10 μg of photo-irradiated DNA, 300 mM sodium acetate (pH 5.0) and 10 mM zinc acetate. The digestion was carried out at 37 °C for 3 h. After the incubation, 40 U of DNase I, 10 mM CaCl2, 100 mM MgCl2, 100 mM tris-HCl (pH 8.9), 400 μM DTPA and water were added to the mixture. The digestion was continued at 37 °C for 1 h. Then, 1 U of bacterial alkaline phosphatase was added and the sample was incubated at 37 °C for an additional hour. In the final step of the protocol, 0.00004 U of snake venom phosphodiesterase was added and the incubation was prolonged for one more hour. Finally, the solution was chloroform-extracted to remove the enzymes. The aqueous layer was lyophilized and then resuspended in water for further analysis.Chromatography
The HPLC and DHPLC separation was performed on a Dionex UltiMate 3000 System with diode array detector, which was set at 260 nm for monitoring the effluents. An XBridge OST, reversed-phase C18 column (2.5 μm in particle size, 4.6 × 50 mm) was used. For the purification of PCR products, a 20 min gradient of 0–16% acetonitrile in 50 mM triethylamine acetate (pH 7) was employed, and the flow rate was 1 mL min−1. For the DHPLC separations, the conditions were as follows: a 20 min gradient from 8.4 to 9.2% acetonitrile in 100 mM triethylamine acetate (pH 7), a flow rate of 0.5 ml min−1 and a column temperature of 70 °C.Mass spectrometry
![[thin space (1/6-em)]](https://www.rsc.org/images/entities/char_2009.gif) :
:![[thin space (1/6-em)]](https://www.rsc.org/images/entities/char_2009.gif) 50, v/v). We separated 20 μl of irradiated sample using the following gradient conditions [time (min), % mobile phase B]: (0, 0) (20, 20) (50, 40) (65, 40) (70, 60). In the case of the non-irradiated sample, the linear gradient 0–60% of phase B in 40 min was used. The effluent was diverted to waste for 1 min after injection during each analysis. The column temperature was set at 80 °C. MS operation parameters were as follows: the spray voltage −4.5 kV, the nebulizer gas (N2) pressure 30 psi, the flow rate 11 L min−1 and the source temperature 300 °C.
50, v/v). We separated 20 μl of irradiated sample using the following gradient conditions [time (min), % mobile phase B]: (0, 0) (20, 20) (50, 40) (65, 40) (70, 60). In the case of the non-irradiated sample, the linear gradient 0–60% of phase B in 40 min was used. The effluent was diverted to waste for 1 min after injection during each analysis. The column temperature was set at 80 °C. MS operation parameters were as follows: the spray voltage −4.5 kV, the nebulizer gas (N2) pressure 30 psi, the flow rate 11 L min−1 and the source temperature 300 °C.
![[thin space (1/6-em)]](https://www.rsc.org/images/entities/char_2009.gif) :
:![[thin space (1/6-em)]](https://www.rsc.org/images/entities/char_2009.gif) 2
2![[thin space (1/6-em)]](https://www.rsc.org/images/entities/char_2009.gif) :
:![[thin space (1/6-em)]](https://www.rsc.org/images/entities/char_2009.gif) 10.3, v/v/v) was used. 20 μL of digested sample was injected in each run. The effluent was coupled to a Bruker Daltonics HCT Ultra Ion Trap MS with an electrospray (ESI) ion source, which was operated in negative-ion mode. The ion source parameters were set as follows: the source temperature of 360 °C, spray voltage of −4.0 kV, the drying gas (N2) pressure of 50 psi and the drying gas flow rate at 11 l min−1.
10.3, v/v/v) was used. 20 μL of digested sample was injected in each run. The effluent was coupled to a Bruker Daltonics HCT Ultra Ion Trap MS with an electrospray (ESI) ion source, which was operated in negative-ion mode. The ion source parameters were set as follows: the source temperature of 360 °C, spray voltage of −4.0 kV, the drying gas (N2) pressure of 50 psi and the drying gas flow rate at 11 l min−1.
3. Results and discussion
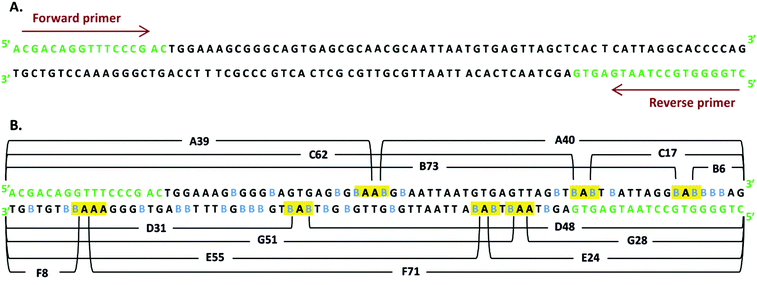
Photochemical studies on labeled DNA are frequently carried out with short oligonucleotides comprising a single molecule of the sensitizer.3 Such an approach enables the sequence dependency of the studied process to be comprehended. However, due to a significant number of possible sequences, even in short DNA, one has to study a multitude of systems in order to get a complete picture. Even more important is that in cellular environments, where DNA labeling proceeds in a statistical fashion (the chance for a modified nucleotide to be incorporated into a newly synthesized strand depends on the relative amount of its triphosphate in the overall pool of triphosphates), all possible sequences occur in the biosynthesized polymer. Therefore, to study a situation possibly close to that occurring in the cell, we decided to synthesize an oligonucleotide similar to that produced during DNA biosynthesis. Hence, we employed the PCR reaction in order to obtain a labeled DNA fragment in which all the 2′-deoxycytidines, besides those present in the primers, are substituted with BrdC. A similar approach to the labeled DNA synthesis was used in the past by us,16,21 as well as by other groups.22In comparison to our recent studies on the BrdU-labeled dsDNA fragment,16 and also in the current studies, we amplified the same part of the pUC19 plasmid by PCR (for the PCR protocol, see ESI†). This time, however, all dCTPs were substituted with BrdCTPs, rather than TTPs with BrdUTPs, as we did in ref. 16. In Fig. 1A, the amplified sequence, primers and the sites where BrdC have been incorporated are displayed. One can note that altogether, 34 2′-deoxycytidines were substituted with BrdC.
Assessment of the PCR Product by LC-MS Analysis
The outcome of the PCR reaction was confirmed by employing PAGE (see Fig. S1 in ESI†). The significant yield of the PCR product (see a distinctive band corresponding to the mass marker of 80 bases in lane 3 of Fig. S1†) demonstrates that Marathon DNA polymerase accepts the brominated analogue of dC triphosphate. The formation of the expected band in gel electrophoresis is a generally accepted confirmation of an efficient PCR reaction. One should note however, that such confirmation constitutes only an indirect proof for the accuracy of the actual PCR process. Due to the small resolution of the gel, all PCR products having the same length, but differing in sequence, bases identity, etc., form bands that move with more or less the same velocity in an electric field. In order to unequivocally demonstrate that the required PCR product was actually synthesized, we employed a powerful analytical tool, which is recently becoming a golden standard of DNA analysis, i.e. liquid chromatography coupled to high-resolution electro-spray mass spectrometry (LC-ESI-MS).23 In Fig. 2, several variants of the LC-MS spectra for the PCR product are presented. The synthesized oligonucleotide was separated using a mobile phase dedicated to MS analysis of oligonucleotides, i.e., containing TEA and HFIP (see Methods). As shown in Fig. 2A, where the total ion current is plotted against the time of separation, the particular DNA strands are quite well separated. On the other hand, the MS spectra obtained in the ESI-MS experiments are shown in Fig. 2C and D—the particular oligonucleotides form multiply ionized ions and the deconvoluted masses remain in very good accordance with the theoretical ones (cf.Fig. 2C and D with Table 1). Finally, the extracted ion chromatograms for m/z equal to 891.8 and 871.8, respectively, are displayed in Fig. 2B. All these results constitute a direct confirmation that the PCR process produced the expected double-stranded DNA fragment containing forward and reverse strands (see Fig. 1).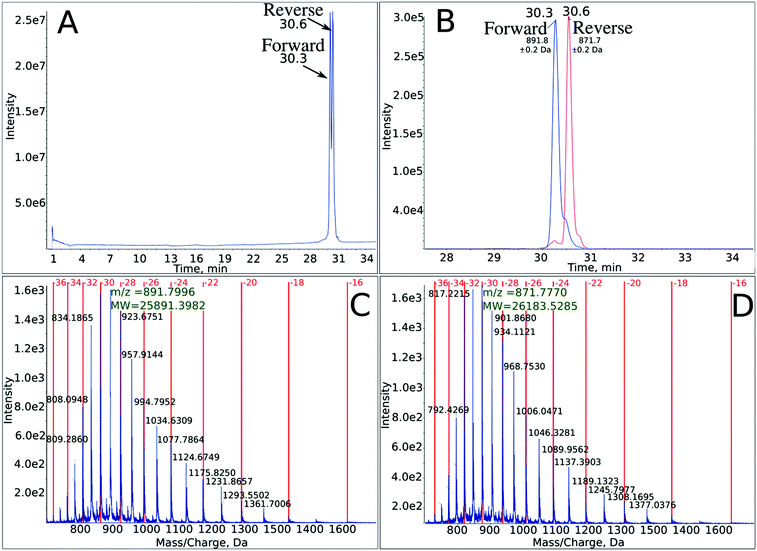 | ||
| Fig. 2 LC-MS analysis of the PCR product – completely labeled with BrdC 80-mer oligonucleotide, with the sequence depicted in Fig. 1. (A) Total ion current chromatogram showing two separated strands. (B) Extracted ion chromatograms for m/z equal to 891.8 and 871.8 (for these most intensive signals, the charge state of the analyzed oligonucleotides is equal to −32) for the forward and reverse strands, respectively. (C) and (D) Mass spectra showing multiply ionized ions and the deconvoluted masses corresponding to the forward and reverse strands, respectively. | ||
| Identities | Calculated mass [Da] | Measured mass [Da] |
|---|---|---|
| Forward strand | 25![[thin space (1/6-em)]](https://www.rsc.org/images/entities/char_2009.gif) 890.6 890.6 |
25![[thin space (1/6-em)]](https://www.rsc.org/images/entities/char_2009.gif) 891.4 891.4 |
| Reverse strand | 26![[thin space (1/6-em)]](https://www.rsc.org/images/entities/char_2009.gif) 183.1 183.1 |
26![[thin space (1/6-em)]](https://www.rsc.org/images/entities/char_2009.gif) 183.5 183.5 |
| A40 | 13![[thin space (1/6-em)]](https://www.rsc.org/images/entities/char_2009.gif) 109.0 109.0 |
13![[thin space (1/6-em)]](https://www.rsc.org/images/entities/char_2009.gif) 109.6 109.6 |
| B6 | 2053.9 | 2054.1 |
| C17 | 5668.8 | 5668.5 |
| D48 | 15![[thin space (1/6-em)]](https://www.rsc.org/images/entities/char_2009.gif) 580.1 580.1 |
15![[thin space (1/6-em)]](https://www.rsc.org/images/entities/char_2009.gif) 580.2 580.2 |
| E28 | 9041.4 | 9041.3 |
| F8 | 2614.3 | 2613.3 |
| G24 | 7587.8 | 7687.4 |
Thus, the above-described LC-MS identification of the PCR product complements gel electrophoresis and although not routinely used for DNA identification, delivers a difficult to overestimate approval for the accuracy of PCR synthesis.
UV irradiation
Fig. 3 compares the DHPLC chromatograms of non-irradiated (A) and irradiated samples (B, C). The elevated temperature of HPLC separation brings about the analyzed double-stranded oligonucleotide moving through the column in the form of its single stranded components, giving two well-separated signals at 10.7 and 14.1 min (see Fig. 3A). Even 3 min irradiation leads to a visible degradation of the UV-exposed oligonucleotides (cf.Fig. 3A with B). The substrate signals, at 10.7 and 14.1 min, gradually disappear and a number of products are formed, resulting in several broad peaks with retention times shorter than those of substrates. Employing the incident beam intensity of 41 W m−2, the actual absorbance of the sample at 300 nm, its degree of decay and the irradiated geometry, one can estimate the quantum yield of the overall process to be c. 2.5 × 10⁻³. This value was estimated for 1 min irradiation, i.e., in the time range when the substrate decays linearly with the total incident energy. Indeed, we found out that for our experimental set-up, substrate decay against irradiation, time runs in a linear regime within the first seven minutes (see Fig. S3†). Hence, changes in the absorbance due to a change in the system's constitution with the time of irradiation should not significantly perturb the quantum yield calculated for the first minute of exposure.
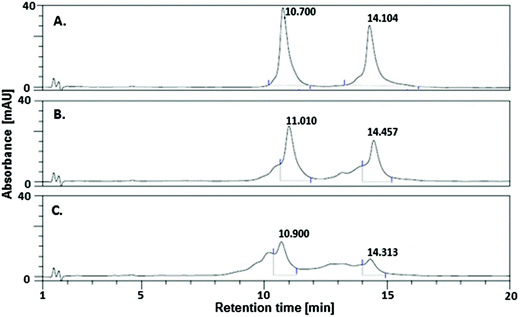 | ||
| Fig. 3 DHPLC chromatogram of (A) a non-irradiated DNA fragment labeled with 5-bromo-2′-deoxycytidine and irradiated for (B) 3 min (C) 10 min. | ||
It is worthy of emphasis that the quantum yield calculated for the same 80-mer sequence labeled with BrdU was as much as 8.4 × 10⁻³ (measured for 1 min irradiation, i.e., the exposure time for which the degree of degradation versus irradiation time displays almost perfect linearity),16 which is ca. 3-fold larger than that for DNA labeled with BrdC. This result clearly indicates that BrdC is a significantly weaker photosensitizer than BrdU.
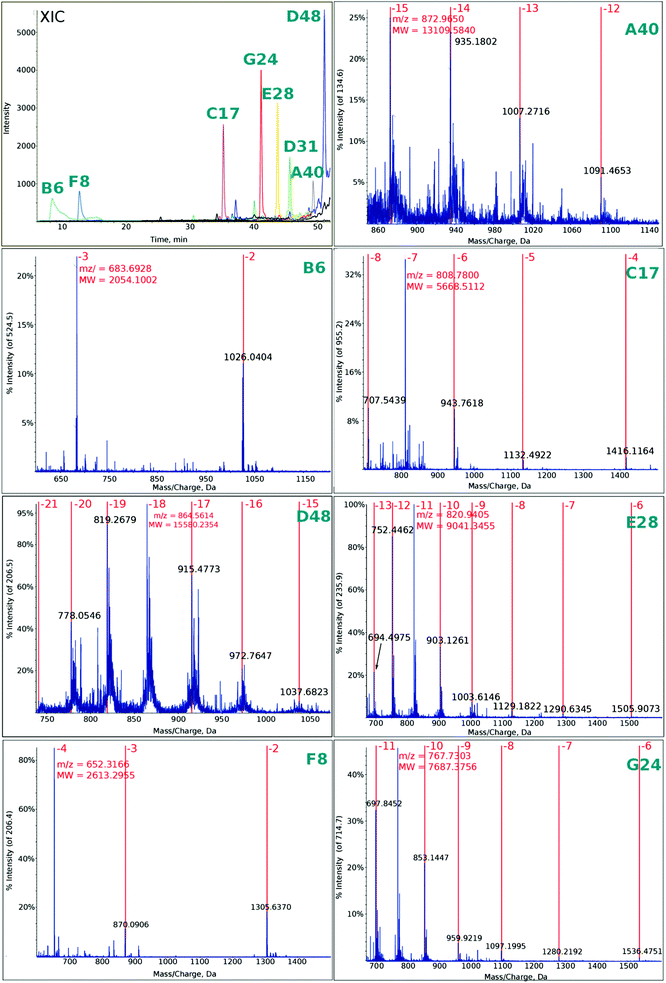 | ||
| Fig. 4 Extracted ion chromatogram (XIC) and mass spectra of multiply charged ions (for fragment symbols, see Fig. 1) observed in the photolyte obtained by irradiation for 15 min. | ||
In Fig. 4 the ESI-MS spectra for the fragments denoted as in Fig. 1 are presented. These spectra were recorded for the photolyte irradiated for 15 min. Note that we were able to observe all the fragments that should be formed from the “hot spot” sequences shown in Fig. 1 (note that the deconvoluted masses agree very well with the calculated ones, see Table 1).
Additionally, in Fig. S4† a chromatogram employing the total ion current is demonstrated. Comparing the irradiated and non-irradiated samples, one observes a tail in the range of retention times where the particular fragments occur in the ion-extracted chromatogram (see XIC in Fig. 4).
Although the above-described LC-MS analysis unequivocally reveals the formation of the assumed DNA fragments, confirming that the photoinduced long range electron transfer is also operative in the double-stranded oligonucleotide labeled with BrdC, we decided to further corroborate these results by using denaturing PAGE. First, all the assumed fragments were synthesized chemically. Then, denaturing electrophoresis was carried out for a sample irradiated for 60 min. In Fig. 5, the picture of the denaturing gel compares irradiated (lanes 3 and 5) and non-irradiated (lanes 2 and 4) samples to the mass standard, based on synthetic oligonucleotides (lane 1). For the irradiated, labeled sample, one can notice a series of bands that correspond pretty well to those originating from the synthetic oligonucleotides (cf. lane 3 to lane 1). These findings again confirm that the assumed photoinduced long-range ET does occur in the irradiated sample labeled with BrdC oligonucleotide, and leads to SSBs.
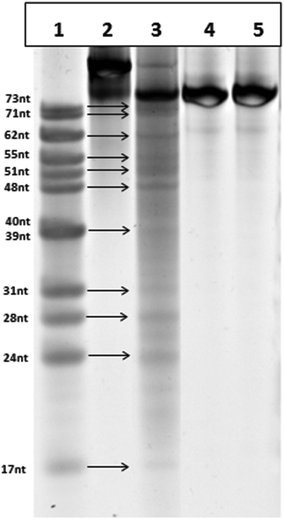 | ||
| Fig. 5 15% denaturing PAGE in 1× TBE buffer. Lane 1: Mass standard—an equimolar mixture of oligonucleotides that can occur if photoinduced single strand breaks concern the “hot spots” presented in Fig. 1 (for fragment labels see Fig. 1). Lane 2: Non-irradiated BrdC-labeled PCR fragment. Lane 3: BrdC-labeled PCR fragment irradiated for 60 minutes. Lane 4: Non-irradiated and non-labeled (not containing BrdC) PCR fragment. Lane 5: Non-labeled (not containing BrdC) PCR fragment irradiated for 60 minutes. | ||
Yet another argument for the occurrence of the photoinduced ET process comes from the following reasoning. Strand breaks may occur in our system as a result of two mechanisms: (i) homolytic photodissociation of the C–Br bond in the excited BrdC or (ii) electron transfer to the excited halogenated nucleobase from a distant guanine. In both mechanisms, a reactive cytidine radical is formed that stabilizes, forming a strand break. It is easy to differentiate between these two mechanisms, since they lead to different products. In mechanism (i) the strand break is formed via the β-elimination of the phosphate group, which leads to two fragments – one with the 5′-phosphatae and another one without phosphate.25 The sum length of these two fragments is equal to the length of the non-damaged PCR product, in our case, 80 bases. On the other hand, for mechanism (ii), ET goes via the formation of 2′-deoxyribonolactone, followed by the elimination of adenine. Ultimately, the thermal degradation of 2′-deoxyribonolactone leads to two fragments, one with 5′-phosphate and another one with 3′-phospahte.26 The sum length of these two fragments is one base smaller than that of the original PCR product, and both fragments resulting from a strand break, contain ending phosphates. Since the sum length of pairs of fragments, A39/A40, B73/B6, C17/C62 etc., is one smaller than that of the PCR product, and both fragments end with a phosphate, one can conclude that the strand breaks observed in our system result from the long-range ET between a distant guanine and the photoexcited BrdC.
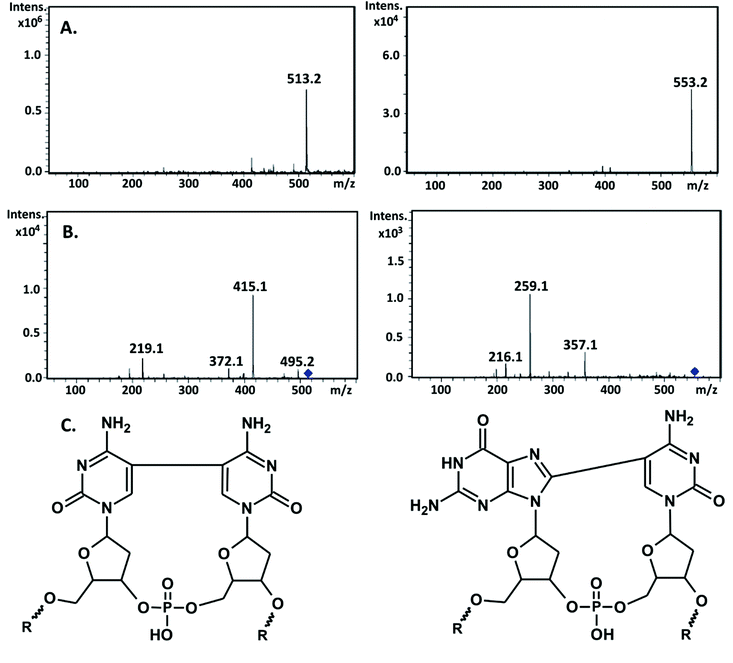
Therefore, one can expect ICL formation also in the studied DNA fragment because besides sequences leading to SSB, several sites are present where ET is forbidden and BrdC is adjacent to a purine or pyrimidine. Since ICLs introduce a relatively small modification to the total mass of a native oligonucleotide, they are formed by the release of two hydrogen atoms (a covalent bond is then formed between the appropriate ring atoms of neighboring nucleobases); the most effective way to enable investigations of such damage is to digest the irradiated oligonucleotide and employ the LC-MS analysis against the lysate afterwards. The cross-links are not processed by the enzymes and they are “cut out” from the oligonucleotide in the form of respective dimers, which can be relatively easily separated in an HPLC run from the ordinary nucleosides and then assayed by the MS analysis. In Fig. 6, the respective chromatogram obtained for the photolyte digested by the appropriate cocktail of enzymes along with the extracted ion chromatograms registered for ions of m/z equal to 553.2 and 513.2, respectively, are displayed. The first m/z ratio corresponds to the d(G^C) dimer, while the second one corresponds to the d(C^C) adduct (for the ICLs structures see Fig. 7C). The HPLC signals of the identified dimers overlap with the dC and dG peaks, as indicated by the respective XIC chromatograms (cf.Fig. 6A–C); therefore, their presence is not evident from the analysis of the chromatogram shown in Fig. 6A. In order to confirm the identity of the measured masses, we additionally registered their MS/MS spectra.
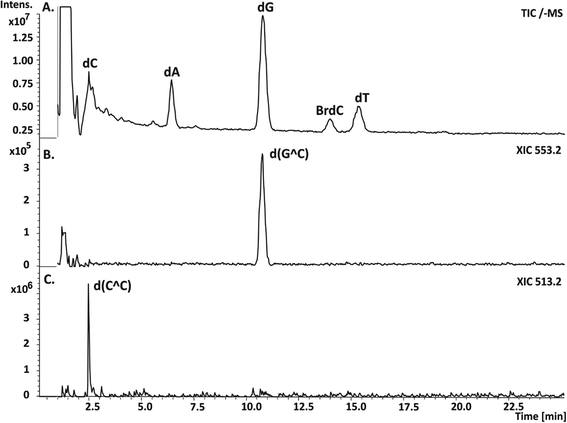 | ||
| Fig. 6 LC-MS analysis of the DNA fragment (for the sequence, see Fig. 1) labeled with BrdC and irradiated for 60 min, after enzymatic digestion. (A) Chromatogram showing the total ion current (TIC) for the digested photolyte. (B) and (C) Extracted ion chromatograms registered for ions of m/z equal to 553.2 and 513.2, corresponding to d(G^C) and d(C^C) cross-links, respectively. | ||
In Fig. 7, the fragmentation spectra for both m/z, 553.2 and 513.2, are demonstrated and Table 2 shows the possible origin of particular fragments. The fragmentation of the m/z 553.2 and 513.2 ions leads to the formation of fragments with m/z equal to 357.1, 259.1, 216.1, and 495.2, 415.2, 372.1, and 219.1 (see Fig. 7b). The fragment ion of m/z 495.2 can be attributed to the loss of a H2O molecule from m/z 513.2. The m/z 357.1 ion is due to the concomitant loss of a C5H6O2 moiety (the 2′-deoxyribose component) and the phosphate group from m/z 553.2, while the ions of m/z 259.1 and 216.1 are related to the d(G^C) dimer of the nucleobase and the loss of the HNCO fragment from this dimer, respectively (see Table 2). On the other hand m/z, 415.1 and 372.1 correspond to the elimination of C5H6O2, and C5H6O2, together with H3PO4 components, respectively, from m/z 513.2, while the m/z 219.1 ion is consistent with the mass of two covalently bonded molecules of cytosine d(C^C) (see Table 2).
| m/z | Ion identities |
|---|---|
| d(C^C) | |
| 513.2 | [M − H]− |
| 495.2 | -H2O |
| 415.1 | -2′-Deoxyribose |
| 372.1 | -2′-Deoxyribose, -HNCO |
| 219.1 | [Nucleobases − H]− |
| d(G^C) | |
| 553.2 | [M − H]− |
| 357.1 | -2′-Deoxyribose, -phosphate |
| 259.1 | [Nucleobases − H]− |
| 216.1 | [Nucleobases − H]−, -HNCO |
Although the above-described MS analysis does not allow the particular isomers of the analyzed dimers to be identified, we are not able to differentiate dG[8-5]C from dC[5-8]G; in Fig. 7C, we assumed that the dG[8-5]C dimer, rather than dC[5-8]G, is formed under our experimental conditions. Analyzing the sequence shown in Fig. 1, one can note that the sites where BrdC is surrounded by two G, prevail over other configurations, leading to ICL. Moreover, the literature reports suggest that the 5′-GBrC configuration is several times more reactive than the 5′-BrdCG.9 Here, it is also worth mentioning that different mechanisms are probably responsible for the formation of pyrimidine and purine dimers. Photochemical studies on DNA containing BrdC surrounded by two purines suggest electron transfer as being responsible for the ICL formation. An analogous study of sequences containing BrdU neighbored by pyrimidines at both sides indicates that the formation of the d(U^U) dimer proceeds through a cyclobutapyrimidine intermediate.34 This is probably the mechanism that also governs the formation of the d(C^C) ICL detected in the current work. Taking into account the fact that the 5′-d(BrUU) sequence is more susceptible to photoirradiation than the 5′-d(UBrU) configuration, a similar directional preference can be expected for the formation of cytidine dimers studied in the present work.
Our attempts to identify, possibly at first glance, other ICLs like the various d(C^A) dimers failed, which suggests that their quantum yield, if not zero, is so small that the amount of the produced damage falls below the limit of LC-MS detection. It is worth noting that the formation of the d(G^C) dimers is almost 20-fold more probable than the formation of the d(A^C).9
4. Conclusions
Using PCR, we synthesized 80 bp DNA fragments in which all cytidines but those present in primers were substituted with their brominated analogue, 5-bromo-2′-deoxycytidine. We demonstrated that the BrdC-labeled DNA is photoreactive, although its propensity for photoinduced damage is smaller than that for BrdU-labeled double-stranded oligonucleotides. Generally, two types of DNA damage were discovered in the UV-irradiated BrdC sensitized DNA: single strand breaks and intrastrand cross-links. Using the LC-MS method and denaturing PAGE, we showed the existence of seven “hot spots”, sensitive to the photoinduced long range ET in the studied duplex. On the other hand, ICLs, d(C^C) and d(G^C), are formed if a BrdC molecule neighbors with another BrdC or dG nucleoside.Both SSBs and ICLs pose serious damage to the DNA molecule, which, if not repaired, may lead to cell death. Therefore, due to the above-described properties, BrdC could be considered as an efficient photosensitizer of DNA damage, thus having potential clinical applications.
Acknowledgements
This work was supported by the Polish National Science Center (NCN) under Grant No. 2012/05/B/ST5/00368 (J. R.) and by Foundation for Polish Science (M. Z.).References
- S. Greer and S. Zamenhof, presented at 131st National Meeting of the American Chemical Society, Miami Beach, FL, 1957.
- S. Greer, J. Gen. Microbiol., 1960, 22, 618–634 CrossRef CAS PubMed.
- J. Rak, L. Chomicz, J. Wiczk, K. Westphal, M. Zdrowowicz, P. Wityk and Ł. Golon, J. Phys. Chem. B, 2015, 119, 8227–8238 CrossRef CAS PubMed.
- T. Watanabe, R. Tashiro and H. Sugiyama, J. Am. Chem. Soc., 2007, 129, 8163–8168 CrossRef CAS PubMed.
- X. Li, L. Sanche and M. D. Sevilla, J. Phys. Chem. A, 2002, 106, 11248–11253 CrossRef CAS.
- L. Chomicz, J. Rak and P. Storoniak, J. Phys. Chem. B, 2012, 116, 5612–5619 CrossRef CAS PubMed.
- M. Wieczór, P. Wityk, J. Czub, L. Chomicz and J. Rak, Chem. Phys. Lett., 2014, 595–596, 133–137 CrossRef.
- H. Sugiyama, K. Fujimoto, I. Saito, E. Kawashima, T. Sekine and Y. Ishido, Tetrahedron Lett., 1996, 37, 1805–1808 CrossRef CAS.
- Y. Zeng and Y. Wang, Nucleic Acids Res., 2006, 34, 6521–6529 CrossRef CAS PubMed.
- Y. Zeng and Y. Wang, J. Am. Chem. Soc., 2004, 126, 6552–6553 CrossRef CAS PubMed.
- H. Hong and Y. Wang, J. Am. Chem. Soc., 2005, 127, 13969–13977 CrossRef CAS PubMed.
- A. Manetto, S. Breeger, C. Chatgilialoglu and T. Carell, Angew. Chem., Int. Ed., 2006, 45, 318–321 CrossRef CAS PubMed.
- D. Fazio, C. Trindler, K. Heil, C. Chatgilialoglu and T. Carell, Chem. – Eur. J., 2011, 17, 206–212 CrossRef CAS PubMed.
- P. Agostinis, K. Berg, K. A. Cengel, T. H. Foster, A. W. Girotti, S. O. Gollnick, S. M. Hahn, M. R. Hamblin, A. Juzeniene, D. Kessel, M. Korbelik, J. Moan, P. Mroz, D. Nowis, H. Piette, B. C. Wilson and J. Golab, CA-Cancer J. Clin., 2011, 61, 250–281 CrossRef PubMed.
- R. G. Boyle and S. Travers, Med. Chem., 2006, 6, 281–286 CAS.
- M. Zdrowowicz, B. Michalska, A. Zylicz-Stachula and J. Rak, J. Phys. Chem. B, 2014, 118, 5009–5016 CrossRef CAS PubMed.
- D. Frankenberg, M. Frankenberg-Schwager, D. Blocher and R. Harbich, Radiat. Res., 1981, 88, 524–532 CrossRef CAS PubMed.
- M. Joiner and A. van der Kogel, Basic Clinical Radiobiology, Hodder Arnold, London, UK, 2009, pp. 24 Search PubMed.
- H. Zheng, X. Wang, A. J. Warren, R. J. Legerski, R. S. Nairn, J. W. Hamilton and L. Li, Mol. Cell. Biol., 2003, 23, 754–761 CrossRef CAS PubMed.
- P. Agostinis, K. Berg, K. A. Cengel, T. H. Foster, A. W. Girotti, S. O. Gollnick, S. M. Hahn, M. R. Hamblin, A. Juzeniene, D. Kessel, M. Korbelik, J. Moan, P. Mroz, D. Nowis, H. Piette, B. C. Wilson and J. Golab, CA-Cancer J. Clin., 2011, 61, 250–281 CrossRef PubMed.
- B. Michalska, I. Sobolewski, K. Polska, J. Zielonka, A. Żylicz-Stachula, P. Skowron and J. Rak, J. Pharm. Biomed. Anal., 2011, 56, 671–677 CrossRef CAS PubMed.
- T. Watanabe, T. Bando, Y. Xu, R. Tashiro and H. Sugiyama, J. Am. Chem. Soc., 2005, 127, 44–45 CrossRef CAS PubMed.
- N. Tretyakova, P. W. Villalta and S. Kotapati, Chem. Rev., 2013, 113, 2395–2436 CrossRef CAS PubMed.
- E. Pluharova, P. Jungwirth, S. E. Bradforth and P. Slavícek, J. Phys. Chem. B, 2011, 115, 1294–1305 CrossRef CAS PubMed.
- C. von Sonntag, Free-Radical-Induced DNA Damage and Its Repair, Springer-Verlag, Heidelberg, Germany, 2006 Search PubMed.
- J. Wiczk, J. Miloch and J. Rak, J. Phys. Chem. Lett., 2013, 4, 4014–4018 CrossRef CAS.
- P. Fortini and E. Gogliotti, DNA Repair, 2007, 6, 398–409 CrossRef CAS PubMed.
- M. Joiner and A. van der Kogel, Basic Clinical Radiobiology, Hodder Arnold, London, UK, 2009, pp. 24 Search PubMed.
- D. Frankenberg, M. Frankenberg-Schwager, D. Blocher and R. Harbich, Radiat. Res., 1981, 88, 524–532 CrossRef CAS PubMed.
- C. Gu, Q. Zhang, Z. Yang, Y. Wang, Y. Zou and Y. Wang, Biochemistry, 2006, 45, 10739–10746 CrossRef CAS PubMed.
- Y. Jiang, H. Hong and Y. Wang, Biochemistry, 2007, 46, 12757–12763 CrossRef CAS PubMed.
- S. Bellon, D. Gasparutto, C. Saint-Pierre and J. Cadet, Org. Biomol. Chem., 2006, 4, 3831–3837 CAS.
- L. C. Colis, P. Raychaudhury and A. K. Basu, Biochemistry, 2008, 47, 8070–8079 CrossRef CAS PubMed.
- J. Lepczyńska, K. Komodziński, J. Milecki, R. Kierzek, Z. Gdaniec, S. Franzen and B. Skalski, J. Org. Chem., 2012, 77, 11362–11367 CrossRef PubMed.
Footnote |
| † Electronic supplementary information (ESI) available: (i) PCR protocol (ii) Fig. S1 – native PAGE, (iii) Fig. S2 – comparison of UV spectra for BrdC and native DNA, (iv) Fig. S3 – degree of damage vs. irradiation time and (v) Fig. S4 – chromatogram employing the total ion current observed in the irradiated photolyte. See DOI: 10.1039/c6ob01446a |
| This journal is © The Royal Society of Chemistry 2016 |

