 Open Access Article
Creative Commons Attribution 3.0 Unported Licence
STD NMR and molecular modelling insights into interaction of novel mannose-based ligands with DC-SIGN†
Anita
Kotar
a,
Tihomir
Tomašič
b,
Martina
Lenarčič Živković
a,
Gregor
Jug
b,
Janez
Plavec
*acd and
Marko
Anderluh
*b
aSlovenian NMR center, National Institute of Chemistry, Hajdrihova 19, 1000 Ljubljana, Slovenia. E-mail: janez.plavec@ki.si; Fax: +38614760300
bFaculty of Pharmacy, University of Ljubljana, Aškerčeva 7, 1000 Ljubljana, Slovenia. E-mail: marko.anderluh@ffa.uni-lj.si; Fax: +38614258031
cEN-FIST Centre of Excellence, Trg OF 13, 1000 Ljubljana, Slovenia
dFaculty of Chemistry and Chemical Technology, University of Ljubljana, Večna pot 113, 1000 Ljubljana, Slovenia
First published on 27th October 2015
Abstract
Study of interaction of mannose-based ligands with receptor DC-SIGN using high resolution NMR in combination with molecular modelling showed that four α-D-mannoside ligands interact with the binding site predominantly through the mannose moiety. The other two aromatic groups that are bound to α-D-mannose through a glycerol linker demonstrate interaction that can be related to their substitution pattern. Ligand with naphthyl and meta-substituted phenyl ring exhibited the most favourable binding characteristics. In addition to the predicted hydrophobic interactions of aromatic moieties our results propose new contacts of substituted phenyl moiety in the more polar area of the flat binding site of DC-SIGN and thus offer new possibilities in further designing of novel, more potent DC-SIGN antagonists.
Introduction
Although significant progress has been made in HIV vaccine strategies and drugs development, HIV infections remain one of the leading causes of morbidity and mortality worldwide.1–5 Dendritic cells (DCs), host professional antigen-presenting cells that represent the first line of the innate immune system, play an important role in HIV-1 infection.6 The pattern recognition receptors (PRRs) located at the surface of DCs are an important factor in HIV-1 transmission that help subvert DC functions and escape immune surveillance.4,7 One of these PRRs that plays a fundamental role in cellular immunity is DC-SIGN (Dendritic Cell-Specific Intercellular adhesion molecule-3-Grabbing Non-integrin), a type II transmembrane C-type lectin located specifically on DCs.8–10 DC-SIGN acts as an adhesion molecule and binds highly glycosylated proteins present on the surface of several pathogens, including mannose glycans of the envelope protein gp120 of HIV-1.11–13 On binding, the complex of DC-SIGN and HIV-1 is promptly internalized, degraded into smaller fragments in early endosomes and conjugated with MHC class-II proteins to initiate a humoral immune response from T cells, but unfortunately, a small amount of virus succeeds to escape the normal lytic pathway in DCs’ endosomes and avoid the host immune system.6,8,11,13,14 By inhibiting interaction between DC-SIGN and HIV-1 with DC-SIGN antagonists pathogen entry could be prevented causing an impediment of the infection of immune defence cells.8,15–23Different approaches were applied to design medicinally useful DC-SIGN antagonists. Even though reported antagonists vary in structure and properties, they mostly exploit the fact that DC-SIGN recognises various mannose- and fucose-containing glycans exposed on the surface of several viruses, bacteria, yeast and parasites.4,8,11,23D-Mannose (Ki = 13.1 mM) and L-fucose (Ki = 6.7 mM) alone bind to DC-SIGN with very weak affinities, but when incorporated into suitable glycoconjugates substantially higher affinities can be obtained that offer a promise to prevent HIV-1 transmission.8,12,23,24 We recently reported a small focused library of branched mannose-based DC-SIGN antagonists bearing diaryl substituted 1,3-diaminopropanol or glycerol moieties incorporated to target the hydrophobic groove of the receptor.23 The D-Mannose entity was presumed to serve as an anchor for interaction with the Ca2+ binding site of the DC-SIGN carbohydrate recognition domain (CRD). The designed molecules were evaluated by in vitro assay of the isolated DC-SIGN extracellular domain for their ability to compete with HIV-1 gp120 for binding to the DC-SIGN CRD. The two most potent compounds were found to inhibit the interactions between gp120 and DC-SIGN with the IC50 values of 40 μM and 50 μM, and were among the most potent monovalent DC-SIGN antagonists reported. Furthermore, the antagonistic effect of these compounds was evaluated by a one-point in vitro assay that measures dendritic cell adhesion to a mannan-coated surface. Again, the same compounds acted as functional antagonists of DC-SIGN-mediated DC adhesion. The binding mode of the most potent compound (4) was also studied by molecular docking and molecular dynamics simulation, which suggested that the diarylglycerol part of the molecule likely binds into the targeted hydrophobic binding site, and provides a basis for further optimization.23 Unfortunately, the binding site of DC-SIGN is rather flat and vaguely defined and offers limited (other than van der Waals) ligand–receptor contacts.
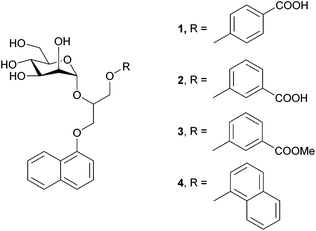
In the present study we investigated the interactions between four monovalent mannose-based ligands 1–4 (Fig. 1) and extracellular domain of DC-SIGN (hereinafter referred as DC-SIGN). The studied ligands 1–4 consist of α-D-mannose connected by glycerol linker to different aryl moieties, which are expected to tune interactions of ligands in the hydrophobic groove of the receptor. A combination of saturation transfer difference (STD) NMR spectroscopy and molecular modelling was used to examine binding propensity of monovalent glycoconjugates for DC-SIGN at the atomic level of resolution. As expected, ligands 1–4 do not exhibit clear differences in chair conformation of D-mannose sugar moiety regardless of variation of groups attached to its anomeric carbon. On the other hand, differences in ligands’ binding affinities can be correlated with the position of carboxylic group on the phenyl moiety in 1–3 as well as lipophilicity of each of the ligands. The binding mode of the ligands was additionally evaluated by molecular dynamic simulations. A good agreement between NMR and molecular modelling results provides new insights into interactions of our novel ligands with DC-SIGN and suggests new possibilities in design of novel anti-HIV therapeutics.
Results
Chemistry
DC-SIGN antagonists 1 and 4 were synthesized as reported,23,25 while synthesis of 2 and 3 is outlined in Scheme 1. 3-Hydroxybenzoic acid (5) was first converted to its methyl ester 6 in methanol under acidic conditions. Potassium salt of compound 6, which was prepared using potassium hydroxide in methanol, was used for epoxide ring opening of 7 to obtain racemic diarylglycerol 8. Mannosylation of 8 with 2,3,4,6-tetra-O-acetyl-α-D-mannopyranosyl trichloroacetimidate23 and with trimethylsilyl trifluoromethanesulfonate (TMSOTf) as promoter yielded α-D-mannoside 9 stereospecifically. Since 8 was used as a racemate, 9 was obtained as a mixture of two diastereomers that could not be separated using flash column chromatography. Deprotection of 9 using the Zemplén method gave final compound 3, which was further hydrolysed under alkaline conditions to yield the final compound 2.STD NMR experiments and epitope mapping
The STD NMR experiments were performed to explore the binding nature and propensity of ligands 1–4 to interact with DC-SIGN. Reference and STD spectra exhibited narrow and well resolved lines (Fig. 2). Significant STD effects observed for ligands 1–4 unequivocally demonstrated their binding to the DC-SIGN. In order to increase accuracy of epitope mapping we used only well resolved and isolated NMR resonances of the individual ligand, avoiding uncertain contributions in the case of signal overlap. Quantitative analyses of the STD spectra were done at receptor-to-ligand ratio of 1![[thin space (1/6-em)]](https://www.rsc.org/images/entities/char_2009.gif) :
:![[thin space (1/6-em)]](https://www.rsc.org/images/entities/char_2009.gif) 50. Rather high ratio was used to reduce the effect of cross-rebinding, where a previously saturated ligand re-enters a binding pocket.
50. Rather high ratio was used to reduce the effect of cross-rebinding, where a previously saturated ligand re-enters a binding pocket.
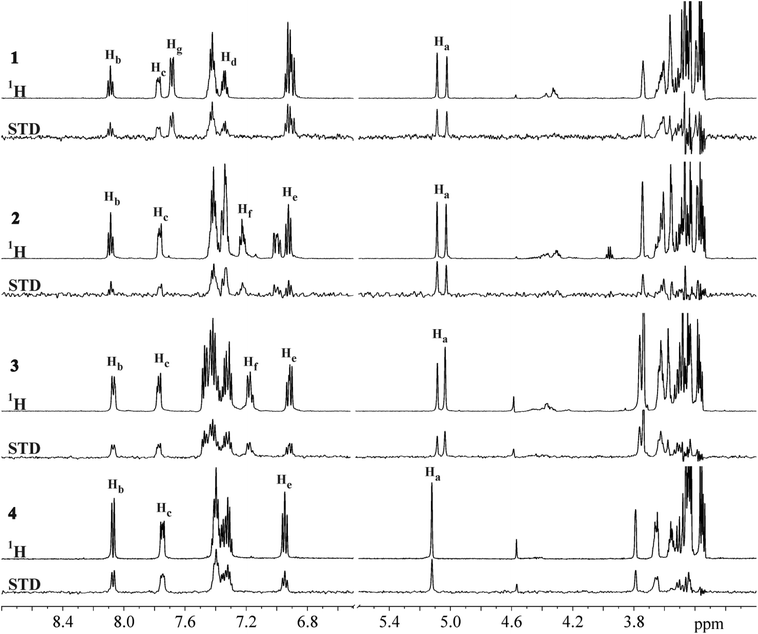 | ||
Fig. 2
1H and STD NMR spectra of 1–4 in the presence of DC-SIGN. NMR spectra were recorded at 25 °C, 2.0 s saturation time, 400 μM concentration of ligand and 1![[thin space (1/6-em)]](https://www.rsc.org/images/entities/char_2009.gif) : :![[thin space (1/6-em)]](https://www.rsc.org/images/entities/char_2009.gif) 50 receptor-to-ligand ratio in 25 mM Tris-d11 (pD = 8.0), 150 mM NaCl, 4 mM CaCl2 in 2H2O and 25% DMSO-d6 at 600 MHz. Resolved signals are labelled according to atom numbering shown in Fig. 3. 50 receptor-to-ligand ratio in 25 mM Tris-d11 (pD = 8.0), 150 mM NaCl, 4 mM CaCl2 in 2H2O and 25% DMSO-d6 at 600 MHz. Resolved signals are labelled according to atom numbering shown in Fig. 3. | ||
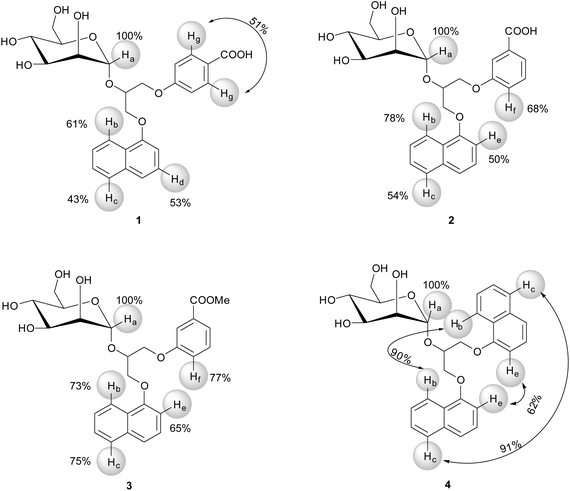
For 1–4 the most intense STD signals were observed between δ 3.3 and 3.9 ppm, which suggested that the mannose moiety was closest in contact with the surface of DC-SIGN. However, quantitative interpretation of STD effects of sugar protons was hampered due to spectral overlap with the exception of anomeric Ha proton. Ha proton exhibited well-resolved signals for all four ligands 1–4. Moreover, it showed the highest relative STD effect among protons that were analysed in epitope mapping. Consequently, the signal of Ha proton was set as a reference with 100% STD effect. Intensities of other signals were expressed relative to the Ha signal (Fig. 3).
The aromatic groups exhibited weaker STD effects in comparison to the mannose moiety regardless of variations in the attached aryl entities. Both phenyl Hg protons of 1 together showed STD effect of 51%. However, in the STD spectra one cannot distinguish between individual contributions of two Hg atoms due to their symmetric arrangement at meta-position of phenyl group. Hb, Hc and Hd protons of naphthyl group of 1 exhibited STD effects of 61%, 43% and 53%, respectively. Obvious STD effects were seen for other aromatic protons as well. Unfortunately their quantitative elucidation was prevented due to spectral overlap. In 2 the phenyl Hf proton showed STD effect of 68% and Hb, Hc and He protons from the naphthyl moiety exhibited the STD effects of 78%, 54% and 50%, respectively. However, direct comparison of ligands has to be done with certain degree of caution because of monitoring of protons on different positions on aromatic groups of ligands, namely Hd in 1 and He in 2–4 on naphthyl ring, and Hg in 1 and Hf in 2–4 on phenyl moiety. In 3 Hb and Hc protons from naphthyl and Hf from phenyl group showed similar STD effects ranging from 73% to 77%. He proton in 3 exhibited STD effects of 65%. Experimentally observed STD effects for Hb and Hc protons on both naphthyl rings in 4 were 90% and 91%, respectively. STD effects of He protons were markedly weaker (62%). However, one should keep in mind that Hb, Hc and He protons in 4 could not be resolved due to symmetry of the ligand. Observed STD effects therefore represented the overall contribution to the binding for both protons.
STD build-up studies
To precisely map ligand epitopes in close contact with the receptor we acquired STD build-up curves for 1–4 by collecting STD spectra at twelve different saturation times ranging from 0.1 to 5.0 s at receptor-to-ligand ratio of 1![[thin space (1/6-em)]](https://www.rsc.org/images/entities/char_2009.gif) :
:![[thin space (1/6-em)]](https://www.rsc.org/images/entities/char_2009.gif) 50. The maximal STD intensities, STDmax, and the saturation rate constants, ksat, were obtained by fitting experimental data to eqn (2). Experimental data as well as best-fit curves for 1 are shown in Fig. 4, whereas the corresponding figures for 2–4 can be found in the ESI (Fig. S2–S4†). The agreement between the experimental data and the fitted model was good with typically χ2 values below 0.1. A clear build-up of the STD effects with increasing saturation time can be observed, reflecting the amplification of the STD (Fig. 4 and S4–S6†).
50. The maximal STD intensities, STDmax, and the saturation rate constants, ksat, were obtained by fitting experimental data to eqn (2). Experimental data as well as best-fit curves for 1 are shown in Fig. 4, whereas the corresponding figures for 2–4 can be found in the ESI (Fig. S2–S4†). The agreement between the experimental data and the fitted model was good with typically χ2 values below 0.1. A clear build-up of the STD effects with increasing saturation time can be observed, reflecting the amplification of the STD (Fig. 4 and S4–S6†).
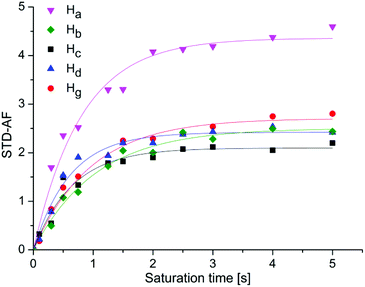 | ||
| Fig. 4 STD-amplification factor of 1 as a function of saturation time. Experimental data were fitted to a rising exponential eqn (2), to obtain the STDmax and ksat. Ha: STDmax = 4.46 ± 0.1, ksat = 1.1 ± 0.1 s−1, R2 = 0.973; Hb: STDmax = 2.50 ± 0.07, ksat = 0.96 ± 0.08 s−1, R2 = 0.983, Hc: STDmax = 2.06 ± 0.07, ksat = 1.5 ± 0.2 s−1, R2 = 0.961; Hd: STDmax = 2.49 ± 0.06, ksat = 1.5 ± 0.2 s−1, R2 = 0.982; Hg: STDmax = 2.66 ± 0.08, ksat = 1.1 ± 0.1 s−1, R2 = 0.978). Symbols represent data, whereas solids lines are the mathematical least-square fits. | ||
At longer saturation times flattening of the build-up curves can be observed, because of the relaxation rate of saturated ligand in the free state. For 1 the most prominent STDmax belonged to the Ha proton (4.46), while the corresponding values for aromatic Hb, Hc, Hd and Hg protons were markedly lower (2.50, 2.06, 2.49 and 2.66, respectively). Accordingly, Ha proton should be the one most directly involved in binding and closer to the receptor, followed by aromatic protons that are approximately equidistant from the protein surface. Different ksat values spanning from 0.96 to 1.54 s−1 were calculated for protons of 1. In the case of 2 the STDmax values of Ha, Hb, Hc, He, Hf protons were 3.71, 1.30, 1.87, 1.48 and 1.61, respectively. It is interesting that ksat values among protons of 2 did not vary remarkably and were all around 1.30 s−1. For 3 the highest STDmax of 3.44 was obtained for Ha proton. Significantly lower values were acquired for aromatic protons, Hb (2.01), Hc (1.58), He (1.08) and Hf (1.77). Great differences in ksat from 1.19 to 2.45 s−1 were determined among protons of 3. Similarly, protons of 4 exhibited ksat values ranging between 1.59 and 2.44 s−1. The STDmax values of 4 were 3.41 for Ha proton and 1.53, 1.69 and 1.30 for naphthyl Hb, Hc and He protons, respectively. Once again, results inferred that the Ha proton was in close contact with the protein and that the mannose moiety contributed primarily to the binding process. Furthermore, initial build-up rates were analysed as well. Initial slopes of the curves at zero saturation time were derived by multiplication of STDmax and ksat and correspond to the STD effects (STD0) in the absence of influence of T1 longitudinal relaxation time bias and rebinding effects. We calculated STD0 for Ha–Hg protons and compared these results with the STD intensities at 2.0 s saturation time (STD2s) from epitope mapping. For ease of comparison, the values were normalized with respect to Ha as a 100 (Table 1).
| 1 | 2 | 3 | 4 | ||
|---|---|---|---|---|---|
| a Normalized intensities for Hb–Hg protons at 2.0 s saturation time with respect to STD of Ha which was arbitrarily given a value of 100. b Not determined because of peak overlap. c Ligand does not contain this proton. | |||||
| STD2s | Hb | 61 | 78 | 73 | 90 |
| Hc | 43 | 54 | 75 | 91 | |
| Hd | 53 | nd | nd | nd | |
| He | ndb | 50 | 65 | 62 | |
| Hf | nd | 68 | 77 | —c | |
| Hg | 51 | nd | nd | — | |
| STD0 | Hb | 49 | 46 | 59 | 42 |
| Hc | 62 | 48 | 53 | 38 | |
| Hd | 73 | nd | nd | nd | |
| He | nd | 45 | 65 | 45 | |
| Hf | nd | 49 | 58 | — | |
| Hg | 46 | nd | nd | — | |
The STD0 values were lower than STD2s effects. The two exceptions were Hc and Hd protons of 1, which exhibited markedly higher STD0 values. STD2s and STD0 values for Hg of 1 were comparable. The same observations were noticed also for Hc and He protons of ligand 2. On the contrary, Hb and Hf protons of 2 showed significant differences in STD effects. For ligand 3, identical STD2s and STD0 values were observed for He proton. On the other hand, significantly lower STD0 effects were detected for Hb, Hc and Hf protons in comparison to STD2s values. Surprisingly, the lowest STD0 values and the greatest variances among STD effects were observed for protons of 4.
Characterisation and comparison of binding conformations of 1–4
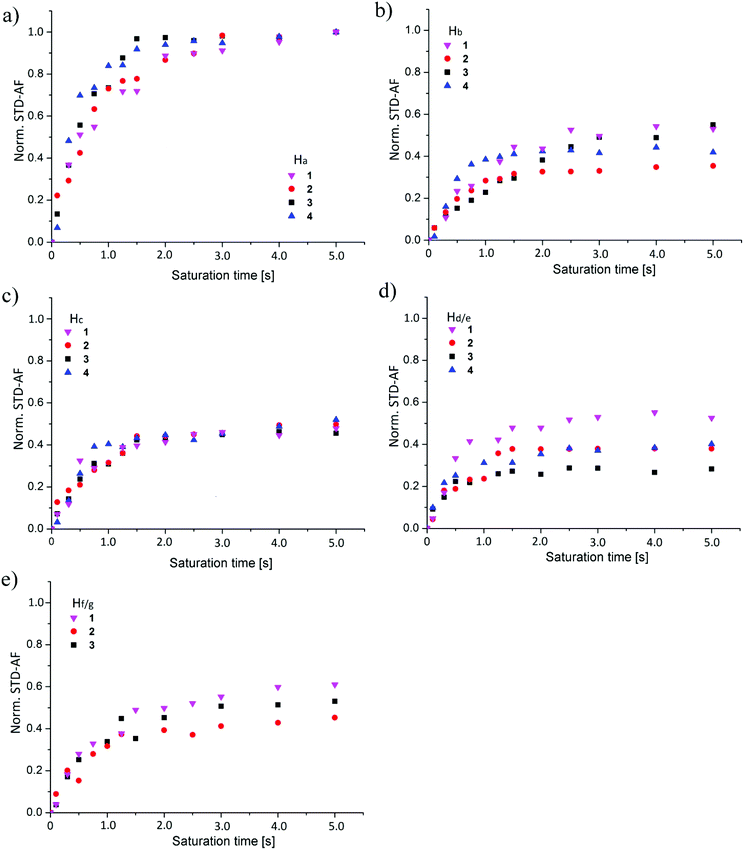
The normalized build-up curves of STD effects for individual protons were compared to characterise differences in binding modes among ligands 1–4 (Fig. 5). STD effects of analysed protons within individual ligand at different saturation times were normalized to STD effect of Ha proton at saturation time of 5.0 s.Good correspondence in overall trend between STD build-up curves was observed for Ha proton in 1–4 (Fig. 5a). One can observe slight deviation of data points among the ligands at saturation times between 1.0 and 2.0 s (Fig. 5a). Similar build-up curves suggest comparable binding conformation of mannose moiety in 1–4 in the binding site of DC-SIGN.
Normalized STD-AF values for Ha proton were the most pronounced in all four cases of interaction analysis of 1–4 with DC-SIGN. These results suggest that the Ha proton and associated mannose sugar serve as a binding initiator and are crucial for interaction. Comparison of normalized build-up curves for Hb proton indicated different rate of saturation of this proton within individual ligand. 1 and 3 exhibited comparable outline of build-up curves and reach almost identical plateau value. Build-up curve of 2 grew in the same way, but reached the plateau at a lower value. 4 experienced different build-up mode of Hb protons with steeper initial slope that flattens at value comparable to Hb proton of 2. Differences in saturation trend originate from contribution of both Hb protons of 4, which obviously get saturated in shorter time but do not contribute predominantly to the binding. The normalized STD-AF values for Hc proton showed excellent correspondence with deviation of individual experiments data points within experimental error (Fig. 5c). These observations confirmed analogous binding mode of Hc proton of 1–4. Hc protons of 1–3 participate approximately equally in the interaction with the receptor. Both Hc protons of 4 together showed similar plateau value as 1–3. However, one should keep in mind that the contribution of individual Hc proton would be markedly reduced, suggesting lower binding propensity of ligand 4. As in the case of Hb protons of 4 we observed analogous slope outline for Hc protons of 4 indicating faster rate of saturation in comparison to 1–3. The major differences in build-up curves were observed for Hd/e and Hf/g protons. The discrepancy for Hd and Hg protons of 1 was expected due to their different position on aromatic rings in comparison to Hf and He protons of 2–4. On the other hand, significant alterations in STD effects of He proton of 2 and 3 imply different binding properties of the naphthyl group and highlight sensitivity of binding characteristics of ligands. Although, He protons of 2 and 4 exhibited comparable STD build-up curves, direct comparison can be misleading since the curve of 4 represents saturation of two He protons (Fig. 5d). When comparing structural setup and position of Hd proton of 1 and He of 2–4 it is evident that Hd proton was closer to the surface of receptor with respect to He. Furthermore, the comparison of curves of Hf and Hg protons of the phenyl ring from 1–3 showed similar STD build-up (Fig. 5e). Because of the inseparability of two Hg protons of 1 and their joint contribution to STD values we believe that the Hf of 2 and 3 are still spatially closer to the hydrophobic groove of DC-SIGN in comparison to Hg of 1. Comparative analysis of 2 and 3 additionally revealed that Hf proton from 3 lies closer to the receptor with respect to Hf of 2. Higher lipophilicity of 3 evidently enables stronger interactions with the receptor. STD build-up curves comparison for 1–4 led us to conclusion that variations in chemical structures of ligands influence their bound conformations as well as binding modes in the binding site of DC-SIGN.
Evaluation of binding affinities
Amplification of STD effects with increasing concentration of 1–4 was used to determine the binding affinities. Receptor–ligand dissociation constants (KD) were determined with the use of single-ligand titration experiments that were performed at five different ligand concentrations from 80 to 800 μM at constant saturation time of 2.0 s. By monitoring the growth of the STD-AF upon titration KD values were calculated with the use of the eqn (3) (Fig. 6). Experimental data showed that the maximum STD-AF was not reached for any of ligands even at 800 μM ligand concentration. This observation is in agreement with fast exchange of ligands from the bound to the free state. The variation in exchange kinetics among the ligands is reflected in different slopes of hyperbolic curves (Fig. 6).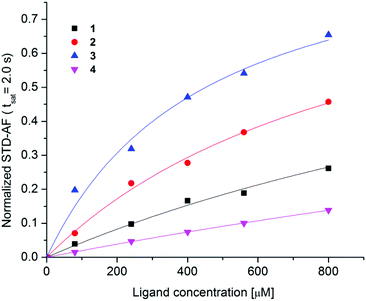 | ||
| Fig. 6 Normalized STD-AF curves as a function of ligand concentration in the range from 80 to 800 μM. Experimental data were collected at 25 °C, 2.0 s saturation time on a 600 MHz NMR spectrometer with 8 μM DC-SIGN concentration in 25 mM Tris-d11 (pD = 8.0), 150 mM NaCl, 4 mM CaCl2 and 25% DMSO-d6 in 2H2O. Experimental data were fitted to the eqn (3) (1: KD = 1.6 ± 0.5 mM, R2 = 0.992, 2: KD = 0.96 ± 0.08 mM, R2 = 0.999, 3: KD = 0.45 ± 0.05 mM, R2 = 0.997, 4: KD = 4.9 ± 0.7 mM, R2 = 0.999). | ||
Consistently, these results suggest that exchange kinetics was the fastest for 4 and the slowest for 3. Thus 3 stayed in the binding site of DC-SIGN for a longer period of time in comparison to other ligands. The binding affinity of 3 and 2 was in lower milimolar range with KD values of 0.45 mM and 0.96 mM, respectively. For 1 and 4 weaker binding with KD values of 1.6 mM and 4.9 mM was observed, respectively.
The direct comparison of KD values is difficult as many experimental factors, such as saturation time, ligand residence time in the complex, intensity of the signal and accumulation of saturation in the free ligand affect determination of receptor-ligand binding affinities by STD NMR spectroscopy. Therefore, we used binding isotherm of STD-AF initial growth approach that allows KD evaluation without aforementioned spurious factors. To verify the sensitivity of the system of individual ligand and DC-SIGN to saturation transfer, we analysed STD-AF of 2–4 at different ligand concentrations from 80 to 800 μM at saturation times between 1.0 and 4.0 s and obtained STD build-up curves. The STD0 values as a function of the ligand concentration were fitted to eqn (3) to determine KD values without dependence on the spectral properties of the observed signals (Fig. S8†). Binding isotherm protocol gave similar KD values in comparison to the titration experiments at a single saturation time. KD values were 0.90 mM for 2, 0.51 mM for 3 and 3.0 mM for 4. These KD values confirmed that 3 exhibits the lowest koff rate and thus spends the longest time as part of a complex with DC-SIGN.
Molecular docking
Plausible binding modes of compounds (S)-1, (R)-1, (S)-2, (R)-2, (S)-3 and (R)-3 were first studied by molecular docking calculations using our previously reported and validated FlexX protocol.23 The docking binding mode of compound 4 has already been described.23 DC-SIGN CRD in complex with Man4 (PDB entry: 1SL4) was selected as receptor for ligand docking under defined pharmacophore type constraints. In detail, to place the core D-mannose residue correctly, the side chain carboxylate groups of Glu354 and Glu347 were defined as hydrogen bond acceptors, which interact with 3- and 4-hydroxyl groups of the core D-mannose in the crystal structure. Additionally, a pharmacophore with spherical coordination around Ca2+ ion was defined to correctly consider the complex interactions between Ca2+ ion and 3- and 4-hydroxyl group of D-mannose. The D-mannose residue of the studied antagonists 1–4 is predicted to bind to the DC-SIGN Ca2+-binding site. In the case of (S)-3, (R)-3 (Fig. 7) and 4 the binding of the D-mannose residue is in agreement with the defined pharmacophore type constraints, whereas in the case of benzoic acid derivatives (S)-1, (R)-1, (S)-2 and (R)-2, the D-mannose residue is rotated in a way that only the 2-hydroxyl group is in contact with the Ca2+ ion. Such a D-mannose binding mode does not allow for octacoordination of the Ca2+ ion in the binding site and has, to the best of our knowledge, not been observed in the crystal structures of DC-SIGN CRD-ligand complexes. The FlexX-calculated binding modes of both diastereoisomers of compound 3 show the same binding mode of the D-mannose residue, which interacts with Ca2+ ion and forms hydrogen bonds with Glu347, Asn349, Glu354, Asn365 and Lys368 side chains (Fig. 7). The main difference is in the orientation of the diarylglycerol moiety. In the case of (R)-3 phenyl ring makes hydrophobic contacts with Phe313 and forms a hydrogen bond between ester carbonyl group and Ser360 side chain hydroxyl group, whereas the naphthalene ring points towards the solvent (Fig. 7a). The opposite can be observed in the binding mode of (S)-3, where the naphthalene ring contacts the Phe313 side chain, while the ester carbonyl group forms hydrogen bond with the Asn344 side chain (Fig. 7b). In contrast to (R)-3 and (S)-3 both naphthalene rings of compound 4 are predicted to form hydrophobic and/or π–π interactions with the side chain of Phe313.23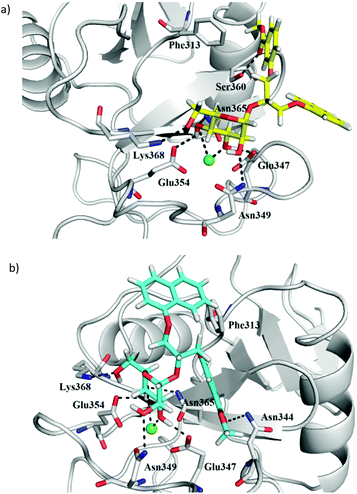 | ||
| Fig. 7 FlexX docking poses of compounds (a) (R)-3 (in yellow sticks) and (b) (S)-3 (in cyan sticks) in DC-SIGN CRD Ca2+-binding site. Protein (PDB entry: 1SL4) is presented in grey cartoon and Ca2+ ion as a green sphere. For clarity only side chains of amino acid residues predicted to interact with the docked ligands are shown as grey sticks. Hydrogen bonds are shown as black dashed lines. Figure was prepared by PyMOL.26 | ||
In order to evaluate whether other docking tools can correctly predict the D-mannose binding pose of compounds 1 and 2, the docking of compounds 1–4 to DC-SIGN CRD was repeated with our recently reported docking protocol27 using FRED 3.0.1,28–30 as available in OEDocking software (Release 3.0.1, OpenEye Scientific Software, Inc., Santa Fe, NM, USA; http://www.eyesopen.com/). In this case, the Glu347 and Glu354 side chains were defined as hydrogen bond acceptors and the Asn365 side chain as a hydrogen bond donor to constrain the placement of the D-mannose moiety. FRED docking poses for compounds (R)-3 and (S)-3 were found to be very similar to those obtained by FlexX, positioning the naphthalene and phenyl rings to the same binding pockets of the binding site (Fig. S9†). In contrast to FlexX, FRED was able to correctly place the D-mannose residue of (S)-1, (R)-1, (S)-2 and (R)-2, allowing the octacoordination of Ca2+ by interactions with D-mannose 3- and 4-hydroxyl groups (Fig. S10†). Both aromatic moieties of (S)-1, (R)-1, (S)-2 and (R)-2 form hydrophobic contacts and/or π–π interactions with Phe313 side chain (Fig. S10†), also observed in the case of compound 4.23 Carboxylic acid moiety of these ligands points toward the solvent and is not in contact with the protein.
Molecular dynamics simulations
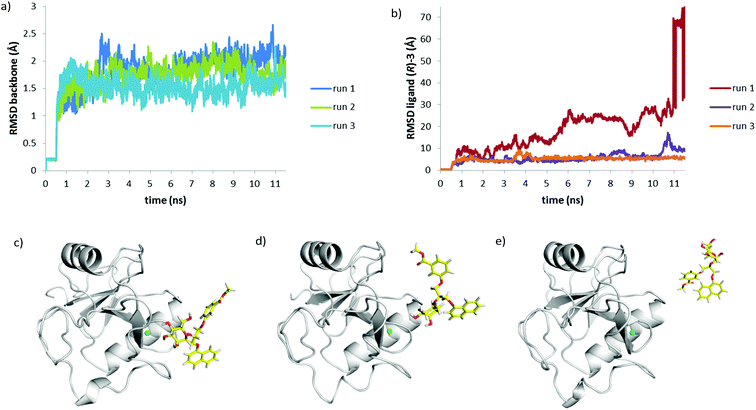
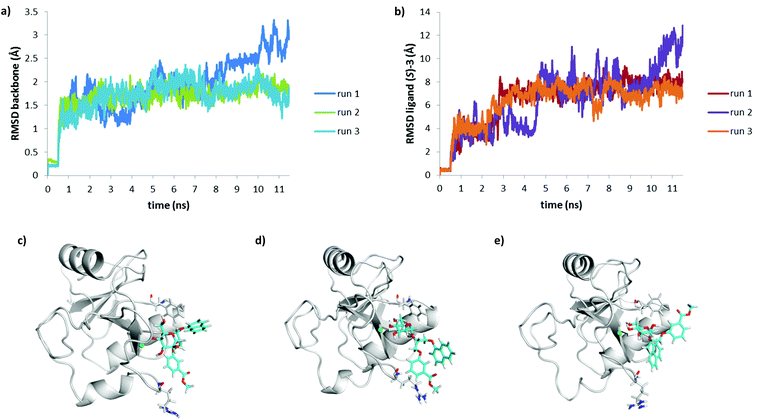
Recently, we have shown that DC-SIGN CRD is a challenging target for docking, because of its flat binding site, and careful selection of the docking software and parameters is needed to correctly predict the binding of DC-SIGN antagonists.27 Considering the flat DC-SIGN binding site, the use of semi-flexible docking protocols, where the protein is treated as rigid and the ligand as flexible, is not sufficient to represent the dynamic nature of DC-SIGN–ligand interactions in solution. Moreover, superposition of crystal structures of DC-SIGN CRD in complex with different ligands shows that some binding site residues, including Phe313, which is targeted by the hydrophobic substituents of 1–4, are rather flexible.Therefore, to get a better understanding of the binding of 3 to DC-SIGN CRD, molecular dynamics simulations of DC-SIGN CRD in complex with (R)-3 or (S)-3 in water were performed. Considering similar docking poses obtained by FRED and FlexX, the highest ranked FlexX docking pose for each ligand in complex with DC-SIGN CRD, as shown in Fig. 7, was selected to be used as an input for molecular dynamics simulation. The complexes were first solvated using TIP3P water model and were then subjected to molecular dynamics simulation, which consisted of three consecutive steps: (i) solvent equilibration for 0.5 ns with ligand and protein constrained harmonically around the initial structure; (ii) equilibration of the complete system for 1 ns with ligand and protein released; (iii) an unconstrained 10 ns production run to allow the protein and the ligand to position themselves according to physical forces between them. Physical stability of the simulations was monitored by temperature, volume and total energy vs. time plots. All these parameters of the system were stable during the production run of the simulation. Structural stability of the system during the simulation was monitored by measuring the RMSD values of protein backbone atoms during the simulation (Fig. 8a and 9a).
Interestingly, R and S isomers of 3 in complex with DC-SIGN showed significantly different behaviour during the molecular dynamics simulations. After 0.3 ns of the production run D-mannose 4-hydroxyl group of (R)-3 slowly began to lose contact with the Ca2+ ion (Fig. 8c). For the next 0.5 ns only D-mannose 3-hydroxyl group of (R)-3 was in contact with Ca2+ ion (Fig. 8d). Since Ca2+ ion was not octacoordinated anymore, the complex became unstable and the ligand left the binding site (Fig. 8e), which is also reflected by the large RMSD values of the ligand (Fig. 8b). In contrast, molecular dynamics simulation showed greater stability of the DC-SIGN CRD-(S)-3 complex (Fig. 9). Although quite high RMSD values for the ligand were observed (Fig. 9b), D-mannose moiety of (S)-3 remained tightly bound to Ca2+ ion and other interacting residues, as described above. Glycerol linker with the two aromatic moieties showed much greater flexibility than D-mannose. At the beginning of the production run, glycerol linker slightly rotated and oriented the phenyl ring of the (S)-3 toward Arg345, while the naphthyl ring remained in contact with Phe313 side chain (Fig. 9c), as observed in the docking conformation (Fig. 7b). During the next few nanoseconds of the simulation, the naphthyl ring of (S)-3 started moving away from the Phe313 (Fig. 9d) and finally reached Asn344/Arg345 site (Fig. 9e). Such a rotation of the glycerol linker resulted also in reorientation of the phenyl ring, which left the Asn344/Arg345 site and moved toward Phe313 (Fig. 9d and e); however, it was mainly in contact with solvent.
To evaluate whether the observed differences in (R)-3 and (S)-3 behaviour during the first MD simulation are relevant, the MD was repeated twice more for each DC-SIGN–ligand complex. In all cases the protein backbone was structurally stable, reflected by the low RMSD values (Fig. 8a and 9a). Ligand RMSD values and visual inspection of the trajectory during different MD runs of DC-SIGN-(S)-3 complex showed that the D-mannose moiety is tightly bound to Ca2+ and neighbouring amino acid residues, while the diaryl substituted glycerol linker finally adopts conformation similar to that presented in Fig. 9e. In contrast to the first MD simulation run of DC-SIGN-(R)-3 complex, the second and third runs showed its better stability. Towards the end of the second production run the D-mannose moiety of (R)-3 began to lose contact with Ca2+, which might eventually lead to dissociation of the complex, as presented in Fig. 8d and e. In the third run, the complex remained fairly stable, reflected by the relatively low RMSD values (Fig. 8b). D-Mannose residue of (R)-3 was constantly in contact with Ca2+, while the diarylglycerol moiety showed conformational flexibility.
The final pose of production run was very similar to that of (S)-3 presented in Fig. 9d, with the naphthalene ring pointing toward solvent and the phenyl ring interacting with Arg345 side chain.
Discussion
The current study presents new structural and mechanistic details at the atomic level of binding interactions of novel monovalent antagonists with DC-SIGN. Acquired STD NMR data on 1–4 unequivocally demonstrated their interactions in the binding site of the receptor. The STD group epitope mapping revealed that the mannose group formed the strongest interactions with the DC-SIGN and was in the closest contact to the receptor in the case of ligands 1–4 (Fig. 3). Individual STD contributions and interaction involvements of sugar protons were inseparable due to spectral overlap of signals between δ 3.3 and 3.9 ppm. On the other hand, anomeric Ha proton of 1–4 displayed well-resolved signals with δ between 5.0 and 5.2 ppm. Additionally, most effective STD transfer to Ha proton of 1–4 was observed among all investigated protons (i.e. Ha–Hg). Consequently, Ha proton was considered as an adequate representative of strong mannose group interaction. These results correlate well with the known binding specificity of DC-SIGN for D-mannose sugar.23,24,31In accord with group epitope mapping results, STD build-up studies revealed the tightest involvement of Ha (and thus mannose group) in DC-SIGN interaction. Normalized build-up curves for Ha–Hg protons of 1–4 exposed structure modification-related differences in binding modes. These curves were consistent in the case of Ha proton, indicating that binding configuration of mannose sugar was very similar for all studied ligands. The latter was confirmed for Hc proton on the naphthyl ring as well. Normalized STD build-up curves with great agreement confirmed analogous binding mode of Hc proton regardless of structure variations of ligands. On the other hand, build-up curves of Hb proton indicated altered involvement of this proton in ligand–receptor interaction. Results suggest that Hb proton is in closer contact with the receptor in 1 and 3 in comparison to 2 and 4. Additionally, from comparison of Hd/e protons it is obvious that Hd of 1 was closer to the surface of the receptor with respect to He of 2–4. One should keep in mind that in the case of all naphthyl protons in 4 individual contributions would be markedly reduced because of overall symmetry-related STD effects of Hb, Hc and He protons. Although, build-up curves of Hb and Hc of 4 indicating faster rate of saturation in comparison to 1–3, maximum STD-AF were reached at lower values. Rapid saturation at low STD-AF plateau values is an indicator of fast exchange kinetics, which is in agreement with exchange properties of 4. The latter was also confirmed with the highest KD value among 1–4 which supports our observations of lowest binding affinity of 4.
While two naphthyl constituents demonstrated low interaction tendency, substitution one of naphthyl ring with phenyl moiety resulted in moderate improvement of binding propensity. Our results indicate that a different position of the carboxylic group on the phenyl ring influences the binding conformation not only of modified part of ligand but also of intact naphthyl ring. When comparing 1 and 2 it is obvious that the position of the carboxylic group on the phenyl moiety affects the binding propensity of the ligand. Although, STD-build up curves show that Hb and Hc protons of 1 lay closer to the receptor in comparison to 2, the opposite was observed for Hg of 1 and Hf of 2. Contribution of individual Hg proton of 1 is believed to be lower than of Hf of 2. para-Position of the carboxylic group on the phenyl ring in 1 displays better binding properties of adjacent naphthyl moiety in comparison to 2. However, shift of the carboxylic group from para- to meta-position improved binding propensity of the phenyl constituent as confirmed by STD group epitope mapping and evaluation of KD values. Lower KD value determined for 2 (0.96 mM) in comparison to 1 (1.6 mM) indicates better binding tendency of overall ligand. First, these results imply that, between both constituents, the phenyl moiety primarily contributes to binding affinity and plays a more important role in complex formation. And second, the carboxylic group at meta-position on the phenyl ring prolongs the half-life of ligand–receptor complex.
Furthermore, esterification of the carboxylic group at meta-position on the phenyl moiety additionally decreased KD value. Notable differences in binding properties among 2 and 3 were observed not only for Hf proton but also for the whole set of protons on the naphthyl ring. Hf proton was after carboxylic group esterification closer to the surface of the receptor, since STD effect increased from 68% in 2 to 77% in 3. Greater spatial proximity was additionally confirmed with higher normalized STD-AF values for Hf of 3 in regard to 2. While Hc protons of 2 and 3 demonstrated analogous binding involvements, Hb of 3 was shown to be closer to the receptor surface. On the other hand, in the case of He proton of 3 we observed less intense contact to the receptor in comparison to 2. It is evident that esterification of the carboxylic group enhanced the binding features of 3 which was reflected in lowest KD value among 1–4 (0.45 mM). Additionally, we confirmed that esterification affected the position of the naphthyl ring in the binding site of DC-SIGN as well.
Our molecular docking and molecular dynamics simulations showed that structure-based design of novel DC-SIGN antagonists based only on docking calculations remains a great challenge and provides very limited information about the protein–ligand interactions in solution. Docking protocol is usually able to correctly predict the binding of the D-mannose moiety, which is in most cases the most tightly bound part of the DC-SIGN antagonist. Because of the rather flat DC-SIGN binding site, there are only few residues that could be targeted with the ligand to increase its affinity. In our case, aromatic moieties for interaction with the Phe313 side chain were introduced to improve the binding by possible π–π stacking/hydrophobic interactions, while carboxylates were introduced to explore possible formation of additional ionic interaction with Arg345 (see Fig. 10). While the docking calculations predicted the targeted hydrophobic interaction between the ligand and DC-SIGN (Fig. 7), molecular dynamics simulations showed that these interactions are probably quite weak given the observed flexibility of the ligands and low stability of the complexes during the molecular dynamics simulations (Fig. 8 and 9).
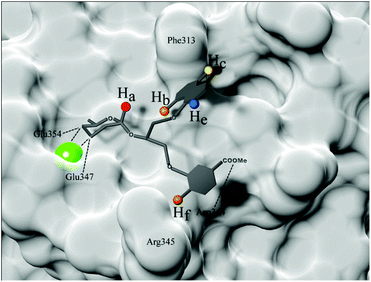 | ||
| Fig. 10 Binding model of DC-SIGN-3 complex predicted based on measured STD effects and molecular modelling results. Surface of DC-SIGN CRD Ca2+-binding site is shown in the back (PDB code 1SL424). Ca2+ ion is shown as bigger green sphere, while observed ligand protons, namely Ha, Hb, Hc, He and Hf, are shown as smaller spheres. Ligand protons are coloured based on ligand–receptor interproton distance, red displaying the closest and blue presenting the most distant spatial proximity. Hydrogen and coordination bonds are marked with dashed lines. | ||
Therefore, taken together the results of STD NMR and molecular dynamics simulations, we can conclude that our ligands bind rather tightly through D-mannose residue. We proposed a binding model of DC-SIGN-3 complex based on combined results obtained by NMR and molecular modelling (Fig. 10). Interaction of the 3- and 4-hydroxyl groups of D-mannose with DC-SIGN CRD Ca2+-binding site is driven by four key bonds, namely two coordination bonds with Ca2+ ion and two H-bonds with side chains of Glu347 and Glu354. Additionally, H-bonds between other D-mannose hydroxyl groups and Asn349, Asn365 and Lys368 side chains of DC-SIGN were predicted as well. Strongest interaction of D-mannose was confirmed by highest STD effects for Ha proton, marked with red (Fig. 10). Other parts of the ligands show moderate flexibility, especially glycerol linker that enables rather free conformations and binding possibilities of attached aryl moieties. However, the naphthyl ring was detected in the spatial proximity to Phe313 where it forms hydrophobic interactions as predicted.
STD NMR results suggest that the naphthyl moiety adopts a conformation where Hb proton (orange on Fig. 10) is the closest to the receptor followed by Hc proton (yellow on Fig. 10). Weakest interaction and thus greatest receptor–ligand interproton distance was observed for He proton, marked with blue. On the other hand, flexibility resulting from glycerol linker allowed unforeseen engagement of phenyl group in more polar area, where it forms hydrogen bond with Asn344 and contacts with Arg345 (possible cation–π interaction) of DC-SIGN. Conformation of the phenyl entity thus apparently depends on quite prominent Hf proton–receptor proximity and formation of hydrogen bond between esterified carboxylic group and Asn344 side chain. Observation of phenyl moiety retention in polar environment of the binding site offers new insights in ligand behaviour within flat binding sites and additionally emphasizing the need for further designing of novel and more potent DC-SIGN antagonists.
Experimental
Chemistry
Detailed information is given in the ESI.†STD-amplification factor is determined according to eqn (1), in which STD-AF is a STD amplification factor. Ioff stands for intensity of signal in off-resonance spectrum. Isat is intensity of signal in on-resonance spectrum. Ioff − Isat represents the intensity of the STD NMR spectrum. [L] is the concentration of ligand and [P] stands for the concentration of receptor.
 | (1) |
The build-up curves are fitted to the monoexponential eqn (2), where STD-AF stands for the STD amplification factor of a given proton at saturation time t, STDmax is the maximal STD intensity obtainable when long saturation times are used, and ksat is the observed saturation rate constant.
| STD-AF = STDmax (1 − e(−ksatt)) | (2) |
The hyperbolic behaviour of the curves obtained from the plot of STD-AF as a function of ligand concentration is appropriately described by eqn (3), where STD-AF is a STD amplification factor, αSTD represents the maximum amplification factor, [L] is a ligand concentration and KD is dissociation constant.
 | (3) |
For the non-linear least-squares curve-fitting to the eqn (2) and (3) was used Origin 8.1 software.33 All experimental data were presented with standard errors bars.
Molecular modelling
The crystal structure of DC-SIGN CRD in complex with tetramannoside Man4 (PDB entry: 1SL4) was taken as a receptor for docking calculations using FlexX36,37 as available in LeadIT.38 Receptor was prepared in LeadIT graphical user interface using the Receptor wizard. Amino acid residues within a radius of 7 Å around Man4 were defined as the binding site. Hydrogen atoms were added to the binding site residues and correct tautomers and protonation states were assigned. Water molecules and the ligand were deleted from the crystal structure, while Ca2+ ion in the Ca2+ binding site was defined as part of the receptor. Pharmacophore type constraints in FlexX-Pharm were defined in order to correctly place the core mannose residue during the docking procedure. First, PharmMetal pharmacophore with spherical coordination around Ca2+ ion was defined to account correctly for complex interactions between Ca2+ ion (406) and D-mannose residue of the designed ligands. Secondly, side chain carboxylate groups of Glu347 and Glu354 were defined as hydrogen bond acceptors, which form hydrogen bonds with 3- and 4-hydroxyl groups of D-mannose residue in the crystal structure. All three selected pharmacophore type constraints were specified as essential.
For docking with FRED software (Release 3.0.1, OpenEye Scientific Software, Inc., Santa Fe, NM, USA; http://www.eyesopen.com), the protein was prepared using MAKE RECEPTOR (Release 3.0.1, OpenEye Scientific Software, Inc., Santa Fe, NM, USA; http://www.eyesopen.com).28–30 We determined the grid box size; inner and outer contours of the grid box were calculated automatically. The outer contour size was 6195 Å3, while the grid box size was 9216 Å3. The setup of contours was set as “Balanced”. Amino acid residues Asn365, Glu347 and Glu354 and Ca2+ ion were defined as pharmacophore type constraints. FRED requires the preparation of input conformers of each ligand prior to docking. These conformers were generated using OMEGA 2.4.639 from OpenEye Scientific Software.
Ligands 1–4 were also docked using FRED (version 3.0.1. OpenEye Scientific Software, Inc., Santa Fe, NM, USA; http://www.eyesopen.com).28–30 Docking resolution was set to high, other settings were set as default. Twenty-five docking solutions were inspected visually and the best ranked FRED-calculated conformation was used for analysis and representation.
![[thin space (1/6-em)]](https://www.rsc.org/images/entities/char_2009.gif) 000 steps) and adopted basis Newton–Raphson (10
000 steps) and adopted basis Newton–Raphson (10![[thin space (1/6-em)]](https://www.rsc.org/images/entities/char_2009.gif) 000 steps) energy minimizations were first performed to remove atomic clashes and to optimize the atomic coordinates of the protein – ligand complex. The structure of the energy minimized complex for MD simulation was prepared using psfgen in VMD (version 1.9.1.).45 The complex was then embedded in a box of water, which was modelled explicitly by a TIP3P model.46 The system was neutralized by addition of KCl at 0.4 M concentration. The MD simulation was carried out in the NPT ensemble employing periodic boundary conditions. Langevin dynamics and Langevin piston methods were used for temperature (300 K) and pressure (1 atm) control, respectively. Short- and long-range forces were calculated every 1 and 2 timesteps, respectively, with a timestep of 2.0 ps. The smooth particle mesh Ewald method47 was used to calculate electrostatic interactions. The short-range interactions were cut off at 12 Å. All chemical bonds between hydrogen and heavy atoms were held fixed using SHAKE algorithm.48 The simulation consisted of three consecutive steps: (i) solvent equilibration for 0.5 ns with ligand and protein constrained harmonically around the initial structure; (ii) equilibration of the complete system for 1 ns with ligand and protein released; (iii) an unconstrained 10 ns production run to allow the protein and the ligand to position themselves according to physical forces between them. The trajectory of the equilibration and production run was used for analysis in VMD. The MD simulation of each complex was repeated three times.
000 steps) energy minimizations were first performed to remove atomic clashes and to optimize the atomic coordinates of the protein – ligand complex. The structure of the energy minimized complex for MD simulation was prepared using psfgen in VMD (version 1.9.1.).45 The complex was then embedded in a box of water, which was modelled explicitly by a TIP3P model.46 The system was neutralized by addition of KCl at 0.4 M concentration. The MD simulation was carried out in the NPT ensemble employing periodic boundary conditions. Langevin dynamics and Langevin piston methods were used for temperature (300 K) and pressure (1 atm) control, respectively. Short- and long-range forces were calculated every 1 and 2 timesteps, respectively, with a timestep of 2.0 ps. The smooth particle mesh Ewald method47 was used to calculate electrostatic interactions. The short-range interactions were cut off at 12 Å. All chemical bonds between hydrogen and heavy atoms were held fixed using SHAKE algorithm.48 The simulation consisted of three consecutive steps: (i) solvent equilibration for 0.5 ns with ligand and protein constrained harmonically around the initial structure; (ii) equilibration of the complete system for 1 ns with ligand and protein released; (iii) an unconstrained 10 ns production run to allow the protein and the ligand to position themselves according to physical forces between them. The trajectory of the equilibration and production run was used for analysis in VMD. The MD simulation of each complex was repeated three times.
Conclusions
In the present study we investigated the interactions between four monovalent mannose-based ligands and extracellular domain of DC-SIGN. The studied ligands, some of which are novel entities, consist of α-D-mannose connected by glycerol linker to different aryl moieties, which were expected to tune interactions of ligands in hydrophobic groove of the receptor. The combination of saturation transfer difference (STD) NMR spectroscopy and molecular modelling has been used to examine binding affinity of monovalent glycomimetics for DC-SIGN at the atomic level of resolution. Our study showed that four α-D-mannoside ligands interact with the binding site predominantly with the mannose moiety. Importantly, the other two aromatic groups that are bound to α-D-mannose through glycerol linker demonstrate interaction that can be related to their substituent pattern. Ligand with naphthyl and meta-substituted phenyl ring exhibited the most favourable binding characteristics, which might imply involvement of new contacts of substituted phenyl moiety in more polar area of flat binding site of DC-SIGN. Although our first impression was that carboxylate in the studied ligands should interact primarily with Arg345, it seems that the Asn344 residue forms H-bond with the polar group and thus dictates the main interactions with the polar substituent at phenyl ring, while Arg345 possibly forms cation–π interaction with the phenyl moiety. Our findings point that besides lipophilic residues, possible involvement of H-bonds and/or cation–π might boost the interaction of small molecule DC-SIGN ligands and thus offer new possibilities in further designing of novel, stronger DC-SIGN antagonists.Acknowledgements
This work was supported by the Slovenian Research Agency (ARRS, grants P1-0208, P1-0242 and J1-6733). The authors thank Matjaž Weiss for help with the synthetic part of the work and Prof. Dr Franck Fieschi for the DC-SIGN ECD produced in his laboratory.Notes and references
- M. Altfeld, L. Fadda, D. Frleta and N. Bhardwaj, Nat. Rev. Immunol., 2011, 11, 176 CrossRef CAS PubMed.
- H. Liu, W. Bi, Q. Wang, L. Lu and S. Jiang, Biomed. Res. Int., 2015, 2015, 594109 Search PubMed.
- M. M. Lederman, R. E. Offord and O. Hartley, Nat. Rev. Immunol., 2006, 6, 371 CrossRef CAS PubMed.
- M. Danial and H. A. Klok, Macromol. Biosci., 2015, 15, 9 CrossRef CAS PubMed.
- UNAIDS, 2012.
- R. C. da Silva, L. Segat and S. Crovella, Hum. Immunol., 2011, 72, 305 CrossRef PubMed.
- L. M. van den Berg, S. I. Gringhuis and T. B. Geijtenbeek, Ann. N. Y. Acad. Sci., 2012, 1253, 149 CrossRef CAS PubMed.
- M. Anderluh, G. Jug, U. Svajger and N. Obermajer, Curr. Med. Chem., 2012, 19, 992 CrossRef CAS PubMed.
- E. J. Soilleux, Clin. Sci., 2003, 104, 437 CrossRef CAS PubMed.
- L. M. van den Berg, S. I. Gringhuis and T. B. H. Geijtenbeek, Ann. N. Y. Acad. Sci., 2012, 1253, 149 CrossRef CAS PubMed.
- U. Švajger, M. Anderluh, M. Jeras and N. Obermajer, Cell. Signalling, 2010, 22, 1397 CrossRef PubMed.
- D. A. Mitchell, A. J. Fadden and K. Drickamer, J. Biol. Chem., 2001, 276, 28939 CrossRef CAS.
- Y. van Kooyk and T. B. Geijtenbeek, Nat. Rev. Immunol., 2003, 3, 697 CrossRef CAS PubMed.
- D. S. Kwon, G. Gregorio, N. Bitton, W. A. Hendrickson and D. R. Littman, Immunity, 2002, 16, 135 CrossRef CAS PubMed.
- C. R. Becer, M. I. Gibson, J. Geng, R. Ilyas, R. Wallis, D. A. Mitchell and D. M. Haddleton, J. Am. Chem. Soc., 2010, 132, 15130 CrossRef CAS PubMed.
- M. J. Borrok and L. L. Kiessling, J. Am. Chem. Soc., 2007, 129, 12780 CrossRef CAS PubMed.
- S. L. Mangold, L. R. Prost and L. L. Kiessling, Chem. Sci., 2012, 3, 772 RSC.
- N. Obermajer, S. Sattin, C. Colombo, M. Bruno, U. Švajger, M. Anderluh and A. Bernardi, Mol. Diversity, 2011, 15, 347 CrossRef CAS PubMed.
- Z. Arsov, U. Švajger, J. Mravljak, S. Pajk, A. Kotar, I. Urbančič, J. Štrancar and M. Anderluh, ChemBioChem, 2015 DOI:10.1002/cbic.201500376.
- G. Tabarani, J. J. Reina, C. Ebel, C. Vives, H. Lortat-Jacob, J. Rojo and F. Fieschi, FEBS Lett., 2006, 580, 2402 CrossRef CAS PubMed.
- M. Thepaut, C. Guzzi, I. Sutkeviciute, S. Sattin, R. Ribeiro-Viana, N. Varga, E. Chabrol, J. Rojo, A. Bernardi, J. Angulo, P. M. Nieto and F. Fieschi, J. Am. Chem. Soc., 2013, 135, 2518 CrossRef CAS PubMed.
- G. Timpano, G. Tabarani, M. Anderluh, D. Invernizzi, F. Vasile, D. Potenza, P. M. Nieto, J. Rojo, F. Fieschi and A. Bernardi, ChemBioChem, 2008, 9, 1921 CrossRef CAS PubMed.
- T. Tomašič, D. Hajšek, J. Luzar, N. Obermajer, I. Petit-Haertlein, F. Fieschi and M. Anderluh, Eur. J. Med. Chem., 2014, 75, 308 CrossRef PubMed.
- Y. Guo, H. Feinberg, E. Conroy, D. A. Mitchell, R. Alvarez, O. Blixt, M. E. Taylor, W. I. Weis and K. Drickamer, Nat. Struct. Mol. Biol., 2004, 11, 591 CAS.
- T. Tomašič, S. Rabbani, M. Gobec, I. M. Raščan, C. Podlipnik, B. Ernst and M. Anderluh, MedChemComm, 2014, 5, 1247 RSC.
- PyMOL, Delano Scientific LLC, San Francisco, CA, http://pymol.sourceforge.net Search PubMed.
- G. Jug, M. Anderluh and T. Tomašič, J. Mol. Model, 2015, 21, 164 CrossRef PubMed.
- G. B. McGaughey, R. P. Sheridan, C. I. Bayly, J. C. Culberson, C. Kreatsoulas, S. Lindsley, V. Maiorov, J. F. Truchon and W. D. Cornell, J. Chem. Inf. Model., 2007, 47, 1504 CrossRef CAS PubMed.
- M. McGann, J. Chem. Inf. Model., 2011, 51, 578 CrossRef CAS PubMed.
- M. R. McGann, H. R. Almond, A. Nicholls, J. A. Grant and F. K. Brown, Biopolymers, 2003, 68, 76 CrossRef CAS PubMed.
- J. Angulo, I. Díaz, J. J. Reina, G. Tabarani, F. Fieschi, J. Rojo and P. M. Nieto, ChemBioChem, 2008, 9, 2225 CrossRef CAS PubMed.
- G. Tabarani, M. Thepaut, D. Stroebel, C. Ebel, C. Vives, P. Vachette, D. Durand and F. Fieschi, J. Biol. Chem., 2009, 284, 21229 CrossRef CAS PubMed.
- OriginLab, Origin Version 8.1, http://www.OriginLab.com Search PubMed.
- GAMESS interface, ChemBio3D Ultra 13.0, ChemBioOffice Ultra 13.0, CambridgeSoft Search PubMed.
- T. A. Halgren, J. Comput. Chem., 1996, 17, 490 CrossRef CAS.
- M. Rarey, B. Kramer, T. Lengauer and G. Klebe, J. Mol. Biol., 1996, 261, 470 CrossRef CAS PubMed.
- M. Rarey, S. Wefing and T. Lengauer, J. Comput. Aided Mol. Des., 1996, 10, 41 CrossRef CAS PubMed.
- BioSolve IT (GmbH), LeadIT version 2.1.3 Search PubMed.
- P. C. D. Hawkins, A. G. Skillman, G. L. Warren, B. A. Ellingson and M. T. Stahl, J. Chem. Inf. Model., 2010, 50, 572 CrossRef CAS PubMed.
- J. C. Phillips, R. Braun, W. Wang, J. Gumbart, E. Tajkhorshid, E. Villa, C. Chipot, R. D. Skeel, L. Kale and K. Schulten, J. Comput. Chem., 2005, 26, 1781 CrossRef CAS PubMed.
- A. D. MacKerell, D. Bashford, M. Bellott, R. L. Dunbrack, J. D. Evanseck, M. J. Field, S. Fischer, J. Gao, H. Guo, S. Ha, D. Joseph-McCarthy, L. Kuchnir, K. Kuczera, F. T. K. Lau, C. Mattos, S. Michnick, T. Ngo, D. T. Nguyen, B. Prodhom, W. E. Reiher, B. Roux, M. Schlenkrich, J. C. Smith, R. Stote, J. Straub, M. Watanabe, J. Wiorkiewicz-Kuczera, D. Yin and M. Karplus, J. Phys. Chem. B, 1998, 102, 3586 CrossRef CAS PubMed.
- K. Vanommeslaeghe, E. Hatcher, C. Acharya, S. Kundu, S. Zhong, J. Shim, E. Darian, O. Guvench, P. Lopes, I. Vorobyov and A. D. MacKerell, J. Comput. Chem., 2010, 31, 671 CAS.
- K. Vanommeslaeghe and A. D. MacKerell, J. Chem. Inf. Model., 2012, 52, 3144–3154 CrossRef CAS PubMed.
- K. Vanommeslaeghe, E. P. Raman and A. D. MacKerell, J. Chem. Inf. Model., 2012, 52, 3155 CrossRef CAS PubMed.
- W. Humphrey, A. Dalke and K. Schulten, J. Mol. Graphics Modell., 1996, 14, 33 CrossRef CAS.
- W. L. Jorgensen, J. Chandrasekhar, J. D. Madura, R. W. Impey and M. L. Klein, J. Chem. Phys., 1983, 79, 926 CrossRef CAS.
- T. Darden, D. York and L. Pedersen, J. Chem. Phys., 1993, 98, 10089 CrossRef CAS.
- J. P. Ryckaert, G. Ciccotti and H. J. C. Berendsen, J. Comput. Phys., 1977, 23, 327 CrossRef CAS.
Footnote |
| † Electronic supplementary information (ESI) available. See DOI: 10.1039/c5ob01916h |
| This journal is © The Royal Society of Chemistry 2016 |

