
 Open Access Article
 This Open Access Article is licensed under a
 Creative Commons Attribution 3.0 Unported Licence
Field-induced self-assembly of iron oxide nanoparticles investigated using small-angle neutron scattering
Zhendong
Fu
*a,
Yinguo
Xiao
b,
Artem
Feoktystov
a,
Vitaliy
Pipich
a,
Marie-Sousai
Appavou
a,
Yixi
Su
a,
Erxi
Feng
a,
Wentao
Jin
a and
Thomas
Brückel
b
aJülich Centre for Neutron Science (JCNS) at Heinz Maier-Leibnitz Zentrum (MLZ), Forschungszentrum Jülich GmbH, Lichtenbergstraße 1, D-85748 Garching, Germany. E-mail: z.fu@fz-juelich.de
bJülich Centre for Neutron Science and Peter Grünberg Institut, JARA-FIT, Forschungszentrum Jülich GmbH, 52425 Jülich, Germany
First published on 26th October 2016
Abstract
The magnetic-field-induced assembly of magnetic nanoparticles (NPs) provides a unique and flexible strategy in the design and fabrication of functional nanostructures and devices. We have investigated the field-induced self-assembly of core–shell iron oxide NPs dispersed in toluene by means of small-angle neutron scattering (SANS). The form factor of the core–shell NPs was characterized and analyzed using SANS with polarized neutrons. Large-scale aggregates of iron oxide NPs formed above 0.02 T as indicated by very-small-angle neutron scattering measurements. A three-dimensional long-range ordered superlattice of iron oxide NPs was revealed under the application of a moderate magnetic field. The crystal structure of the superlattice has been identified to be face-centred cubic.
1. Introduction
The intriguing phenomenon of self-assembly of colloidal magnetic nanoparticles (NPs) into well-defined one-, two- and three-dimensional (1D, 2D, 3D) ordered arrays, has been attracting much attention because it provides a bottom-up strategy for the fabrication of functional nanostructures and model systems, which can be manipulated by controlling external parameters such as a magnetic or an electric field, pressure, temperature, surfactant, and concentration.1–6 The geometry of the hierarchical structures from self-assembled nanoparticles can also be tailored by controlling the size, shape and interparticle interactions of the constituents.5,7–10 Ordered arrays of magnetic NPs show different behaviour from that of the bulk and may possess extraordinary application potential in many fields such as photonics,11–13 drug delivery and cancer treatment,14–16 gene transfection,17,18 patterning,19–21 energy storage,22–24 and magnetic levitation.25,26 As a fast and reversible bottom-up approach among the various directed and template-assisted rational strategies, the magnetic field-driven self-assembly of magnetic NPs provides tremendous flexibility and a wide scope for experimental fabrication.6,27Iron oxide NPs are of special interest among the huge number of nanomaterials because of their easy preparation, low cost, high chemical stability, and tunable magnetic and surface properties.28,29 It is highly desirable to study the self-assembly of iron oxide NPs from both fundamental and application points of view. The 1D chain assembly of Fe3O4 colloidal nanocrystal clusters was found to show tunable photonic properties across the whole visible region through the application of a relatively weak external field.11 Dipolar ferromagnetism was revealed in the 2D monolayer of Fe3O4 NPs with hexagonal packing by Fresnel Lorentz microscopy and electron holography.30 Large-area 2D assemblies of octahedron-shaped iron oxide NPs were obtained via a simple solvent-evaporation procedure under an in-plane weak magnetic field.31 A 3D ordering with a base-centred monoclinic symmetry was induced in silica coated hematite nanocubes by an external magnetic field.32 As to the silica coated Fe3O4 nanospheres, the equilibrium symmetries of the colloidal crystals were reported to be random hexagonal close packed in the absence of an external magnetic field and body-centred tetragonal (BCT) with an external field, respectively.33 Disch et al. found that after drop-casting the nanoparticle dispersion in an applied magnetic field, both isotropic spherical and anisotropic highly-truncated cubic iron oxide NPs are ordered in a face-centred cubic (FCC) arrangement,34 while a BCT symmetry was obtained in iron oxide nanocubes with moderate degree of truncation.35
Small-angle neutron scattering (SANS) is one of the most powerful techniques for non-destructive structural characterization in nanomaterials. SANS can provide valuable information not only on the size and shape of the nano-sized constituents by probing their form factor, but also their spatial correlations and organization through the structure factor. This is because SANS has a relatively large range of the scattering vector Q, which is defined as 4π![[thin space (1/6-em)]](https://www.rsc.org/images/entities/char_2009.gif) sin(θ)/λ with 2θ being the angle between the incident and the scattered neutron beam, and λ being the incident neutron wavelength. Due to the high penetration of neutrons in matter, SANS is well suited for the in situ investigations on the samples in liquid.36,37 The nuclear and magnetic neutron scattering contributions from magnetic NPs can be separated by measuring SANS with polarized neutrons (SANSpol). The very-small-angle neutron scattering (VSANS) can detect large aggregations with real-space sizes from several hundred nanometers to several micrometers. In this paper, we employ both techniques to investigate the magnetic-field-induced assembly of iron oxide NPs.
sin(θ)/λ with 2θ being the angle between the incident and the scattered neutron beam, and λ being the incident neutron wavelength. Due to the high penetration of neutrons in matter, SANS is well suited for the in situ investigations on the samples in liquid.36,37 The nuclear and magnetic neutron scattering contributions from magnetic NPs can be separated by measuring SANS with polarized neutrons (SANSpol). The very-small-angle neutron scattering (VSANS) can detect large aggregations with real-space sizes from several hundred nanometers to several micrometers. In this paper, we employ both techniques to investigate the magnetic-field-induced assembly of iron oxide NPs.
2. Experimental
2.1 Materials
Iron oxide NPs used for the present work are from a Fe3O4 magnetic NP solution (product number: 700304) purchased from Sigma-Aldrich Corporation without any chemical treatment and purification prior to the experiments. The concentration of the iron oxide NPs was 0.6 wt% (≈0.1 vol%). The surface of the Fe3O4 NPs was coated with oleic acid, which allows the dispersity of particles in toluene and prevents the Fe3O4 NPs from agglomeration.2.2 Characterization
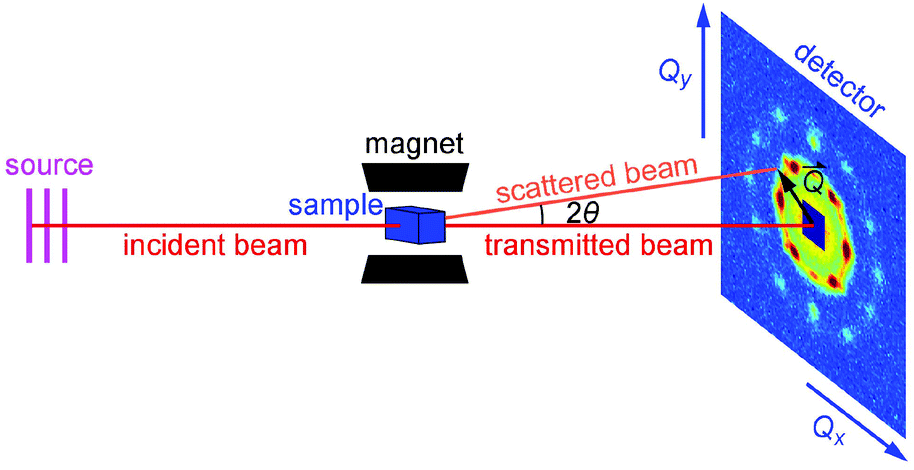 | ||
| Fig. 1 Schematic diagram of the experimental setup for the field-dependent SANS and VSANS measurements. | ||
3. Results and discussion
Fig. 2a shows a typical TEM image of the iron oxide NPs. As revealed by the TEM image, the NPs are spherical in shape and relatively uniform-sized. They show a tendency to form a hexagonal arrangement.45 Under the TEM we observe mainly iron oxide cores of the NPs because the contrast from oleic acid on a carbon film is negligible. The size distribution of the iron oxide cores and the best fit with the Gaussian function are plotted in the inset of Fig. 2a. The average core diameter is estimated to be 17.1 ± 0.7 nm by counting 520 nanoparticles in several TEM images. The average distance between the surfaces of the cores of neighbouring NPs is about 3.5 nm.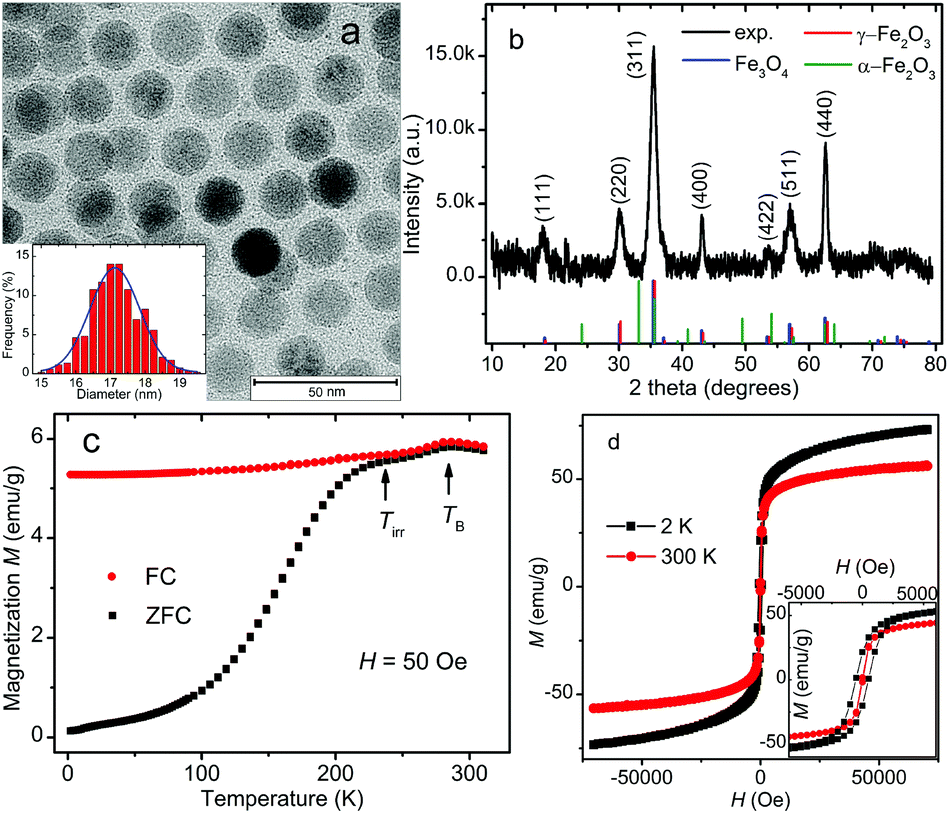 | ||
| Fig. 2 (a) Representative TEM image. The inset is the size distribution of iron oxide NPs. (b) Indexed XRD pattern of iron oxide NPs, along with the calculated patterns for magnetite (blue), maghemite (red) and hematite (green). (c) Magnetization M vs. temperature plots measured with zero-field-cooled (ZFC, black squares) and field-cooled (FC, red circles) procedures. (d) Magnetization M plotted as a function of the applied magnetic field H measured at 2 K (black squares) and 300 K (red circles). The inset of (d) depicts the zoom-in of the M–H curves at low fields. | ||
Fig. 2b shows the XRD pattern of the iron oxide NPs. It indicates a cubic spinel structure, which may be indexed to either magnetite or maghemite. The blue, red and green line spectra in Fig. 2b depict the calculated patterns of magnetite (Fe3O4, JCPDS 19-629), maghemite (γ-Fe2O3, JCPDS 39-1346) and hematite (α-Fe2O3, JCPDS 86-0550), respectively. The calculated patterns of magnetite and maghemite are very similar because both phases possess the same spinel structure and almost identical lattice parameters. These two phases are difficult to be differentiated by XRD only. No clear evidence of hematite in the sample has been observed. The lattice constant calculated from the measured XRD pattern is 8.383 Å, which lies between the lattice constants of magnetite (8.396 Å) and maghemite (8.352 Å). A similar lattice constant has been found in the iron oxide nanoparticles which contain mainly magnetite and are partially oxidized at the surface.46,47 It can also be seen that the effect of oleic acid on the crystal structure of the core–shell iron oxide NPs is negligible.48
Fig. 2c presents the temperature dependence of the ZFC and FC magnetization M measured under an applied field of 50 Oe. Both ZFC and FC magnetization curves show their maximum at about 286.3 K, which is conventionally considered as the so-called blocking temperature TB associated with superparamagnetic NPs. At TB, the thermal energy is comparable to the anisotropy energy barrier for flipping the magnetization of the NPs.49,50 However, in contradiction to the typical superparamagnetic behavior, there are seemingly two humps at around the magnetic irreversibility temperature (Tirr = 241 K) and the blocking temperature TB on the broad peak in the ZFC curve. There is a drop in both ZFC and FC magnetization below TB. Here we give two possible explanations for this strange observation. First, it may originate from the large-size particles/aggregates and/or strong interparticle interactions. While smaller NPs are blocked below Tirr, large particles/aggregates remain blocked up to TB or even higher temperatures because of their higher barrier energies,51–53 leading to a local maximum in magnetization at TB accordingly. Second, the nearly identical drop in ZFC and FC curves below TB can be explained by the presence of an antiferromagnetic transition.54 This small drop in magnetization is very likely to be related to the Morin transition in hematite at around TM = 260 K. The magnetic structure of hematite is weakly ferromagnetic above TM and antiferromagnetic with no net magnetic moment below TM. Although the XRD result shows no clear evidence of hematite, there might be a little amount of hematite in the sample for magnetization experiment because the dried sample was first measured with XRD and could be oxidized to hematite during the storage before being used in SQUID measurements. Another feature deviating from the ideal superparamagnetic picture is that the FC magnetization shows a declination as the temperature decreases. This behavior is usually associated with the collective freezing process of strongly interacting particle moments and has been attributed to the dipolar interactions between NPs as in the case of a superspin-glass system.50,55–57 We also notice that there is no indication of Verwey transition in the magnetization curves. The Verwey transition is a crystal structure phase transition expected for magnetite at around 120 K and is seen in perfect iron–oxygen stoichiometry.58 The oxidation and broken bonds on the surface of iron oxide NPs could make the NPs sufficiently non-stoichiometric and thus the Verwey transition cannot be observed. Therefore the absence of Verwey transition suggests that the iron oxide sample may contain either no magnetite or just a small fraction not enough to show the Verwey transition. Since the iron–oxygen stoichiometry of iron oxide NPs is not the focus of this paper, the distinction between magnetite and maghemite will not be addressed further at this point.
As shown in Fig. 2d, the magnetization of iron oxide NPs is plotted as a function of the applied magnetic field (−70000 Oe < H < 70000 Oe) at 2 and 300 K. The maximum magnetization recorded at 300 K is 56.6 emu g−1, which is not saturated even under 70000 Oe and is lower than the saturated magnetization of bulk magnetite (92 emu g−1) and maghemite (74 emu g−1).59 We attribute this phenomenon to the glassy spins on the surfaces of NPs owing to the broken bonds of superficial iron ions and the high surface/volume ratio of the NPs.
Using the SANSpol technique, we have investigated both the core–shell microstructure and the field-induced long-range ordered self-assembly of iron oxide NPs. In a typical SANSpol measurement on KWS-1, the incident neutrons are aligned to be either parallel (−) or antiparallel (+) to the applied field at the sample position. The scattering intensity I(Q) of the sample is the square of the total amplitude and dependent on the polarization state of the incident neutrons. For a dilute system of non-correlated magnetic particles, the scattering intensities as a function of Q are given for the two polarization states by60
| I+(Q,α) = FN2 + {FM2 − 2PFNFM}sin2α, | (1) |
| I−(Q,α) = FN2 + {FM2 + 2PFNFM}sin2α, | (2) |
| I−(Q,α) − I+(Q,α) = 4PFNFMsin2α, | (3) |
 | (4) |
The form factor of a single NP is defined as61
 | (5) |
| Fc–sh(Q) = Vc(ηc − ηsh)fsph(QR) + Vnp(ηsh − ηsol)fsph(Q(R + D)), | (6) |
cos(x)]/x3, Vc and Vnp are the volume of the core and the total nanoparticles, ηc and ηsh are the SLD of the core and the shell, respectively.
In order to study the microstructure of the iron oxide NPs through the particle form factor, the as-prepared iron oxide NP solution was further diluted to 0.05 vol%. SANSpol measurement was performed on KWS-1 with a small field of 50 Gauss applied at the sample position to keep the neutron polarization. The radially averaged SANS intensities, I+(Q) and I−(Q), are plotted in Fig. 3. The applied field is too weak to align the magnetic moments of the NPs in a particular direction. Thus the magnetic scattering contributes in all azimuthal angles. As shown in Fig. 3, I+(Q) and I−(Q) nearly coincide with each other, indicating that the magnetic contribution to the total scattering intensity is very small. If the magnetic NPs with a magnetic core and a hydrogenated (H−) surfactant shell are sufficiently diluted in H-solvents, the magnetic scattering contribution to SANS intensity can be neglected.61 Hence we use the core–shell model given in eqn (6) to fit directly the I+(Q) and I−(Q) curves, which are assumed to contain no structure factors and magnetic contributions. Not knowing the composition of the iron oxide cores in terms of the magnetite/maghemite ratio, we take the theoretical SLD of maghemite (SLDγ-Fe2O3 = 6.7 × 10⁻⁶ Å−2) as the SLD of the core because the XRD and bulk magnetic property measurements suggest that the cores are mainly composed of maghemite. Furthermore the SLD of magnetite (SLDFe3O4 = 6.9 × 10⁻⁶ Å−2) is very close to the one of maghemite. Theoretical values for the SLDs of oleic acid and toluene are also adopted in the fit. The best fit is shown as the red curve in Fig. 3. The radius of the core and the thickness of the shell determined from the fit are 8.5(1) nm and 1.5(1) nm, respectively. The surfactant shell thickness is close to the length of an oleic acid molecule, suggesting that the iron oxide cores are covered by a monolayer of oleic acid. The average diameter of the iron oxide cores determined by SANS is then 17.0 nm with a size distribution of 5%, which is in perfect agreement with the TEM result. Based on these fitting results, the nuclear SLD profile is depicted in the inset of Fig. 3, where the theoretical SLDs of the core, the shell and the solvent are plotted as a function of the distance from the centre of an iron oxide NP.
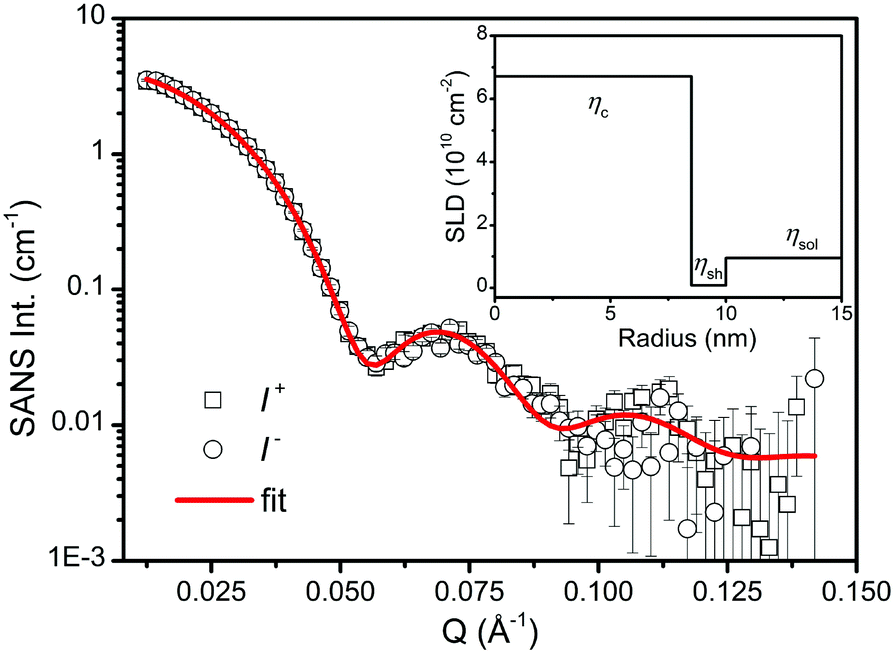 | ||
| Fig. 3 SANSpol intensities for diluted iron oxide NP suspension in toluene. The intensities, I− (circles) and I+ (squares), are measured with flipper-on and flipper-off protocols on KWS-1 at MLZ, respectively. The red line represents the best fit using a core–shell model as described in the text. The inset is the profile of theoretical nuclear SLDs of the core, the shell and the solvent plotted as a function of the distance from the centre of an iron oxide NP. | ||
The as-prepared iron oxide NP solution was exposed to a vertical magnetic field generated by an electromagnet to study the field-induced self-assembly of the iron oxide NPs. The SANS patterns were collected on KWS-1 at various fields ranging from 0.005 T to 2.2 T and are shown in Fig. 4. The square-shaped gaps in the SANS patterns are due to the shade of the beam stop. The SANS pattern is isotropic at 0.005 T, showing no indication for the presence of locally ordered structures (see also Fig. 6a). When the magnetic field is increased to 0.1 T, clear Bragg peaks appear in Fig. 4b, revealing the formation of a single-crystalline-like superstructure. Upon further increasing the magnetic field above 0.1 T (see Fig. 4c–f), more particles are aligned due to the stronger dipole–dipole attraction induced by the increasing magnetic field. The crystallinity of the iron oxide NP assembly seems improved as indicated by the clearer high-order diffraction spots, allowing a reliable inspection of the crystal structure.
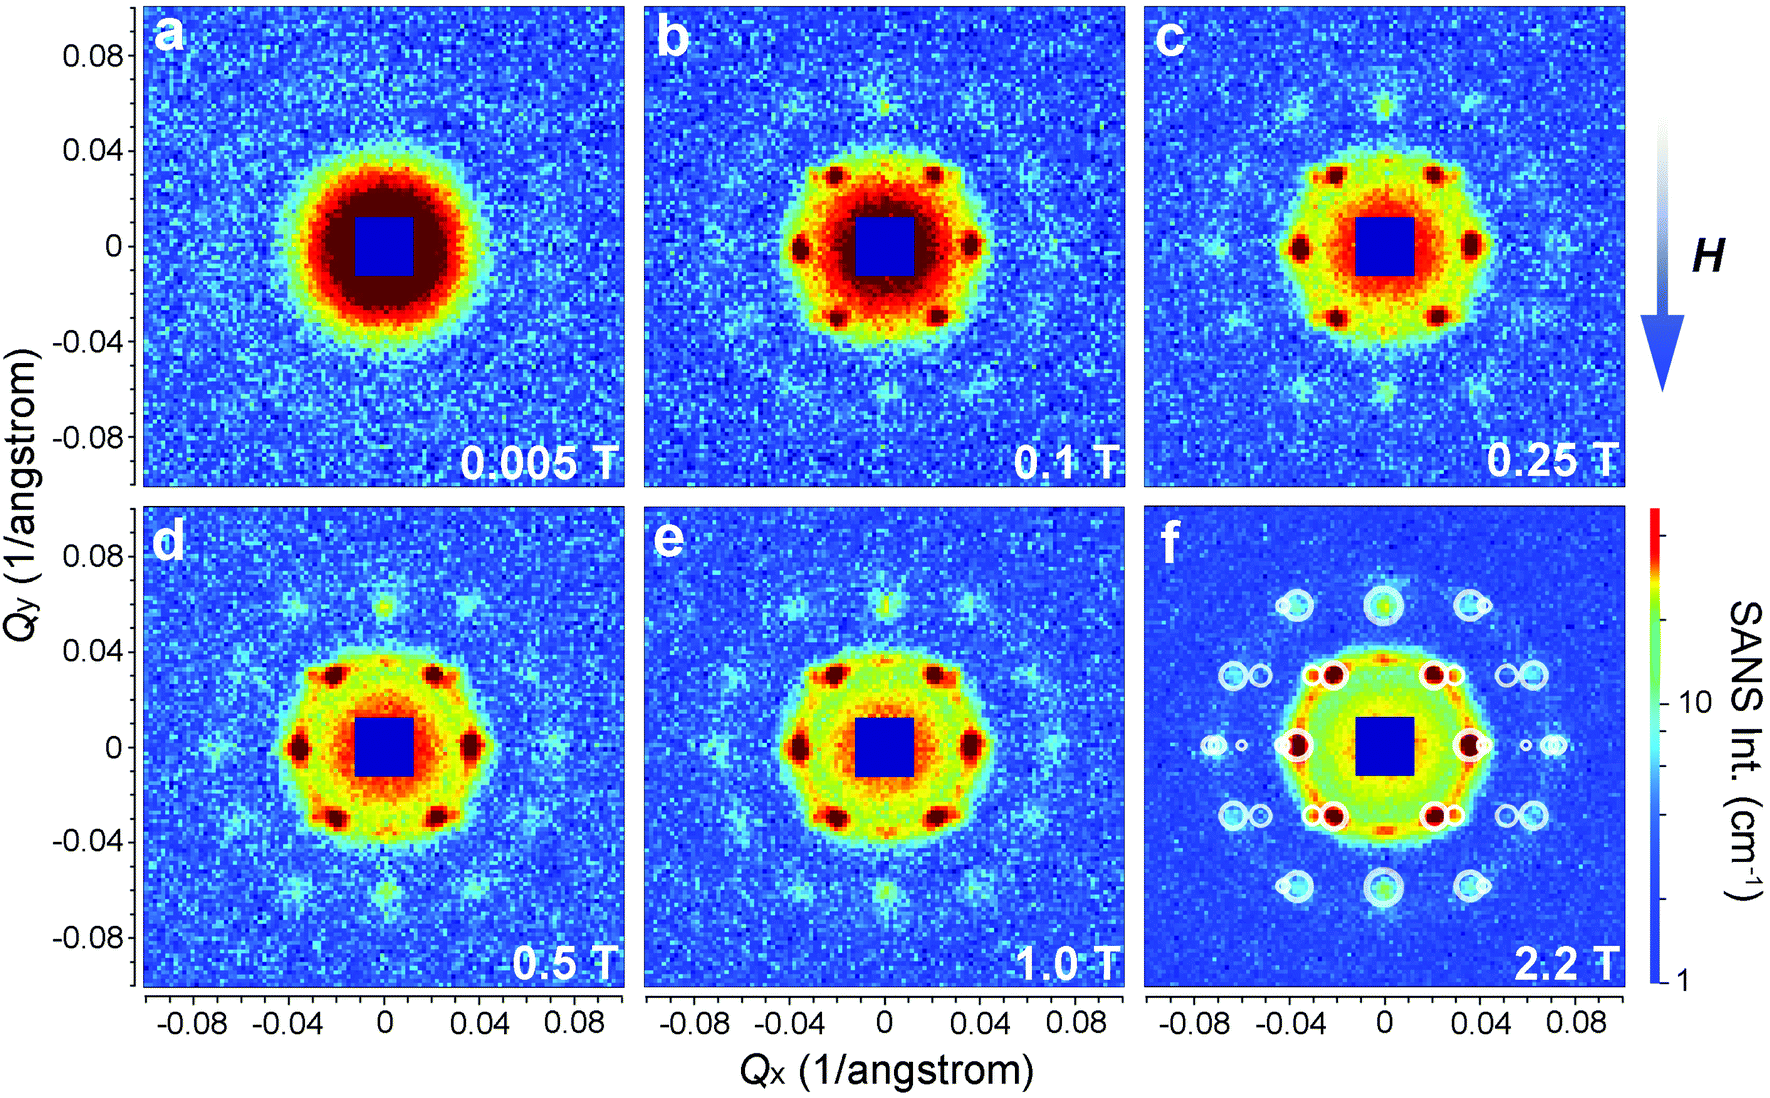 | ||
| Fig. 4 SANS patterns of iron oxide NP solution exposed to external magnetic fields of 0.005 T (a), 0.1 T (b), 0.25 T (c), 0.5 T (d), 1 T (e), and 2.2 T (f). The vertical magnetic field was aligned perpendicular to the incident neutron beam. The colour bar at the bottom right defines the scale for absolute SANS intensity in unit of cm−1. In (f), the calculated reflections for face-centred cubic structure are shown as write circles and superimposed over the scattering pattern for comparison. | ||
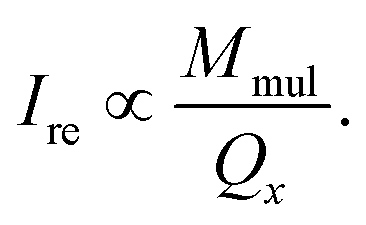
As shown in Fig. 5, when a small magnetic field is applied, the colloidal magnetic particles tend to initially assemble into 1D chains if the dipolar interaction energy is large enough to overcome thermal fluctuations.3 If the particle concentration and the interparticle magnetic dipole–dipole interaction are further increased, 3D crystalline superstructures of magnetic particles can form. Note that the nearest interparticle distance should be found along the field direction due to the strong dipole–dipole attraction. This means for a certain Bravais lattice the magnetic field defines a special crystallographic direction, along which the nearest neighbors locate. As long as this special crystallographic direction is kept along the field direction, the orientation of crystals is random. As a result, the diffraction intensity is distributed over circles in the reciprocal space, rather than on Bragg spots as in the case of a single crystal. Bragg reflections are observed at the intersections of the reciprocal circles and the Ewald sphere surface. In our SANS experiments, we detect only the reflections with the scattering vector Q = (Qx, Qy, 0). Since Qy is in the field direction, the diffraction intensity of each reflection is evenly spread over a circle rotating around the Qy axis with a radius of Qx. Therefore the measured intensity of an observable reflection should be proportional to the multiplicity Mmul of the reflection, but inversely proportional to Qx. The relative intensity of a reflection can then be given by33
 | (7) |
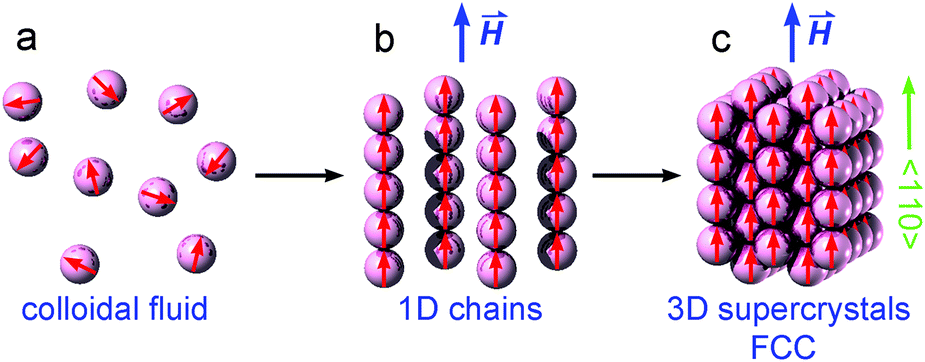 | ||
| Fig. 5 Schematic illustration of magnetic-field-induced phase transitions between colloidal magnetic fluid, 1D chains and 3D face-centred-cubic (FCC) supercrystals of magnetic nanoparticles. | ||
In Fig. 6a we plot the radially averaged SANS intensity as a function of Q for various external magnetic fields. As evidenced by the appearance of Bragg peaks, long-range ordered self-assembly of iron oxide NPs was detected in magnetic fields above 0.1 T. The diffraction peak positions represent a Q ratio of 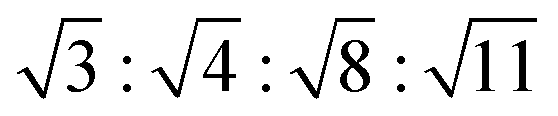 , corresponding to the (111), (200), (220) and (311) lattice planes of a FCC structure with a lattice constant of a = 29.4 nm. The peak position of (200) planes is extracted from the diffraction pattern in Fig. 4f, because this reflection is hindered by the strong (111) reflection in Fig. 6a. The magnetic field direction defines the [011] crystallographic direction, along which the nearest neighbors in the FCC structure are observed. The distance between the nearest iron oxide NPs can be estimated at 20.8 nm, almost equivalent to the centre distance between two touching NPs. The broadening of the diffraction peaks is ascribed to the limited crystallite size of the particle assembly. The average crystallite size L is estimated by analysing the line width (full width at half maximum, FWHM) of the (111) reflection in terms of the Scherrer's formula. The FWHM of the (111) reflection is determined by the fit with the Gaussian function. The (200) reflection is not considered in the fit since the intensity of the (200) reflection is about ten times lower than that of the (111) reflection. The average crystallite size L is plotted as a function of the magnetic field H in the inset of Fig. 6a. Although L shows a continuous increase when H increases from 0.1 to 2.2 T, the change of L is relatively small because its value changes only from 4 to 5 times the average diameter of the iron oxide NPs. Note that the average crystallite size estimated here marks the lower bound on the average crystallite size in the NP supercrystal, because besides the limited size effect a variety of other factors can contribute to the broadening the diffraction peaks.63 In Fig. 6b, the SANS intensity is integrated in the Q range of 0.0313–0.0417 Å−1 and plotted as a function of the azimuthal angle between the external field direction and Q. The diffraction peaks are enhanced with the increasing magnetic field. The angle distribution of the diffraction peaks quantitatively agrees with that of the (111) reflections of the FCC structure. For example, the angle deviation between the two strong peaks in the middle of Fig. 6b is 71.0°, is consistent with the included angle between the (11
![[1 with combining macron]](https://www.rsc.org/images/entities/char_0031_0304.gif) ) and (1) lattice planes in the FCC structure. The small peaks at 0 and 180° are attributed to the (111) reflections from locally misaligned iron oxide NP clusters. According to eqn (7), the peaks from misaligned NP clusters show their maxima at 0 and 180° due to the vanishing Qx at these two angles.
) and (1) lattice planes in the FCC structure. The small peaks at 0 and 180° are attributed to the (111) reflections from locally misaligned iron oxide NP clusters. According to eqn (7), the peaks from misaligned NP clusters show their maxima at 0 and 180° due to the vanishing Qx at these two angles.
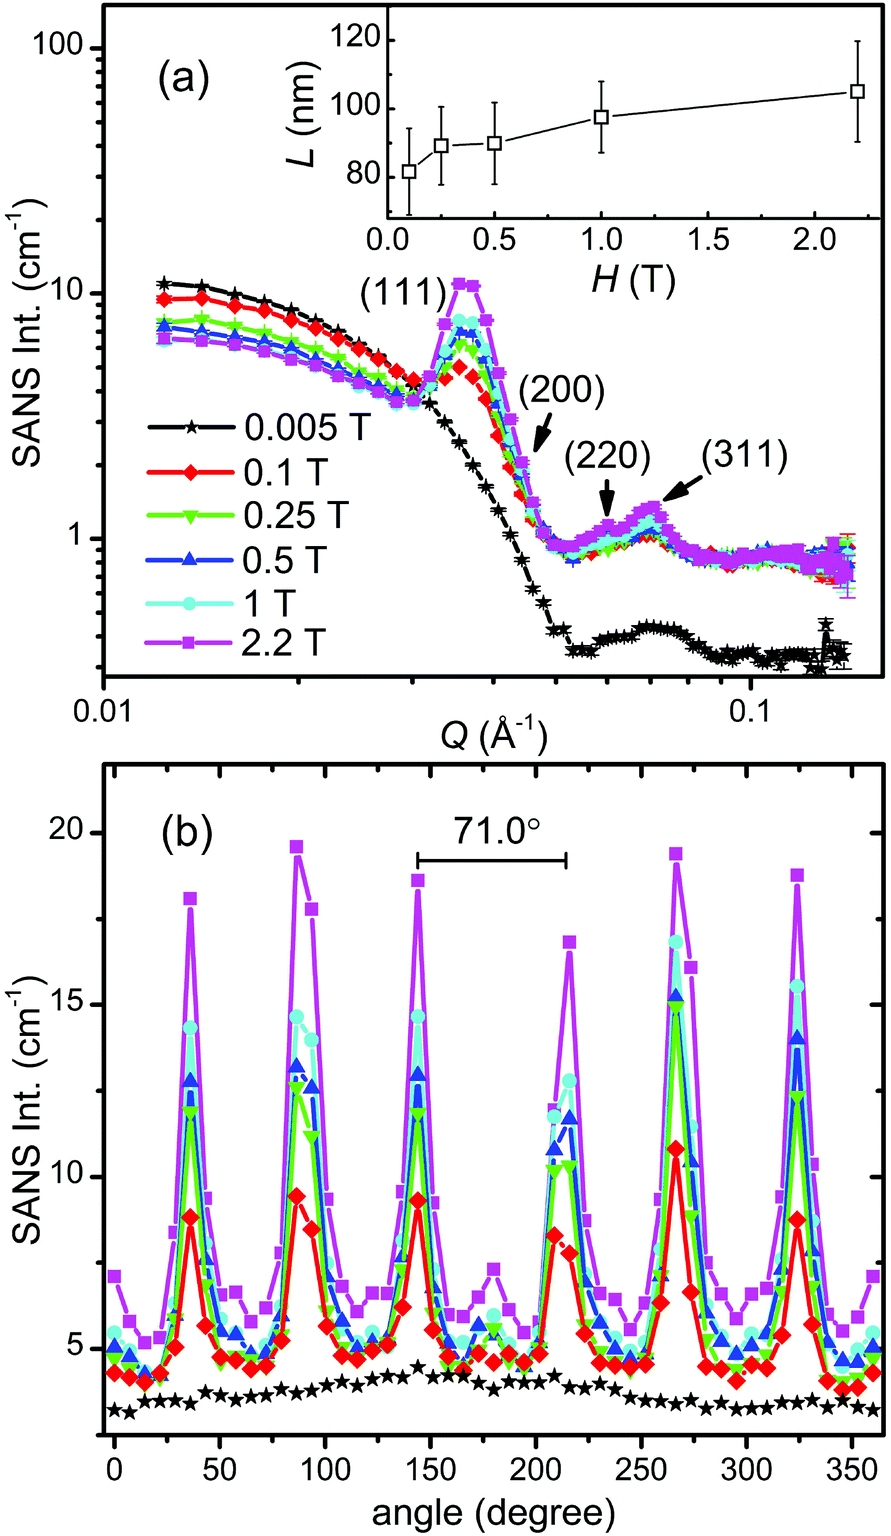 | ||
| Fig. 6 (a) Radially averaged SANS intensities as a function of Q in various magnetic fields. The inset of (a) shows the field dependence of the average crystallite size L estimated from the (111) reflection. (b) Field-dependent SANS intensities integrated over 0.0313 Å−1 < Q < 0.0417 Å−1 are plotted as a function of the azimuthal angle between the external field direction and Q. | ||
Therefore we have calculated the diffraction pattern (white circles in Fig. 4f) from a FCC structure and compare it with the measured SANS pattern in Fig. 4f. The lattice constant is set as 29.4 nm. As discussed above, an averaging for the crystal orientation has been done in the calculation, while the [011] crystallographic direction is fixed along Qy by the external field. The radius of the calculated circles is proportional to the square root of the reflection intensity estimated with eqn (7). An arbitrarily large size has been given to the calculated data with Qx = 0 due to the limited instrumental parameters and crystal disorder.33 As can be seen in Fig. 4f, the calculated diffraction pattern agrees well with the measured SANS pattern. Note that here we have considered only the structure factor of the iron oxide NP superlattice. Our SANS investigations clearly show that the field-induced iron oxide NP self-assembly has a FCC type of structure.
SANSpol measurements were performed on the iron oxide NP self-assemblies at 2.2 T in order to separate the weak magnetic scattering from the nuclear one. Fig. 7a and b show the 2D SANS intensities, I−(Qx, Qy) and I+(Qx, Qy), measured with two neutron polarization states parallel and antiparallel to the external field direction, respectively. Both I+ and I− show the same clear diffraction peaks as shown in Fig. 4. In addition to the diffraction peaks, pronounced anisotropy can be seen in the low Q range in both I+ and I−, indicative of the presence of magnetic contribution. Fig. 7c depicts the averaged signal (I+ + I−)/2, which actually corresponds to the SANS pattern measured with unpolarized neutrons. The difference signal (I− − I+) is plotted in Fig. 7d. As explained in eqn (3), (I− − I+) represents the nuclear-magnetic cross term, which shows a clear sin2α behaviour with an elongation perpendicular to the field direction. The magnetic scattering intensity along the field direction is negligible, because the moments of the iron oxide NPs are aligned parallel to the external field.
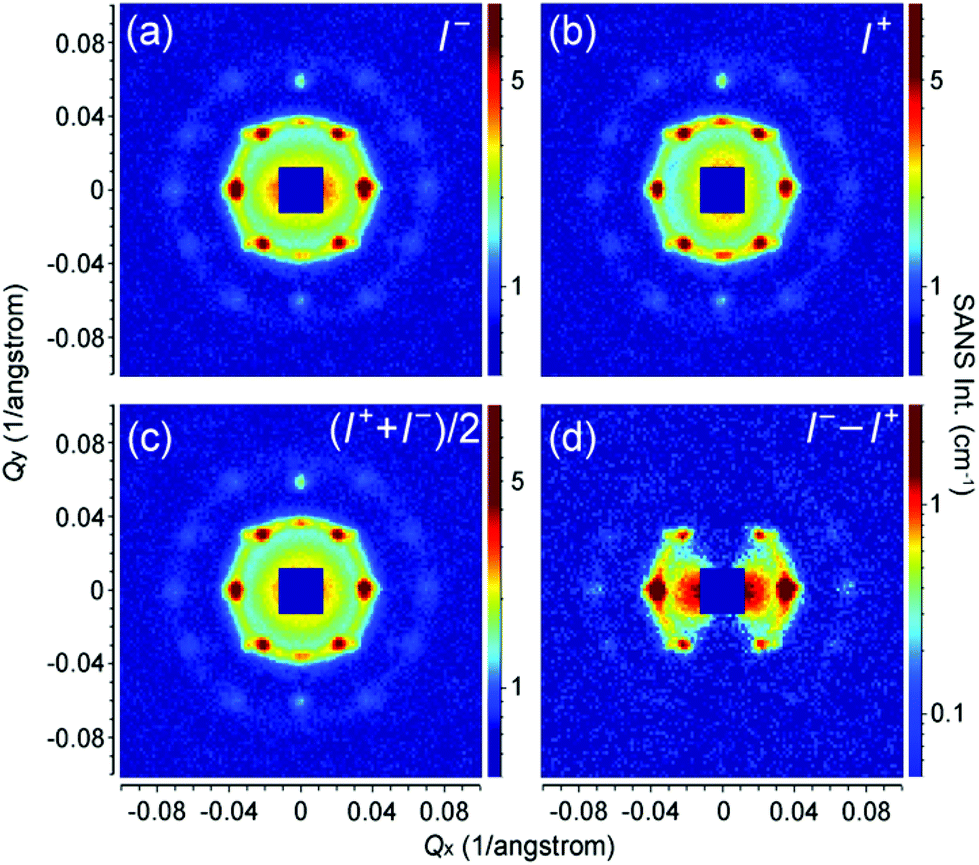 | ||
| Fig. 7 SANSpol patterns collected from self-assembled iron oxide NPs in a vertical field of 2.2 T. The neutron polarization direction is either parallel (a) or antiparallel (b) to the external field direction. (c) The averaged signal (I+ + I−)/2, which corresponds to the SANS pattern measured with unpolarized neutrons. (d) The difference signal (I− − I+), reflecting the nuclear-magnetic cross term with a clear sin2α behaviour. | ||
The SANSpol intensities I+ and I− are integrated over azimuth sectors of 14° in width and plotted as a function of Q in Fig. 8. We choose four azimuth sectors, whose centres are at α = 0°, 35°, 60° and 90°, where α is the angle between Q and the external field direction. In the 0° sector (Fig. 8a), I+ and I− coincide with each other, because the SANS intensity is of nearly pure nuclear origin and thus independent on the neutron polarization. The peak at around Q = 0.036 Å−1 exists in both 0° and 60° sectors, and shares the same position with the (111) reflections. This is attributed to the Debye–Scherrer ring corresponding to the (111) reflections from locally misaligned iron oxide NP clusters. This peak is more pronounced in the α = 0° sector than in the α = 60° sector. This can be understood in terms of eqn (7), which indicates that the Debye–Scherrer ring due to locally misaligned clusters is more intense in the α = 0° sector because Qx = 0. Therefore the separation of nuclear and magnetic contribution is not successful because the nuclear contribution extracted at the α = 0° (or 180°) sector is different from that at α ≠ 0° (or 180°) sectors. An unambiguous separation of nuclear and magnetic scattering contribution will be performed by means of SANS polarization analysis in the future. The deviation between I+ and I− increases with increasing α, as a direct result of the sin2α behaviour of the nuclear-magnetic cross term. Within the resolution of our SANSpol measurements, we do not see a shift of the (111) peaks or other reflections with respect to α. Therefore no structure distortion has been detected, although distorted symmetry often occurs in the field-assisted self-assembly of core–shell magnetic NPs.33,37
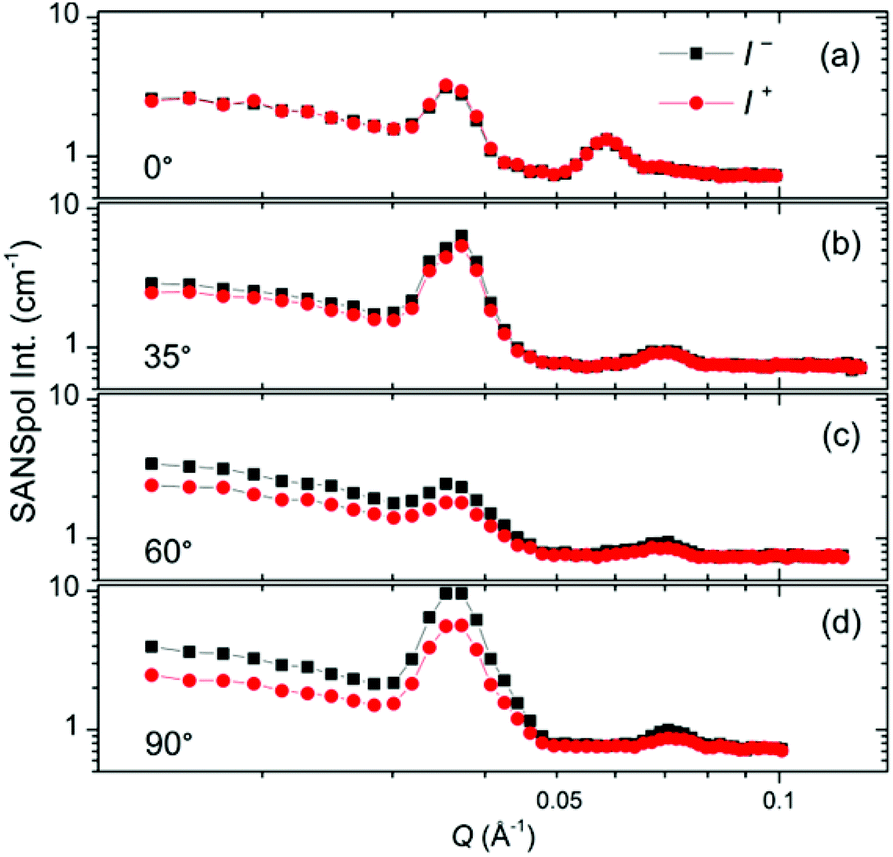 | ||
| Fig. 8 SANSpol intensities I+ (red circles) and I− (black squares) integrated over azimuth sectors of 14° in width. The sector centres are at α = 0° (a), 35° (b), 60° (c) and 90° (d), where α is the angle between the scattering vector Q and the applied magnetic field direction. | ||
The self-assembly process of the iron oxide NPs in magnetic fields has been explored by using VSANS with unpolarized neutrons on KWS-3. The experimental setup has been illustrated in Fig. 1. As shown in Fig. 9, the VSANS intensity is integrated over azimuth sectors of 20° in width and plotted as a function of Q. The integrated intensities in two sectors centering at 90° (horizontal) and 0° (vertical) are shown in Fig. 9a and b, respectively. The field dependence of the forward scattering intensity I(0) is plotted in the inset of Fig. 9b. In the 0° sector, the scattering intensity consists of both nuclear and magnetic contributions at low fields, but only nuclear contribution at high fields. However, the SANS intensity nearly shows no field dependence as seen from the scattering patterns and the I(0) vs. H plot in Fig. 9b, indicating that the magnetic contribution is negligible within the Q range of KWS-3. As shown in Fig. 9a and the inset of Fig. 9b, the low-Q scattering intensity in the 90° sector increases as the field increases from 0.001 to 0.02 T, and then remains almost constant in the field range of 0.03–1.5 T, and finally increases sharply with the field up to 2.2 T. For Q < 0.002 Å−1, the SANS profiles measured in fields above 0.02 T are dominated by a strong increase of the scattering intensity towards Q = 0, revealing important facts concerning the aggregation behavior of the iron oxide NPs. The further data analysis shows that the low-Q scattering profiles follow a Porod-law behavior, I(Q) ∝ Q−4, indicative of the presence of large-scale aggregates whose radiuses of gyration Rg are at least larger than the inverse of the minimum accessible Q value,64i.e., Rg > 170 nm. Therefore it is confirmed by means of VSANS measurements that large aggregate clusters have already formed at 0.02 T due to the strong dipole–dipole interaction enhanced by the alignment of the dipoles of magnetic NPs in an external magnetic field. It is reasonable that the average crystallite size as shown in the inset of Fig. 6a remains smaller than the size of aggregates.
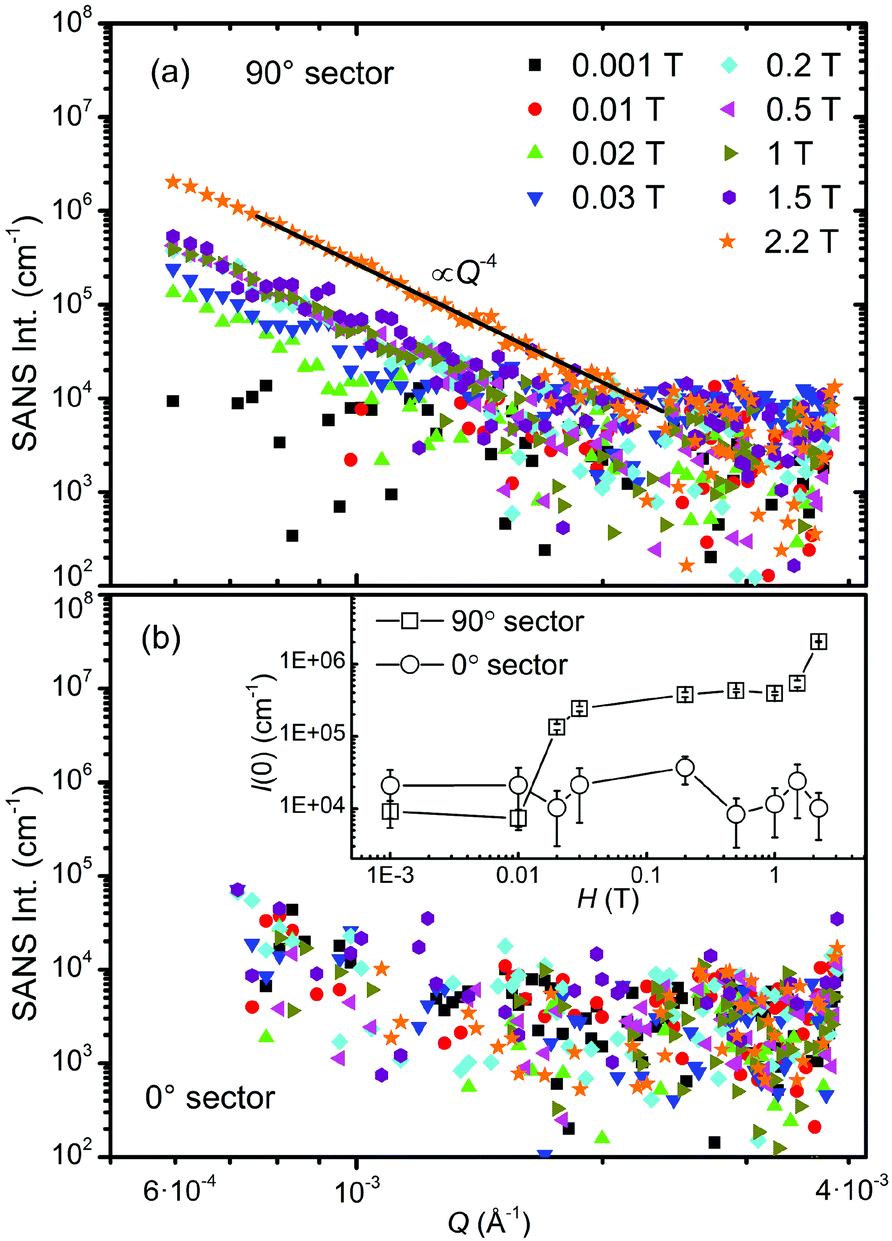 | ||
| Fig. 9 VSANS intensities integrated over azimuth sectors of 20° in width measured at various fields. The sector centres are at α = 90° (a) and 0° (b), with α being the angle between the scattering vector Q and the applied magnetic field direction. The solid black line in (a) corresponds to a Porod-law behavior, I(Q) ∝ Q−4. The inset of (b) shows the field dependence of the forward scattering intensity I(0) in 0° and 90° sectors. | ||
Fundamentally the self-assembly process of magnetic NPs is governed by different inter-particle forces, such as the attractive magnetic dipole–dipole interaction and van der Waals force, and the repulsive electrostatic or steric interactions originating from the surfactants coated on the surface of NPs.65 When no magnetic field is applied, Brownian motion randomly orients the magnetic NPs as shown in Fig. 5a. The electrostatic or steric forces provide enough repulsion against the attractive van der Waals force to keep the NPs from aggregation. Upon the application of a uniform external magnetic field, the moments of NPs are preferentially aligned. If the field-induced dipolar interaction is sufficiently strong to overcome the repulsive forces and the thermal energy, the colloidal magnetic NPs prefer to align in a chain-like end-to-end configuration as illustrated in Fig. 5b, where the dipoles strongly attract each other. However the aligned chains of magnetic NPs are repulsive in a side-by-side configuration if they are magnetized in the same direction. Under appropriate conditions of the magnetic NP concentration and the strength of the external magnetic field, the separated NP chains can assemble into ordered arrays as shown in Fig. 5c.6 Although the strong magnetic dipole–dipole interaction is required in the field-induced self-assembly process of magnetic NPs, the stability of the resultant superstructure depends on the equilibrium between the attractive and repulsive forces. For example, hexagonal superstructures have been proved to be stabilized when the dipolar forces are less dominating.66 The magnetic dipole–dipole forces in our iron oxide NPs have been reduced by the oleic acid coating and the disordered spins on the surface of the magnetic cores. Being directed by an external magnetic field with a sufficient magnitude, the magnetic NPs in our sample organized into 3D superstructures which were not stable after the magnetic field was removed. This indicates that the reduced dipolar interactions established at the investigated magnetic fields are not strong enough to maintain the large supercrystal structure. But small fragments of ordered NP arrays should still exist. Detailed SANS and TEM study will be carried out in the future to reveal whether the field-induced self-assembly process is reversible in our samples. The magnetic NPs displayed a fast response to the change of the applied magnetic field, and the assembly process was completed very fast since we did not see the SANS patterns changing once the field strength was fixed, and is consistent with the theoretical predictions.67 As seen in Fig. 4, the scattering intensity due to the locally misaligned clusters cannot be suppressed by enhancing the field. It indicates that there are mosaic-like clusters, which are orientationally misaligned during the initial stage of the assembly process and are blocked later on even in much higher magnetic fields. Such misaligned clusters can be attributed to the imperfect spherical shapes and the size distribution of the iron oxide NPs, as well as the branching of magnetic NP chains arising from the misaligned magnetic dipole moments.6 Besides the repulsive interactions and the thermal energy, the misaligned clusters could be another source of instability in the field-induced self-assembly of magnetic NPs.
4. Conclusions
In conclusion, we have investigated the field-induced self-assembly of core–shell iron oxide NPs dispersed in toluene by means of SANS and VSANS. The form factor of the individual core–shell NP has been measured and analysed. After applying an external magnetic field above 0.1 T, the SANS patterns show that the long-range ordered self-assembly of iron oxide NPs is formed. The crystal structure of the NP superlattice has been identified as the face-centred cubic. The VSANS measurements suggest that large-scale aggregates have already appeared at 0.02 T. Our experimental findings shed light on the creation of field-induced self-assembly of colloidal magnetic core–shell nanoparticles into 3D supercrystals, which holds potential for the fabrication of functional nanostructures with novel applications. This work also highlights the superiority of the SANS technique in studying self-assembly phenomena in solution.Acknowledgements
We acknowledge Armin Kriele, Helmholtz-Zentrum Geesthacht (HZG), for the help in the usage of the Materials Science Laboratory of Heinz Maier-Leibnitz Centre (MLZ), Technische Universität München (TUM). We also thank Dr Oleg Petracic and Dr Anatoliy Senyshyn for helpful discussions.References
- F. X. Redl, K.-S. Cho, C. B. Murray and S. O'Brien, Nature, 2003, 423, 968–971 CrossRef CAS PubMed.
- S. Sun and C. B. Murray, J. Appl. Phys., 1999, 85, 4325–4330 CrossRef CAS.
- M. Wang, L. He and Y. Yin, Mater. Today, 2013, 16, 110–116 CrossRef CAS.
- G. A. Ozin, K. Hou, B. V. Lotsch, L. Cademartiri, D. P. Puzzo, F. Scotognella, A. Ghadimi and J. Thomson, Mater. Today, 2009, 12, 12–23 CrossRef CAS.
- E. V. Shevchenko, D. V. Talapin, N. A. Kotov, S. O'Brien and C. B. Murray, Nature, 2006, 439, 55–59 CrossRef CAS PubMed.
- J. B. Tracy and T. M. Crawford, MRS Bull., 2013, 38, 915–920 CrossRef.
- M. Grzelczak, J. Vermant, E. M. Furst and L. M. Liz-Marzán, ACS Nano, 2010, 4, 3591–3605 CrossRef CAS PubMed.
- Z. Nie, A. Petukhova and E. Kumacheva, Nat. Nanotechnol., 2010, 5, 15–25 CrossRef CAS PubMed.
- S. C. Glotzer and M. J. Solomon, Nat. Mater., 2007, 6, 557–562 CrossRef PubMed.
- K. J. M. Bishop, C. E. Wilmer, S. Soh and B. A. Grzybowski, Small, 2009, 5, 1600–1630 CrossRef CAS PubMed.
- L. He, M. Wang, J. Ge and Y. Yin, Acc. Chem. Res., 2012, 45, 1431–1440 CrossRef CAS PubMed.
- J. Ge, L. He, J. Goebl and Y. Yin, J. Am. Chem. Soc., 2009, 131, 3484–3486 CrossRef CAS PubMed.
- J. Ge, Y. Hu and Y. Yin, Angew. Chem., Int. Ed., 2007, 46, 7428–7431 CrossRef CAS PubMed.
- M. Chornya, I. Fishbeina, B. B. Yellenb, I. S. Alferieva, M. Bakaya, S. Gantac, R. Adamoa, M. Amijic, G. Friedmand and R. J. Levya, Proc. Natl. Acad. Sci. U. S. A., 2010, 107, 8346–8351 CrossRef PubMed.
- Z. G. Forbes, B. B. Yellen, K. A. Barbee and G. Friedman, IEEE Trans. Magn., 2003, 39, 3372–3377 CrossRef CAS.
- J.-H. Lee, K.-J. Chen, S.-H. Noh, M. A. Garcia, H. Wang, W.-Y. Lin, H. Jeong, B. J. Kong, D. B. Stout, J. Cheon and H.-R. Tseng, Angew. Chem., Int. Ed., 2013, 52, 4384–4388 CrossRef CAS PubMed.
- C. Plank, O. Zelphati and O. Mykhaylyk, Adv. Drug Delivery Rev., 2011, 63, 1300–1331 CrossRef CAS PubMed.
- J. Dobson, Gene Ther., 2006, 13, 283–287 CrossRef CAS PubMed.
- B. B. Yellen, O. Hovorka and G. Friedman, Proc. Natl. Acad. Sci. U. S. A., 2005, 102, 8860–8864 CrossRef CAS PubMed.
- K. H. Li and B. B. Yellen, Appl. Phys. Lett., 2010, 97, 083105 CrossRef.
- Y. Yang, L. Gao, G. P. Lopez and B. B. Yellen, ACS Nano, 2013, 7, 2705–2716 CrossRef CAS PubMed.
- S. H. Lee, S.-H. Yu, J. E. Lee, A. Jin, D. J. Lee, N. Lee, H. Jo, K. Shin, T.-Y. Ahn, Y.-W. Kim, H. Choe, Y.-E. Sung and T. Hyeon, Nano Lett., 2013, 13, 4249–4256 CrossRef CAS PubMed.
- G. Zhu, Y. Liu, Z. Xu, T. Jiang, C. Zhang, X. Li and G. Qi, ChemPhysChem, 2010, 11, 2432–2437 CrossRef CAS PubMed.
- T. Yoon, J. Kim, J. Kim and J. K. Lee, Energies, 2013, 6, 4830–4840 CrossRef CAS.
- K. A. Mirica, S. T. Phillips, C. R. Mace and G. M. Whitesides, J. Agric. Food Chem., 2010, 58, 6565–6569 CrossRef CAS PubMed.
- N. D. Shapiro, K. A. Mirica, S. Soh, S. T. Phillips, O. Taran, C. R. Mace, S. S. Shevkoplyas and G. M. Whitesides, J. Am. Chem. Soc., 2012, 134, 5637–5646 CrossRef CAS PubMed.
- S. J. Koh, Nanoscale Res. Lett., 2007, 2, 519–545 CrossRef CAS PubMed.
- J. Park, K. An, Y. Hwang, J.-G. Park, H.-J. Noh, J.-Y. Kim, J.-H. Park, N.-M. Hwang and T. Hyeon, Nat. Mater., 2004, 3, 891–895 CrossRef CAS PubMed.
- Q. Song and Z. J. Zhang, J. Am. Chem. Soc., 2004, 126, 6164–6168 CrossRef CAS PubMed.
- K. Yamamoto, C. R. Hogg, S. Yamamuro, T. Hirayama and S. A. Majetich, Appl. Phys. Lett., 2011, 98, 072509 CrossRef.
- L. Li, Y. Yang, J. Ding and J. Xue, Chem. Mater., 2010, 22, 3183–3191 CrossRef CAS.
- J.-M. Meijer, D. V. Byelov, L. Rossi, A. Snigirev, I. Snigireva, A. P. Philipse and A. V. Petukhov, Soft Matter, 2013, 9, 10729–10738 RSC.
- A. Pal, V. Malik, L. He, B. H. Erné, Y. Yin, W. K. Kegel and A. V. Petukhov, Angew. Chem., Int. Ed., 2015, 54, 1803–1807 CrossRef CAS PubMed.
- S. Disch, E. Wetterskog, R. P. Hermann, D. Korolkov, P. Busch, P. Boesecke, O. Lyon, U. Vainio, G. Salazar-Alvarez, L. Bergström and T. Brückel, Nanoscale, 2013, 5, 3969–3975 RSC.
- S. Disch, E. Wetterskog, R. P. Hermann, G. Salazar-Alvarez, P. Busch, T. Brückel, L. Bergström and S. Kamali, Nano Lett., 2011, 11, 1651–1656 CrossRef CAS PubMed.
- A. Wiedenmann, M. Kammel, A. Heinemann and U. Keiderling, J. Phys.: Condens. Matter, 2006, 18, S2713–S2736 CrossRef CAS.
- M. Klokkenburg, B. H. Erné, A. Wiedenmann, A. V. Petukhov and A. P. Philipse, Phys. Rev. E: Stat. Phys., Plasmas, Fluids, Relat. Interdiscip. Top., 2007, 75, 051408 CrossRef CAS PubMed.
- W. S. Rasband, ImageJ, U. S. National Institutes of Health, Bethesda, Maryland, USA, http://imagej.nih.gov/ij/, 1997–2012 Search PubMed.
- C. A. Schneider, W. S. Rasband and K. W. Eliceiri, Nat. Methods, 2012, 9, 671–675 CrossRef CAS PubMed.
- M. D. Abramoff, P. J. Magalhaes and S. J. Ram, Biophotonics Int., 2004, 11, 36–42 Search PubMed.
- Heinz Maier-Leibnitz Zentrum, et al. , J. Large-Scale Res. Facil., 2015, 1, A31 CrossRef.
- Heinz Maier-Leibnitz Zentrum, et al. , J. Large-Scale Res. Facil., 2015, 1, A28 CrossRef.
- A. V. Feoktystov, H. Frielinghaus, Z. Di, S. Jaksch, V. Pipich, M.-S. Appavou, E. Babcock, R. Hanslik, R. Engels, G. Kemmerling, H. Kleines, A. Ioffe, D. Richter and T. Brückel, J. Appl. Crystallogr., 2015, 48, 61–70 CrossRef CAS.
- V. Pipich, QtiKWS, http://www.qtikws.de, 2015 Search PubMed.
- M. Klokkenburg, B. H. Erné, J. D. Meeldijk, A. Wiedenmann, A. V. Petukhov, R. P. A. Dullens and A. P. Philipse, Phys. Rev. Lett., 2006, 97, 185702 CrossRef PubMed.
- B. Basly, D. Felder-Flesch, P. Perriat, C. Billotey, J. Taleb, G. Pourroy and S. Begin-Colin, Chem. Commun., 2010, 46, 985–987 RSC.
- H. El Ghandoor, H. M. Zidan, M. M. H. Khalil and M. I. M. Ismail, Int. J. Electrochem. Sci., 2012, 7, 5734–5745 CAS.
- M. Mahdavi, M. B. Ahmad, M. J. Haron, F. Namvar, B. Nadi, M. Z. A. Rahman and J. Amin, Molecules, 2013, 18, 7533–7548 CrossRef CAS PubMed.
- O. Petracic, Superlattices Microstruct., 2010, 47, 569–578 CrossRef CAS.
- S. Bedanta, O. Petracic and W. Kleemann, in Handbook of Magnetic Materials, ed. K. H. J. Buschow, Elsevier, Amsterdam, 1st edn, 2015, ch. 1, pp. 29–37 Search PubMed.
- J. Dormann, D. Fiorani and E. Tronc, Adv. Chem. Phys., 1997, 98, 283 CrossRef CAS.
- Z. Nie, A. Petukhova and E. Kumacheva, Nat. Nanotechnol., 2009, 5, 15 CrossRef PubMed.
- W. Baaziz, B. P. Pichon, S. Fleutot, Y. Liu, C. Lefevre, J.-M. Greneche, M. Toumi, T. Mhiri and S. Begin-Colin, J. Phys. Chem. C, 2014, 118, 3795 CAS.
- M. J. Benitez, O. Petracic, E. L. Salabas, F. Radu, H. Tüysüz, F. Schüth and H. Zabel, Phys. Rev. Lett., 2008, 101, 097206 CrossRef CAS PubMed.
- O. Gerber, B. P. Pichon, C. Ulhaq, J.-M. Greneche, C. Lefevre, I. Florea, O. Ersen, D. Begin, S. Lenonnier, E. Barraud and S. Begin-Colin, J. Phys. Chem. C, 2015, 119, 24665 CAS.
- O. Petracic, X. Chen, S. Bedanta, W. Kleemann, S. Sahoo, S. Cardoso and P. P. Freitas, J. Magn. Magn. Mater., 2006, 300, 192 CrossRef CAS.
- D. Parker, V. Dupuis, F. Ladieu, J. P. Bouchaud, E. Dubois, R. Perzynski and E. Vincent, Phys. Rev. B: Condens. Matter, 2008, 77, 104428 CrossRef.
- R. Aragon, D. J. Buttrey, J. P. Shepherd and J. M. Honig, Phys. Rev. B: Condens. Matter, 1985, 31, 430 CrossRef CAS.
- B. D. Cullity, Introduction to Magnetic Materials, Addison-Wesley, Reading, MA, 1972 Search PubMed.
- A. Wiedenmann, M. Kammel, A. Heinemann and U. Keiderling, J. Phys.: Condens. Matter, 2006, 18, S2713–S2736 CrossRef CAS.
- M. V. Avdeev, J. Mol. Liq., 2014, 189, 68–73 CrossRef CAS.
- A. Guinier and G. Fournet, Small-Angle Scattering of X-Rays, John Wiley and Sons, New York, 1955 Search PubMed.
- S. A. Howard and K. D. Preston, in Modern Powder Diffraction, ed. D. L. Bish and J. E. Post, Mineralogical Society of America, Chantilly, 1989, ch. 8, pp. 217–276 Search PubMed.
- G. Porod, Kolloidn. Zh., 1951, 124, 83 CAS.
- V. Malik, A. V. Petukhov, L. He, Y. Yin and M. Schmidt, Langmuir, 2012, 28, 14777–14783 CrossRef CAS PubMed.
- K. M. Krishnan, A. B. Pakhomov, Y. Bao, P. Blomqvist, Y. Chun, M. Gonzales, K. Griffin, X. Ji and B. K. Roberts, J. Mater. Sci., 2006, 41, 793 CrossRef CAS.
- X. Xue and E. P. Furlani, J. Phys. Chem. C, 2015, 119, 5714–5726 CAS.
| This journal is © The Royal Society of Chemistry 2016 |