
 Open Access Article
 This Open Access Article is licensed under a
 Creative Commons Attribution 3.0 Unported Licence
Molecular design driving tetraporphyrin self-assembly on graphite: a joint STM, electrochemical and computational study†
M.
El Garah
a,
A.
Santana Bonilla
b,
A.
Ciesielski
a,
A.
Gualandi
c,
L.
Mengozzi
c,
A.
Fiorani
c,
M.
Iurlo
c,
M.
Marcaccio
c,
R.
Gutierrez
b,
S.
Rapino
c,
M.
Calvaresi
c,
F.
Zerbetto
*c,
G.
Cuniberti
*b,
P. G.
Cozzi
*c,
F.
Paolucci
*c and
P.
Samorì
*a
aISIS & iCFRC, Université de Strasbourg & CNRS, 8 Allée Gaspard Monge, 67000 Strasbourg, France. E-mail: Samori@unistra.fr
bInstitute for Materials and Max Bergamann Center of Biomaterials, TU Dresden, 01062 Dresden, Germany. E-mail: g.cuniberti@tu-dresden.de
cDipartimento di Chimica “Giacomo Ciamician”, Via Selmi2, 40126, Bologna, Italy. E-mail: piergiorgio.cozzi@unibo.it; francesco.paolucci@unibo.it; francesco.zerbetto@unibo.it
First published on 13th June 2016
Abstract
Tuning the intermolecular interactions among suitably designed molecules forming highly ordered self-assembled monolayers is a viable approach to control their organization at the supramolecular level. Such a tuning is particularly important when applied to sophisticated molecules combining functional units which possess specific electronic properties, such as electron/energy transfer, in order to develop multifunctional systems. Here we have synthesized two tetraferrocene-porphyrin derivatives that by design can selectively self-assemble at the graphite/liquid interface into either face-on or edge-on monolayer-thick architectures. The former supramolecular arrangement consists of two-dimensional planar networks based on hydrogen bonding among adjacent molecules whereas the latter relies on columnar assembly generated through intermolecular van der Waals interactions. Scanning Tunneling Microscopy (STM) at the solid–liquid interface has been corroborated by cyclic voltammetry measurements and assessed by theoretical calculations to gain multiscale insight into the arrangement of the molecule with respect to the basal plane of the surface. The STM analysis allowed the visualization of these assemblies with a sub-nanometer resolution, and cyclic voltammetry measurements provided direct evidence of the interactions of porphyrin and ferrocene with the graphite surface and offered also insight into the dynamics within the face-on and edge-on assemblies. The experimental findings were supported by theoretical calculations to shed light on the electronic and other physical properties of both assemblies. The capability to engineer the functional nanopatterns through self-assembly of porphyrins containing ferrocene units is a key step toward the bottom-up construction of multifunctional molecular nanostructures and nanodevices.
1. Introduction
Controlling the spatial arrangement of complex functional molecules at surfaces and interfaces with atomic precision is one of the greatest challenges in the bottom-up fabrication of functional architectures. By embracing the supramolecular approach,1–3 which relies on the spontaneous association of suitably designed small molecules into one-, two- and three-dimensional superstructures, this spatial control may be attained via self-assembly of suitably designed molecular building blocks. When spatial confinement in 2D on a solid substrate is employed, this approach makes it possible to generate periodically ordered structures, which can then be characterized on the nanoscale by Scanning Tunneling Microscopy (STM).4–16 Self-assembly at interfaces enables the controlled positioning of functional units with sub-nanometer precision over areas of micrometers and thereby allows the fine-tuning of numerous properties of the resulting nanostructures17–21 for technological applications, in particular, optics, catalysis, electronics and sensing.22,23Porphyrins have been extensively explored as molecular scaffolds because of their unique opto-electronic properties, which make them appealing for numerous applications including solar cells24 and photo-catalysis.25 STM was used to explore the self-assembly of porphyrins under ultra-high vacuum (UHV) on graphite26 and metallic substrates,27–29 and under ambient conditions on graphite supports.30–36 In general, the adsorption of porphyrins can be classified into two distinct molecular configurations, i.e. face-on and edge-on (columnar stacking). Once physisorbed on the basal plane of highly oriented pyrolytic graphite (HOPG), porphyrin molecules typically adopt a face-on configuration, which maximizes van der Waals molecule–substrate interactions. This configuration has been widely observed by STM where the aromatic core lay flat on the basal plane of the surface.30,33,37–40 Conversely, when the intermolecular van der Waals interactions are stronger than those between molecules and the substrate, the molecules tend to adopt an edge-on configuration. For applications in organic electronics, the edge-on adsorption of porphyrin molecules, where the cores are stacked in a columnar assembly, can be of special interest for charge transport.41 The best strategy to construct edge-on stacked porphyrin-based architectures is to promote the π–π stacking between the aromatic cores. Hitherto, only a few examples have been reported.42–44 Interestingly, it has been recently demonstrated that in the case of the porphyrins substituted in meso positions with alkyl chains, the final configuration of the self-assembled nanopatterns at the solution/HOPG interface directly depends on the length of aliphatic substituents.45 In particular, it was shown that the presence of the long alkyl chains promotes the formation of face-on porphyrin-based architectures whereas porphyrins functionalized with short chains adopt the edge-on conformation. This different behaviour can be explained by the presence of the strong molecule surface and molecule–molecule interactions, respectively. Nonetheless, it has also been reported that face-on porphyrin assemblies can be generated by exploiting β-functionalization with ethyl chains.46
Ferrocene (Fc) is an organometallic compound possessing unique optoelectronic properties, which makes it a key building block for various applications in materials science including sensing,47,48 catalysis,49,50 electronics,51–53 and even in anti-cancer agents.54 Thus, control over the self-assembly of ferrocene-based architectures is key towards the investigation and exploitation of their optical and electronic characteristics. For example, ordered Fc-based structures on a surface were recently produced by exploiting hydrogen-bonding between carboxylic acid functionalized Fc's, resulting in the formation of 2D quasicrystals.55 We recently reported on the self-assembly of guanosine–ferrocene dyads at the graphite/solution interface into free metallic quartet motifs and ribbon architectures. In situ STM imaging revealed that ferrocene groups physisorb as a second layer on top of guanosine monolayer structures.56
Herein, we present a sub-molecularly resolved STM study on the self-assembly on the graphite surface of porphyrin scaffolds functionalized in their meso positions with amide substituents comprising Fc electroactive units. We focused our attention on two porphyrin derivatives: P1 and P2 (Scheme 1, for the synthesis see the ESI†). The choice of the meso functionalization was aimed at exploring the effect of different self-recognition groups on the molecular self-assembly at surfaces. In particular, porphyrin P1 was designed to promote the formation of self-assembled structures characterized by the presence of H-bonds between secondary amide groups belonging to neighbouring molecules, and therefore to generate 2D face-on architectures. To explore the formation of structures based exclusively on van der Waals interactions, the secondary amides have been replaced with tertiary ones, and therefore the van der Waals interactions between the P2 cores as well as alkyl side-chains can be expected to govern the self-assembly. Moreover, we studied the electrochemical properties of P1 and P2 in solution as well as their self-assemblies on the graphite surface by means of cyclic voltammetry. Furthermore, we performed theoretical analyses to gain insight into the electronic and mechanical properties of both structures.
 | ||
| Scheme 1 Chemical structures of P1 and P2. | ||
2. Results and discussion
2.1 Scanning tunnelling microscopy (STM)
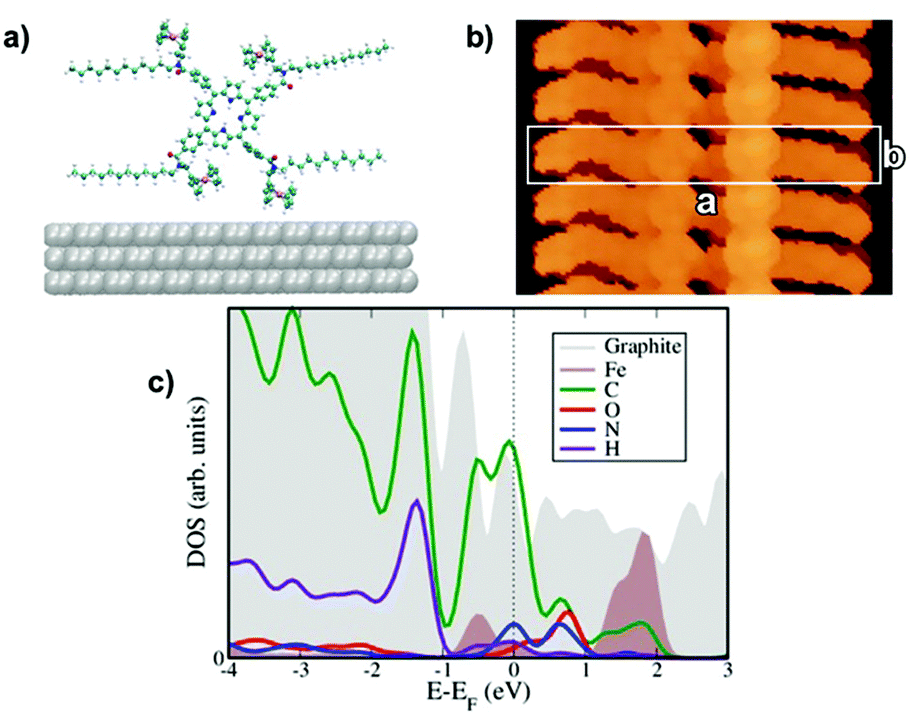
P1 and P2 films were prepared by drop casting 100 μL solutions (0.1 mM in CHCl3) onto HOPG; once dried up, the samples were kept under a chloroform-saturated atmosphere for 48 h at room temperature. The latter solvent vapour annealing (SVA) step in the film preparation was essential to form ordered self-assembled monolayers, by promoting the reorganization of the molecules adsorbed on the surface. It is noteworthy that this method has previously been successfully used to finely tune the self-assembly of various molecules, including n-type perylene nanowires,57 p-type pentacene,58 and hexa-peri-benzacoronene (HBC) structures.59The STM height image of P1 monolayers on HOPG is displayed in Fig. 1a and b. It shows a monocrystalline monolayer featuring a 2D porous motif with the P1 molecules being physisorbed flat on the graphite surface in a face-on arrangement. The packing of P1 is characterized by a unit cell (see the white square in Fig. 1b) with a = b = (2.2 ± 0.1) nm and α = (90 ± 2)°, which leads to an area A = (4.8 ± 0.2) nm2, where each unit cell contains a single P1 molecule. The supramolecular architecture is stabilized by strong N–H⋯O hydrogen bonds between secondary amide groups of neighbouring molecules. Because of the small size of the cavities (1.00 ± 0.05) nm2, as well as geometrical constraints, all dodecyl chains are most likely back-folded into the supernatant solution, whereas the position of ferrocene units inside the nano-cavities could not be resolved with STM.
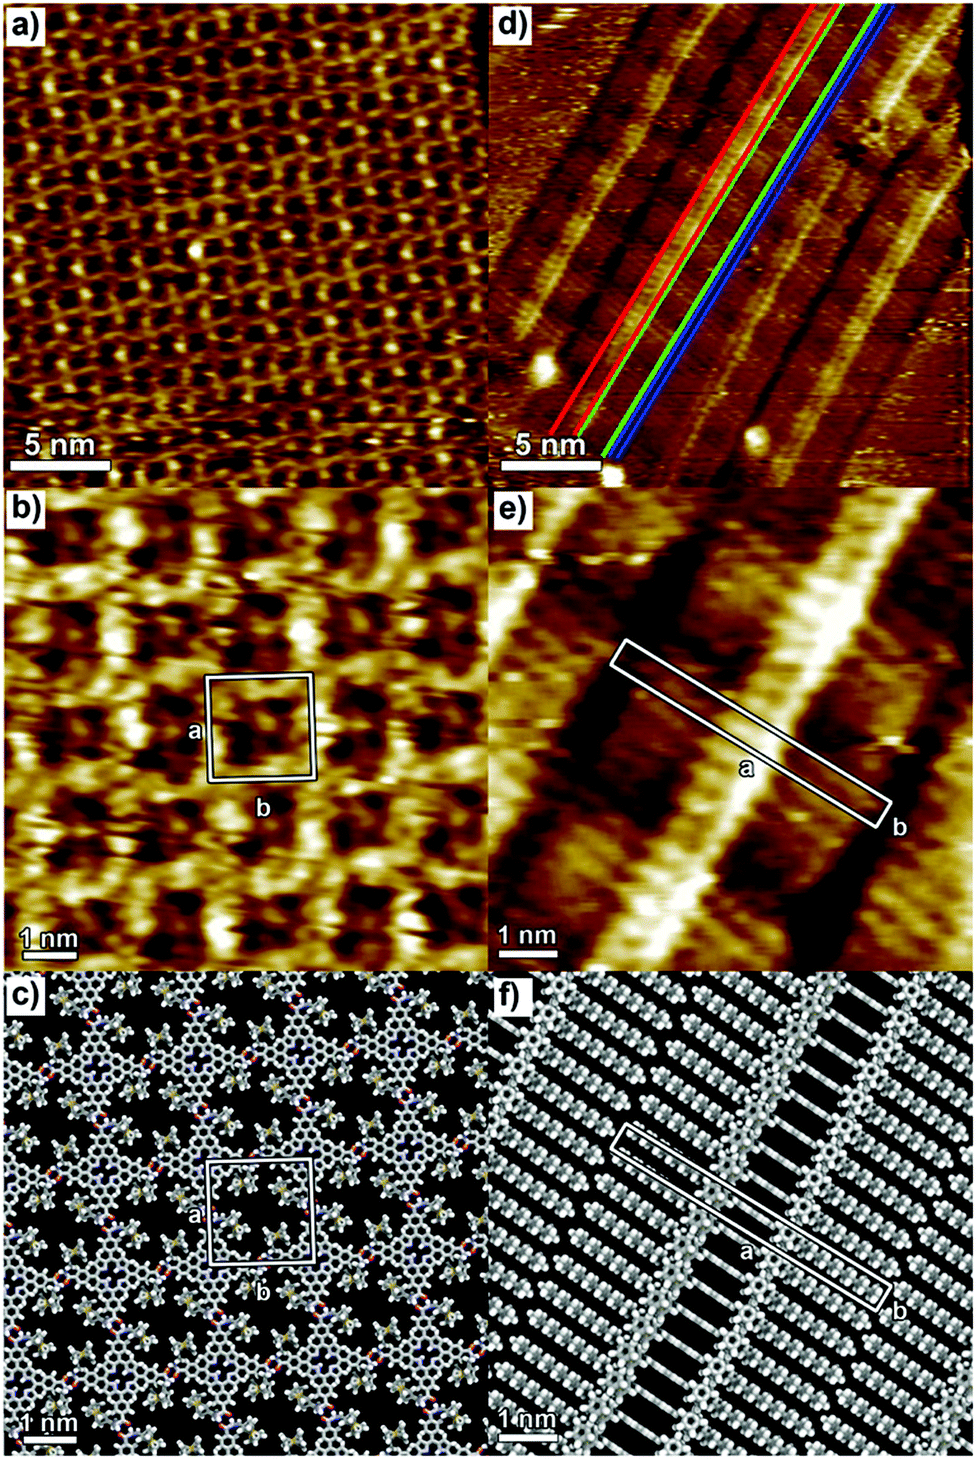 | ||
| Fig. 1 STM height images of P1 (a, b) and P2 (d, e) monolayers at the 1-phenyloctane/HOPG interface. Scanning parameters (a, b and d, e): average tunnelling current (It) = 25–30 pA, tip bias voltage (Vt) = 550–650 mV. The packing models of P1 and P2 are shown in (c) and (f), respectively. Dodecyl side chains in (c) are omitted for clarity. | ||
In the case of compound P2, the replacement of secondary amide groups with tertiary ones results in the formation of the lamellar structure monitored by STM (Fig. 1d and e). Within each lamella, areas of different contrast can be distinguished: the brightest areas (marked in red in Fig. 1d) and those with intermediate brightness (marked in green in Fig. 1d) are assigned to the porphyrin cores and the dodecyl chains, respectively. The dark parts marked in blue in Fig. 1d are assigned to inter-lamellar separation. The monolayer structure is characterized by the unit cell parameters a = (5.1 ± 0.1) nm, b = (0.6 ± 0.1) nm, and angle α = (90 ± 2)°, which leads to an area A = (3.1 ± 0.1) nm2, where each unit cell contains one P2 molecule. Typically, the porphyrin derivatives equipped with long alkyl chains are physisorbed flat in a face-on fashion on the graphite surface, where the self-assembled structures can be stabilized by both the porphyrin core/HOPG and alkyl chain/HOPG van der Waals interactions.30,33 In contrast to P1 monolayer where intermolecular H-bonding leads to the formation of a face-on architecture, P2 molecules adopt an edge-on arrangement as steered by van der Waals interactions and π–π stacking. Because of the functionalization of P2 with tertiary amides, the intramolecular H-bonding is not possible; thus, the P2 molecules adopt the energetically most favourable structure, i.e. the edge-on arrangement.
2.2. Electrochemical measurements
Cyclic voltammetric studies were conducted, at room temperature and in a standard three electrode cell, with HOPG working electrodes functionalized with either P1 or P2 monolayers. Prior to the electrochemical study on the two types of self-assembled architectures, i.e. face-on P1 assemblies and edge-on P2 columnar structures, the electrochemical properties of porphyrins P1 and P2 were investigated in dichloromethane (DCM) solutions, under ultra-dry conditions to obtain a sufficiently large potential window (see the ESI†) to investigate both the ferrocenyls and the porphyrin moieties. In solution, all ferrocenyls are expected to be electronically equivalent and therefore the single four-electron oxidation peak (with E1/2 = +0.46 V for P1 and +0.53 V for P2, see Fig. S2 in the ESI†) was attributed to the oxidation of the ferrocenyl groups. The remaining four reversible peaks observed in Fig. S2† correspond instead to two one-electron reductions and two one-electron oxidations respectively involving the porphyrin moiety, in line with the reported activity of phenyl-porphyrins.60 No interaction was evidenced between ferrocenyls and porphyrin, as expected due to the absence of any conjugation between them.Cyclic voltammetric studies of physisorbed P1 and P2 were instead performed in 0.1 M KCl aqueous solutions in order to avoid desorption of porphyrins from the HOPG surface during the experiments. Within the water limited potential window, the only detectable redox processes were those associated with the oxidation of ferrocenyls, as shown in Fig. 2. In the case of porphyrin P1, except for the first scan (vide infra), the curves (Fig. 2a) obtained at any scan rates (from 10 to 100 mV s−1) display the typical symmetric morphology expected for adsorbed species and correspond to the four reversible one-electron ferrocene oxidations, with E1/2 = 0.26 V (as the average of forward and reverse peak potentials). Noteworthy, the large positive shift of E1/2 for ferrocenyls oxidation in the film with respect to solution (200 mV) can only partially be attributed to changes in solvent polarity (DCM vs. water61), and would rather indicate a significantly strong stabilization of ferrocenyl cations upon interaction with the carbon surface.
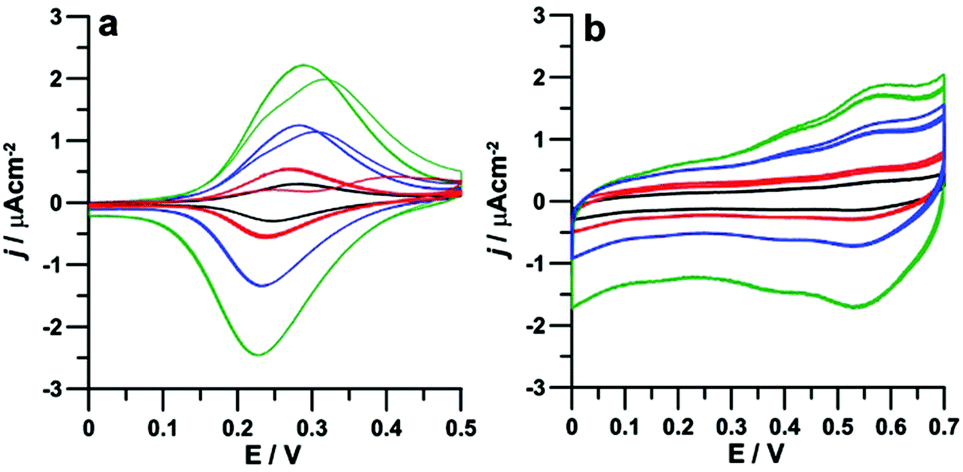 | ||
| Fig. 2 Cyclic voltammograms of P1 (a) and P2 (b) adsorbed on HOPG, scan rates: 10 mV s−1 (black), 20 mV s−1 (red), 50 mV s−1 (blue) and 100 mV s−1 (green), T = 25 °C. | ||
The electronic equivalence of the four ferrocenyl units remained therefore undisturbed upon adsorption on HOPG. This was not totally expected since the interaction with the carbon surface could have introduced some electronic anisotropy62,63 associated, for instance, with the presence of the four chiral centers in the proximity of the ferrocenyl moieties in P1. Since a racemate was used for the preparation of the films, a sizeable anisotropy reflecting the electrochemical behaviour could in principle be expected. However, while the effect of chirality on the absorption geometry of 2D lattices on surfaces was previously observed,64–66 chiral discrimination in electrochemical experiments is rare and associated with electrodes with an inherent enantiorecognition ability towards different chiral redox probes as that obtained, e.g., by surface modification by chiral conducting thiophene oligomers.67 Interestingly, the first forward scan of each voltammetric curve in Fig. 2a shows two separate peaks, variously overlapping at different scan rates, which might in principle be associated with the above anisotropy. However, no separation was observed in both the reverse peak and the subsequent forward and reverse scans, even after leaving the electrode to re-equilibrate for some time under open circuit conditions. The behaviour is particularly evident in the curve at 20 mV s−1, where two separate peaks appear, while at 50–100 mV s−1 the overlap is greater. By contrast, the curve at 10 mV s−1 only shows one unresolved peak, already during the first forward scan. Such a behaviour, highly conserved in different sampled areas, would be rather indicative of molecular dynamics in the adsorbed film, triggered by the electrochemical stimulus, and taking place over the timescale investigated in the present experiments. Such a dynamics would imply that the monolayer structure in its pristine state (prior to the voltammetric experiments) contains non-equivalent ferrocenyl units, which, following the injection of positive charges in the ferrocenyl units, would rearrange in a novel structure where all ferrocenyls are equivalent. Such a structure would be energetically favoured since the initial CV behavior cannot be recovered upon removal of the extra charges during the reverse scan. Such a partly disordered state would possibly form upon exposure to the aqueous medium where the structure evidenced by the STM studies with all alkyl chains pointing outwards from the surface (and all ferrocenyls in closer contact with the electrode surface) would be relatively unfavoured with respect to one where some of the chains are folded backwards and the corresponding ferrocenyls are more distant from the electrode. This hypothesis will be further examined in the following section. A very different CV behaviour was found for porphyrin P2, characterized by a stable CV pattern comprising two oxidations, located at 0.37 and 0.56 V respectively and each associated with the removal of two electrons (Fig. 2b). Such a behaviour is highly reproducible in the subsequent scans and would suggest the breaking of the electronic symmetry between the four chemically-equivalent ferrocenyls. This interpretation is in line with the edge-on organization of P2 within the self-assembled monolayer as described in the previous section, according to which the two ferrocenyls that are closer to the HOPG surface experience a different electronic environment with respect to those facing the solution. It is worth noticing that the two couples of redox processes are located respectively at higher and lower energies than in free P2 in solution. Since adsorption of porphyrins on the HOPG surface facilitates in P1 the ferrocene oxidation, we may attribute the first set of P2 oxidations to the two ferrocenyls which are in the film directed towards the HOPG surface while the higher potential of the second pair of oxidations with respect to the solution could be ascribed to electrostatic repulsions between neighbouring ferrocenyls.
2.3. MD calculations
In order to understand the dynamic electrochemical response of P1 self-assembled monolayers, we have performed quenched molecular dynamic simulations. Since P2-based architectures do not display electrochemical dynamics, we focused our attention on the P1 derivative exclusively. For P1, the first full scan of cyclic voltammetry shows that the split wave of the forward scan disappears in the reverse scan. The overlapping waves merge when the scan rates are between 10 and 20 mV s−1. Qualitatively, the associated dynamics can be assigned to a rate constant of ∼15 s−1. At room temperature, using Eyring theory, the energy barrier is ∼15.8 kcal mol−1. It is tempting to ascribe this behavior to the annealing of widespread defects. Quenched molecular dynamics (QMD), which was used elsewhere to investigate the interaction of ferrocene and carbon nanostructures,68–71 was carried out. The starting geometry of P1 was taken from STM images (Fig. 1c) with the molecule adsorbed on the graphite surface with all the ferrocene moieties oriented clockwise (“all trans” conformation, Fig. 3a). However, the most stable geometry identified by the QMD protocol of a single P1 molecule on the HOPG surface was characterized by the presence of a “cis” conformation of two ferrocene moieties. Conversion of the two conformations requires the torsion of the phenyl ring linker that connects the porphyrin and the ferrocenes. A scan along this dihedral angle was carried out to obtain the energy between the two conformational isomers.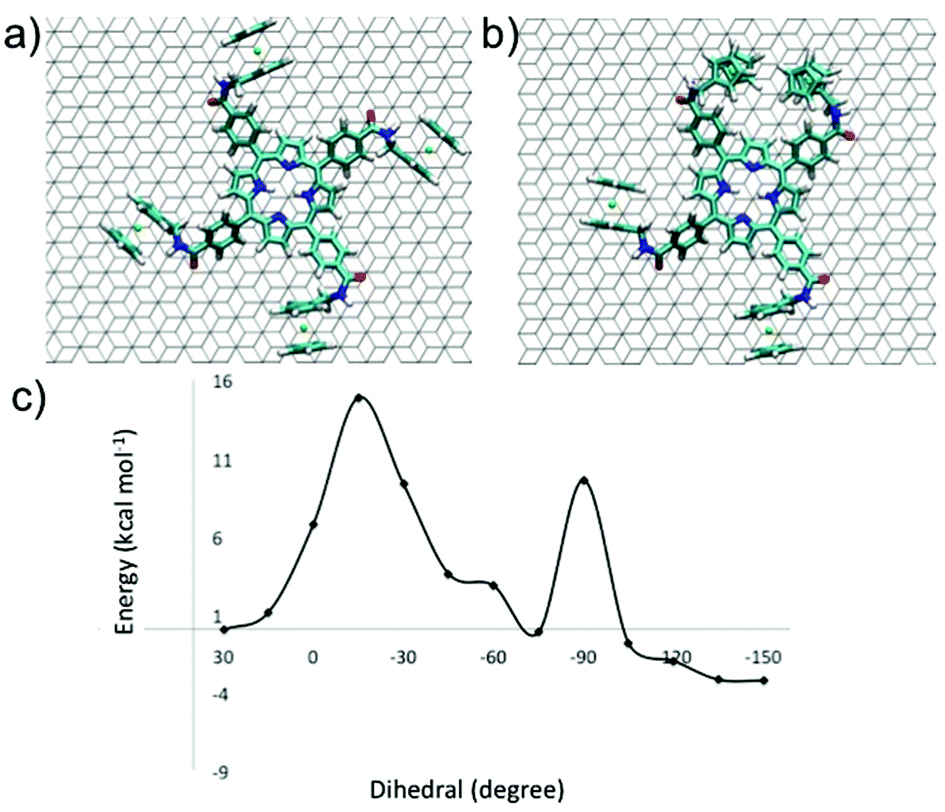 | ||
| Fig. 3 (a) All-trans conformer of P1 on graphite, all Fc's are oriented clockwise; (b) the more stable conformer of P1 on graphite identified by quenched molecular dynamics; (c) energy profile that connects the two conformers. | ||
The phenyl group bound to Fc is below the plane formed by the core of the molecule. Torsion about a carbon–carbon bond brings the phenyl group above the plane through a barrier of 14.9 kcal mol−1, see Fig. 3c, which is comparable with the barrier obtained by the analysis of the CV data. This small re-arrangement is hardly expected to generate a second wave in the voltammogram. However, the new conformation can further re-organize to yield a structure where two Fc's face each other, Fig. 3b. The new barrier is 9.8 kcal mol−1 and is lower than the first one. It is readily overcome and generates a structure where two Fc's interact strongly and therefore can have a different oxidation potential than the Fc in the structure of Fig. 3a. In the calculations, a single molecule was considered. The investigation of the isomerization path could be carried out using periodic boundary conditions. However, this approach would make the isomerization occur simultaneously in every cell and can generate artifacts. For molecules isolated on the surface (defects) the cis structure is more stable by 3.8 kcal mol−1 than the all trans conformer that is observed by STM measurements. The stability of the two conformers is reversed, with an additional stability of 3.2 kcal mol−1 in favor of the more symmetric structure, if the four Fc's are oxidized. The reason for the reversal in stability is the increase of destabilizing Coulomb interactions between the adjacent Fc's. By and large, the Quenched Molecular Dynamics simulations suggest that upon adsorption, defects are created where two Fc's interact with each other. These defects can be cured by oxidation of the film.
2.4. DFT calculations
To shed light on the self-assembly, and in particular, on both inter- and intramolecular interactions of P1 and P2, we have used density functional theory (DFT) as implemented in the CP2 K package,72–77 with the BLYP exchange–correlation (XC) functional.78,79 The valence electrons were treated with a double-zeta Gaussian basis set, while the core electrons were treated with norm-conserving pseudopotentials of the Goedecker–Teter–Hutter type.80,81 van der Waals interactions were included through the standard D3 approximation.82 The energy cut-off for the plane wave expansion of the density was set at 400 Ry and the relative cut-off at 50 Ry. The combination of this specific basis set and the XC functional provides a good balance between the amounts of correlation needed to describe the electronic structure of the ferrocene complex while preserving both structural and electronic features known from the graphite surface. In all cases, the convergence criteria of 1 × 10⁻⁷ Hartree for the SCF energy and 9 × 10⁻⁴ Hartree per Å for the energy gradient were employed. In our case, both complexes have been studied in a three-stage approach that allows us to systematically address the influence of different interactions present in these systems.In the first step, we have optimized the isolated single molecules in the gas-phase. This gave us the opportunity to peruse basic electronic structure features and chemical quantities of interest such as the electron affinity (EA = En+1 − En), the ionization potential (IP = En − En−1), the chemical potential (μ = (IP + EA)/2), and the chemical hardness (η = IP − EA). All these quantities are displayed in Table 1. Here, En−1, En and En+1 are electronic total energies corresponding to the total number of electrons of n − 1, n and n + 1, respectively.
| 3 | IP | EA | μ | η | vdW | Repulsion | Adsorption |
|---|---|---|---|---|---|---|---|
| P1 | 5.70 | 1.80 | 3.75 | 3.90 | N/A | 0.35 | −0.45 |
| P2 | 5.80 | 1.50 | 3.65 | 4.30 | −0.047 | 0.11 | −0.60 |
In a second step, we have built the unit cells based on the experimental models and the previously optimized molecular building blocks with the aim of reproducing the different motifs observed experimentally (not including the substrate at this stage). In the case of P1, we have focussed on the hydrogen bonding formed by the amide groups and the possible repulsive electrostatic interaction of the ferrocene units due to the presence of localized d-states (see Fig. S3 in the ESI†). For P2, the suggested layout has been built by forming two possible conformations allowing for van der Waals interactions between the chains along the a and b lattice directions (Fig. 5). Both the unit cell and the molecule conformations were optimized; the resulting lattice constants are in very good agreement with the reported experimental results (a = 2.16 nm, b = 2.24 nm for P1 and a = 5.1 nm, b = 0.61 nm for P2). Subsequently, we carried out single-point electronic structure calculations in order to assess the energetic stability of the complex. In each case, we have modelled (see Fig. S3 and Fig. S4 of the ESI†) the basic inter-cell interaction, namely, the hydrogen bonding in the case of P1 and the van der Waals network in the case of P2. Our calculations strongly suggest (see the values of the van der Waals and repulsive interactions in Table 1) that for both complexes, the surmised self-assembly mechanisms are not sufficient to explain the experimentally observed patterns, indicating a stronger influence of the substrate in mediating the energetics and stability of P1 and P2. Hence, in the final step, we have included the graphite substrate and the molecules in our previously optimized unit cells through a slab model using three atomic layers; a vacuum space of 40 Å was added to avoid spurious interactions between periodic images when using periodic boundary conditions. The Brillouin zone was sampled only at the Γ point, without loss in accuracy since large lattice vectors were used (more than 300 atoms in both cases) when compared to the original graphite surface unit cell. To quantify the interactions between the molecules and the substrate, we have defined the adsorption energy Ead through the expression Ead = Et − (Emol + Esurf), with Emol and Esurf being the total energies of the separate molecule and the surface, respectively. As shown in Table 1, for both molecular complexes P1 and P2, the adsorption energy is negative and has absolute values larger than inter- and intramolecular van der Waals and repulsive contributions. This strongly indicates that the absorption energy can compensate for the other two previously mentioned contributions and stabilize the molecular assembly.
As a direct result of the geometry optimization procedure, the spatial arrangement of the molecule within the unit cell is obtained, providing a suitable atomistic model to investigate not only the adsorption distances of the individual ferrocene moieties to the surface for both complexes, but also the formation of inter-cell hydrogen bonding in the case of P1. Our results also show that in the case of P2 the observed arrangement favors the parallel alignment of the alkyl chains in both lattice directions and hence van der Waals binding interactions. Two of the four dodecyl chains are in their extended all-trans conformation and are parallel to the surface where the adjacent two Fc units are back-folded into the supernatant solution. Consequently, the other dodecyl chains as well as the other Fc groups are physisorbed on HOPG. Then, this geometrical distribution leads to a direct interaction of the ferrocenes with the surface. No interdigitating of dodecyl chains was observed in multiple samples.
Particular attention has been devoted, in the case of P1, to the position of the alkyl chains, since it was a puzzling issue to guess the best possible spatial layout of the chains within the unit cell. Hence, we have computed the potential energy surface for the case where the chains are back-folded in the supernatant solution, with the conjugated core facing directly the HOPG surface. The relevant length was chosen to be the distance of the normal vector centered at the plane created by the four iron atoms with a carbon atom of the surface. For each molecule–surface separation, the atomic positions were relaxed leading us to observe a clear minimum at 5.5 Å in the total energy surface (see Fig. S5 of the ESI†). On the contrary, the minimum distances between the ferrocene moieties and the graphite substrate found in the second configuration, with alkyl chains below the porphyrin core and thus closer to the surface, were determined to be 10.5 Å. In this case the alkyl chains act as a mechanical buffer that decouples the ferrocene moieties and the conjugated porphyrin cores from the HOPG surface. As a result, we concluded that the long alkyl chains are back-folded, pointing away from the substrate, and that this conformation is the most energetically favorable, in agreement with the experimental results.
Taking this result into account, the possibility of bond formation between the ferrocene units and the HOPG surface was additionally addressed by calculating some selected cross-sections of the electron localization function (ELF)83 and the corresponding results are displayed in Fig. S6 of the ESI.† According to the ELF analysis the dominating interaction is electrostatic in origin, as a result of an admixture of van der Waals and Coulombic forces due to the strong electron localization of the HOMO levels (see the ESI† for the molecular orbital images). Hence, the physisorbed picture is corroborated in terms of these two analyses.
Based on these facts, the strong difference observed in the network formation stems from the ability of P1 to still form hydrogen bonding in contrast to P2.
The corresponding STM images have been calculated using the standard Tersoff–Hamann theory, see Fig. 2b and 3b with a constant bias potential of 500 meV for P1 and 700 meV for P2. The integration range covers mostly states on the organic core with a certain amount of ferrocene admixture (see the corresponding PDOS in Fig. 2c and 3c). A rather good agreement with the experimental images has been achieved (compare with Fig. 1d and 1e), allowing us to conclude that our modelled configurations are likely to quantitatively describe the physical situations studied in the experiments. Finally, we have also computed the projected density of states (PDOS) to gain further insight into the nature of the electronic states around the Fermi level. The results are shown in Fig. 4c and 5c for P1 and P2, respectively. In both cases, hybridization between the states of the porphyrin cores mainly coming from the carbon atoms and the d states from the ferrocene molecules was found in the region near the Fermi energy. States coming from the oxygen and hydrogen atoms are also observed in this region with a larger spectral weight for P1 than for P2 that can be ascribed to the dominance of the hydrogen bonding network in P1 when compared with the weaker van der Waals coupling in the case of P2.
 | ||
| Fig. 4 Computed molecular conformations, electronic features, and STM images for the P1 complex: (a) side view of the optimized unit cell, (b) simulated STM images of unoccupied states, experimental conditions are respectively: +0.5 V, |Ψ|2 = 10–7 Å−3 integration of the wave function. (c) Projected density of states highlighting the contributions from the metallic Fe d-states around the Fermi energy. | ||
 | ||
| Fig. 5 Computed molecular conformations, electronic features, and STM images for the P2 complex: (a) side view of the optimized unit cell, (b) simulated STM images of unoccupied states, experimental conditions are respectively: +0.7 V, |Ψ|2 = 10–7 Å−3 integration of the wave function. (c) Projected density of states highlighting the contributions from the metallic d-states around the Fermi energy. | ||
3. Conclusions
In summary, we have exploited scanning tunneling microscopy imaging in combination with cyclic voltammetry measurements in order to gain detailed and multiscale insight into the self-assembly of the complex molecular system on the surface of an electrode such as graphite. To challenge this approach, we have synthesized two substituted porphyrins exposing in four meso-positions different amide groups equipped with dodecyl side chains and ferrocene units, that by design can be expected to undergo self-assembly on graphite in two different ways. Both derivatives were found to form monomorphic 2D crystals. Subtle changes of the amide nature (secondary vs. tertiary) influenced the 2D patterns on graphite. Derivative P1, functionalized with secondary amides, self-assembled into planar face-on H-bonded porous arrays stabilized by intermolecular N–H⋯O pairing. Conversely, derivative P2 equipped with tertiary amides was found to form edge-on lamellar structures, whose presence is attributed to strong porphyrin–porphyrin interactions reinforced by strong electrostatic interactions between ferrocenes. Such a dramatic difference in the supramolecular arrangement highly affected the molecule's electrochemical properties as monitored by cyclic voltammetry. In particular, the CV behavior of P1 molecules provided distinct evidence for the existence of dynamics in the adsorbed film that is associated with the presence of defects within the self-assembled structures. The latter is the result of the different conformations adopted by the ferrocene side-groups. DFT and molecular dynamics calculations provided further support in order to attain a full understanding of the self-assembly behaviors and made it possible to gain information on the electronic and physical properties of both assemblies. In view of the dual functionality characterizing our complex molecules containing electroactive units such as porphyrins and ferrocenes, the results discussed in this work may be of importance to decorate the surface with bi-functional nanopatterns at will and to potentially use them as complex supramolecular scaffolds with tunable electronic properties.Acknowledgements
This work was supported by the European Community through the project EC FP7 ICT-MOLARNET (318516) and the European Research Council project SUPRAFUNCTION (GA-257305), the Agence Nationale de la Recherche through the LabEx project Chemistry of Complex Systems (ANR-10-LABX-0026_CSC) and the International Center for Frontier Research in Chemistry. A. S. B. and R. G. thank A. Dianat for very helpful discussions. This work has also been partly supported by the German Research Foundation (DFG) within the Cluster of Excellence “Center for Advancing Electronics Dresden”. Computational resources were provided by the ZIH at Dresden University of Technology.Notes and references
- T. F. A. Greef and E. W. Meijer, Nature, 2008, 453, 171–173 CrossRef PubMed.
- J.-M. Lehn, Science, 2002, 295, 2400–2403 CrossRef CAS PubMed.
- J. W. Steed and J. L. Atwood, Supramolecular chemistry, John Wiley & Sons, 2009 Search PubMed.
- J. V. Barth, G. Costantini and K. Kern, Nature, 2005, 437, 671–679 CrossRef CAS PubMed.
- M. O. Blunt, J. C. Russell, M. D. Gimenez-Lopez, J. P. Garrahan, X. Lin, M. Schroder, N. R. Champness and P. H. Beton, Science, 2008, 322, 1077–1081 CrossRef CAS PubMed.
- F. Cicoira, C. Santana and F. Rosei, Top. Curr. Chem., 2008, 285, 203–267 CrossRef CAS PubMed.
- A. Ciesielski, M. El Garah, S. Haar, P. Kovaricek, J. M. Lehn and P. Samorì, Nat. Chem., 2014, 6, 1017–1023 CrossRef CAS PubMed.
- A. Ciesielski, C.-A. Palma, M. Bonini and P. Samorì, Adv. Mater., 2010, 22, 3506–3520 CrossRef CAS PubMed.
- S. De Feyter and F. C. De Schryver, Chem. Soc. Rev., 2003, 32, 139–150 RSC.
- J. A. A. W. Elemans, S. B. Lei and S. De Feyter, Angew. Chem., Int. Ed., 2009, 48, 7298–7332 CrossRef CAS PubMed.
- J. M. MacLeod, O. Ivasenko, D. F. Perepichka and F. Rosei, Nanotechnology, 2007, 18, 424031–424040 CrossRef CAS PubMed.
- D. Bonifazi, H. Spillmann, A. Kiebele, M. de Wild, P. Seiler, F. Cheng, H.-J. Güntherodt, T. Jung and F. Diederich, Angew. Chem., Int. Ed., 2004, 43, 4759–4763 CrossRef CAS PubMed.
- D. Heim, K. Seufert, W. Auwärter, C. Aurisicchio, C. Fabbro, D. Bonifazi and J. V. Barth, Nano Lett., 2010, 10, 122–128 CrossRef CAS PubMed.
- M. El Garah, J. Lipton-Duffin, J. M. MacLeod, R. Gutzler, F. Palmino, V. Luzet, F. Chérioux and F. Rosei, Chem. – Asian J., 2013, 8, 1813–1817 CrossRef CAS PubMed.
- A. Ciesielski, G. Schaeffer, A. Petitjean, J. M. Lehn and P. Samorì, Angew. Chem., Int. Ed., 2009, 48, 2039–2043 CrossRef CAS PubMed.
- L. Piot, D. Bonifazi and P. Samorì, Adv. Funct. Mater., 2007, 17, 3689–3693 CrossRef CAS.
- A. Ciesielski, S. Lena, S. Masiero, G. P. Spada and P. Samorì, Angew. Chem., Int. Ed., 2010, 49, 1963–1966 CrossRef CAS PubMed.
- A. Ciesielski, L. Piot, P. Samorì, A. Jouaiti and M. W. Hosseini, Adv. Mater., 2009, 21, 1131–1136 CrossRef CAS.
- J. A. A. W. Elemans, R. Van Hameren, R. J. M. Nolte and A. E. Rowan, Adv. Mater., 2006, 18, 1251–1266 CrossRef CAS.
- T. Kudernac, S. B. Lei, J. A. A. W. Elemans and S. De Feyter, Chem. Soc. Rev., 2009, 38, 402–421 RSC.
- G. P. Spada, S. Lena, S. Masiero, S. Pieraccini, M. Surin and P. Samorì, Adv. Mater., 2008, 20, 2433–2438 CrossRef CAS.
- S. A. DiBenedetto, A. Facchetti, M. A. Ratner and T. J. Marks, Adv. Mater., 2009, 21, 1407–1433 CrossRef CAS.
- C. A. Palma and P. Samorì, Nat. Chem., 2011, 3, 431–436 CrossRef CAS PubMed.
- A. Yella, H.-W. Lee, H. N. Tsao, C. Yi, A. K. Chandiran, M. K. Nazeeruddin, E. W.-G. Diau, C.-Y. Yeh, S. M. Zakeeruddin and M. Grätzel, Science, 2011, 334, 629–634 CrossRef CAS PubMed.
- H. Guo, J. Jiang, Y. Shi, Y. Wang, J. Liu and S. Dong, J. Phys. Chem. B, 2004, 108, 10185–10191 CrossRef CAS.
- B. A. Friesen, B. Wiggins, J. L. McHale, U. Mazur and K. W. Hipps, J. Am. Chem. Soc., 2010, 132, 8554–8556 CrossRef CAS PubMed.
- T. A. Pham, F. Song, M. N. Alberti, M.-T. Nguyen, N. Trapp, C. Thilgen, F. Diederich and M. Stöhr, Chem. Commun., 2015, 51, 14473–14476 RSC.
- H. Spillmann, A. Kiebele, M. Stöhr, T. A. Jung, D. Bonifazi, F. Cheng and F. Diederich, Adv. Mater., 2006, 18, 275–279 CrossRef CAS.
- W. Auwärter, A. Weber-Bargioni, A. Riemann, A. Schiffrin, O. Gröning, R. Fasel and J. V. Barth, J. Chem. Phys., 2006, 124, 194708 CrossRef PubMed.
- X. Qiu, C. Wang, Q. Zeng, B. Xu, S. Yin, H. Wang, S. Xu and C. Bai, J. Am. Chem. Soc., 2000, 122, 5550–5556 CrossRef CAS.
- J. Visser, N. Katsonis, J. Vicario and B. L. Feringa, Langmuir, 2009, 25, 5980–5985 CrossRef CAS PubMed.
- S. B. Lei, J. Wang, Y. H. Dong, C. Wang, L. J. Wan and C. L. Bai, Surf. Interface Anal., 2002, 34, 767–771 CrossRef CAS.
- H. Wang, C. Wang, Q. Zeng, S. Xu, S. Yin, B. Xu and C. Bai, Surf. Interface Anal., 2001, 32, 266–270 CrossRef CAS.
- J. Otsuki, Coord. Chem. Rev., 2010, 254, 2311–2341 CrossRef CAS.
- K. Suto, S. Yoshimoto and K. Itaya, Langmuir, 2006, 22, 10766–10776 CrossRef CAS PubMed.
- M. El Garah, N. Marets, M. Mauro, A. Aliprandi, S. Bonacchi, L. De Cola, A. Ciesielski, V. Bulach, M. W. Hosseini and P. Samorì, J. Am. Chem. Soc., 2015, 137, 8450–8459 CrossRef CAS PubMed.
- A. G. Slater, Y. Hu, L. Yang, S. P. Argent, W. Lewis, M. O. Blunt and N. R. Champness, Chem. Sci., 2015, 6, 1562–1569 RSC.
- T. Ikeda, M. Asakawa, M. Goto, K. Miyake, T. Ishida and T. Shimizu, Langmuir, 2004, 20, 5454–5459 CrossRef CAS PubMed.
- M. Li, D. den Boer, P. Iavicoli, J. Adisoejoso, H. Uji-i, M. Van der Auweraer, D. B. Amabilino, J. A. A. W. Elemans and S. De Feyter, J. Am. Chem. Soc., 2014, 136, 17418–17421 CrossRef CAS PubMed.
- J. Otsuki, E. Nagamine, T. Kondo, K. Iwasaki, M. Asakawa and K. Miyake, J. Am. Chem. Soc., 2005, 127, 10400–10405 CrossRef CAS PubMed.
- P. G. Schouten, J. M. Warman, M. P. de Haas, M. A. Fox and H.-L. Pan, Nature, 1991, 353, 736–737 CrossRef CAS.
- Y. S. Zhou, B. Wang, M. Z. Zhu and J. G. Hou, Chem. Phys. Lett., 2005, 403, 140–145 CrossRef CAS.
- J. A. A. W. Elemans, M. C. Lensen, J. W. Gerritsen, H. van Kempen, S. Speller, R. J. M. Nolte and A. E. Rowan, Adv. Mater., 2003, 15, 2070–2073 CrossRef CAS.
- T. Sakano, J. Hasegawa, K. Higashiguchi and K. i. Matsuda, Chem. – Asian J., 2012, 7, 394–399 CrossRef CAS PubMed.
- J. Otsuki, K. Namiki, Y. Arai, M. Amano, H. Sawai, A. Tsukamoto and T. Hagiwara, Chem. Lett., 2009, 38, 570–571 CrossRef CAS.
- A. Jahanbekam, B. Chilukuri, U. Mazur and K. W. Hipps, J. Phys. Chem. C, 2015, 119, 25364–25376 CAS.
- D. Astruc, M. C. Daniel and J. Ruiz, Chem. Commun., 2004, 2637–2649 RSC.
- R. Djeda, A. Rapakousiou, L. Liang, N. Guidolin, J. Ruiz and D. Astruc, Angew. Chem., Int. Ed., 2010, 49, 8152–8156 CrossRef CAS PubMed.
- A. K. Diallo, C. Ornelas, L. Salmon, J. R. Aranzaes and D. Astruc, Angew. Chem., Int. Ed., 2007, 46, 8644–8648 CrossRef CAS PubMed.
- C. Ornelas, L. Salmon, J. R. Aranzaes and D. Astruc, Chem. Commun., 2007, 4946–4948 RSC.
- D. Astruc, C. Ornelas and J. Ruiz, Acc. Chem. Res., 2008, 41, 841–856 CrossRef CAS PubMed.
- C. Ornelas, J. Ruiz, C. Belin and D. Astruc, J. Am. Chem. Soc., 2008, 131, 590–601 CrossRef PubMed.
- M. N. Hansen, E. Farjami, M. Kristiansen, L. Clima, S. U. Pedersen, K. Daasbjerg, E. E. Ferapontova and K. V. Gothelf, J. Org. Chem., 2010, 75, 2474–2481 CrossRef CAS PubMed.
- V. J. Fiorina, R. J. Dubois and S. Brynes, J. Med. Chem., 1978, 21, 393–395 CrossRef CAS PubMed.
- N. A. Wasio, R. C. Quardokus, R. P. Forrest, C. S. Lent, S. A. Corcelli, J. A. Christie, K. W. Henderson and S. A. Kandel, Nature, 2014, 507, 86–89 CrossRef CAS PubMed.
- M. El Garah, R. C. Perone, A. S. Bonilla, S. Haar, M. Campitiello, R. Gutierrez, G. Cuniberti, S. Masiero, A. Ciesielski and P. Samorì, Chem. Commun., 2015, 51, 11677–11680 RSC.
- G. De Luca, A. Liscio, P. Maccagnani, F. Nolde, V. Palermo, K. Müllen and P. Samorì, Adv. Funct. Mater., 2007, 17, 3791–3798 CrossRef CAS.
- D. H. Kim, D. Y. Lee, H. S. Lee, W. H. Lee, Y. H. Kim, J. I. Han and K. Cho, Adv. Mater., 2007, 19, 678–682 CrossRef CAS.
- G. De Luca, A. Liscio, F. Nolde, L. M. Scolaro, V. Palermo, K. Müllen and P. Samorì, Soft Matter, 2008, 4, 2064–2070 RSC.
- C. Sooambar, V. Troiani, C. Bruno, M. Marcaccio, F. Paolucci, A. Listorti, A. Belbakra, N. Armaroli, A. Magistrato and R. De Zorzi, Org. Biomol. Chem., 2009, 7, 2402–2413 CAS.
- B. Soucaze-Guillous, W. Kutner, M. T. Jones and K. M. Kadish, J. Electrochem. Soc., 1996, 143, 550–556 CrossRef CAS.
- V. Arima, M. Iurlo, L. Zoli, S. Kumar, M. Piacenza, F. Della Sala, F. Matino, G. Maruccio, R. Rinaldi and F. Paolucci, Nanoscale, 2012, 4, 813–823 RSC.
- M. Iurlo, L. Mengozzi, S. Rapino, M. Marcaccio, R. C. Perone, S. Masiero, P. Cozzi and F. Paolucci, Organometallics, 2014, 33, 4986–4993 CrossRef CAS.
- I. Destoop, H. Xu, C. Oliveras-Gonzalez, E. Ghijsens, D. B. Amabilino and S. De Feyter, Chem. Commun., 2013, 49, 7477–7479 RSC.
- H. Xu, E. Ghijsens, S. J. George, M. Wolffs, Ž. Tomović, A. P. H. J. Schenning and S. De Feyter, ChemPhysChem, 2013, 14, 1583–1590 CrossRef CAS PubMed.
- N. Katsonis, H. Xu, R. M. Haak, T. Kudernac, Ž. Tomović, S. J. George, M. Van der Auweraer, A. P. H. J. Schenning, E. W. Meijer, B. L. Feringa and S. De Feyter, Angew. Chem., Int. Ed., 2008, 47, 4997–5001 CrossRef CAS PubMed.
- S. Arnaboldi, T. Benincori, R. Cirilli, W. Kutner, M. Magni, P. R. Mussini, K. Noworyta and F. Sannicolo, Chem. Sci., 2015, 6, 1706–1711 RSC.
- M. Calvaresi, M. Quintana, P. Rudolf, F. Zerbetto and M. Prato, ChemPhysChem, 2013, 14, 3447–3453 CrossRef CAS PubMed.
- X. Liu, H. Kuzmany, P. Ayala, M. Calvaresi, F. Zerbetto and T. Pichler, Adv. Funct. Mater., 2012, 22, 3202–3208 CrossRef CAS.
- W. Plank, R. Pfeiffer, C. Schaman, H. Kuzmany, M. Calvaresi, F. Zerbetto and J. Meyer, ACS Nano, 2010, 4, 4515–4522 CrossRef CAS PubMed.
- M. Quintana, M. Grzelczak, K. Spyrou, M. Calvaresi, S. Bals, B. Kooi, G. Van Tendeloo, P. Rudolf, F. Zerbetto and M. Prato, J. Am. Chem. Soc., 2012, 134, 13310–13315 CrossRef CAS PubMed.
- M. Frigo and S. G. Johnson, Proc. IEEE, 2005, 93, 216–231 CrossRef.
- J. Hutter, M. Iannuzzi, F. Schiffmann and J. VandeVondele, Wiley Interdiscip. Rev.: Comput. Mol. Sci., 2014, 4, 15–25 CrossRef CAS.
- M. Krack and M. Parrinello, Phys. Chem. Chem. Phys., 2000, 2, 2105–2112 RSC.
- G. Lippert, J. Hutter and M. Parrinello, Theor. Chem. Acc., 1999, 103, 124–140 CrossRef CAS.
- J. VandeVondele and J. Hutter, J. Chem. Phys., 2003, 118, 4365–4369 CrossRef CAS.
- J. VandeVondele and J. Hutter, J. Chem. Phys., 2007, 127, 114105 CrossRef PubMed.
- A. D. Becke, Phys. Rev. A, 1988, 38, 3098–3100 CrossRef CAS.
- C. Lee, W. Yang and R. G. Parr, Phys. Rev. B: Condens. Matter, 1988, 37, 785–789 CrossRef CAS.
- S. Goedecker, M. Teter and J. Hutter, Phys. Rev. B: Condens. Matter, 1996, 54, 1703–1710 CrossRef CAS.
- C. Hartwigsen, S. Goedecker and J. Hutter, Phys. Rev. B: Condens. Matter, 1998, 58, 3641–3662 CrossRef CAS.
- S. Grimme, J. Antony, S. Ehrlich and H. Krieg, J. Chem. Phys., 2010, 132, 154104 CrossRef PubMed.
- J. Tersoff and D. R. Hamann, Phys. Rev. B: Condens. Matter, 1985, 31, 805–813 CrossRef CAS.
Footnote |
| † Electronic supplementary information (ESI) available. See DOI: 10.1039/c6nr03424a |
| This journal is © The Royal Society of Chemistry 2016 |