 Open Access Article
Creative Commons Attribution 3.0 Unported Licence
Revealing the radiative and non-radiative relaxation rates of the fluorescent dye Atto488 in a λ/2 Fabry–Pérot-resonator by spectral and time resolved measurements†
Alexander
Konrad
*a,
Michael
Metzger
a,
Andreas M.
Kern
a,
Marc
Brecht
ab and
Alfred J.
Meixner
*a
aUniversität Tübingen, Institut für Physikalische und Theoretische Chemie, Auf der Morgenstelle 18, 72076 Tübingen, Germany. E-mail: alexander.konrad@uni-tuebingen.de; alfred.meixner@uni-tuebingen.de
bProcess Analysis and Technology (PA&T), Reutlingen Research Institute, Reutlingen University, Alteburgstr. 150, 72762 Reutlingen, Germany
First published on 4th July 2016
Abstract
Using a Fabry–Pérot-microresonator with controllable cavity lengths in the λ/2-regime, we show the controlled modification of the vibronic relaxation dynamics of a fluorescent dye molecule in the spectral and time domain. By altering the photonic mode density around the fluorophores we are able to shape the fluorescence spectrum and enhance specifically the probability of the radiative transitions from the electronic excited state to distinct vibronic excited states of the electronic ground state. Analysis and correlation of the spectral and time resolved measurements by a theoretical model and a global fitting procedure allows us to reveal quantitatively the spectrally distributed radiative and non-radiative relaxation dynamics of the respective dye molecule under ambient conditions at the ensemble level.
1. Introduction
The ability to reveal and control the optical properties of matter is the key for design and development of novel nanoscale photonic devices.1–3 In particular, single quantum emitters such as fluorescent molecules,1,4 quantum dots5 or noble metal particles6 are essential candidates for such applications. Besides the temperature dependent influence of the chemical environment of the host material, the fluorescence properties of a molecule depend in particular on the direct photonic environment.7 Several approaches to sense or control optical properties such as fluorescence spectra or excited state lifetimes of electronically excited molecules have been described over the last few decades. In general, the two regimes of optical fields i.e. the near- and far field regimes, can be distinguished, which affect the radiative and non-radiative relaxation processes of fluorophores.8 Near-field induced influences caused by strong localized fields on molecular dipoles were investigated, which can be generated by closely separated antenna-like objects such as nanoparticles,8–10 nanostructures,11,12 surfaces,13 tips,14 other molecules4,15,16 or large molecular systems.17,18 The optical near-field of such an antenna is able to couple to the near-field of the molecule transition dipole leading to enhanced or quenched emission.8 On the other side, a quantum emitter can also be perturbed by optical far-fields of e.g. lasers,19 resonators via the Purcell effect20–23 or electric fields.24,25 However, in order to sense or control the fluorescence properties of molecules, one requires both, the intrinsic properties of the emitter and the optical properties of the external perturbation26 determined by the local density of optical states (LDOS).Specifically, modeling and experimentally distinguishing between the radiative and non-radiative perturbation induced by a photonic device is a difficult task.27 First of all, a description of the fluorescence properties in the time and spectral domain of molecules is hampered especially under ambient conditions, where fluorescent transitions are affected by inhomogeneous broadening. To date under ambient conditions the composition of the emission spectra could be described explicitly, though only at the single particle level, only for certain model systems with spectrally separable bands.28 Thus, resolving closely separated spectral bands is not always possible. Secondly, relaxation from an electronically excited state can occur by non-radiative relaxation, which cannot be observed directly by optical means. Experimentally determined fluorescence lifetimes by time domain measurements only represent the total relaxation rate of the electronic transition. Thus, correlating the spectral and the time domain data of one chromophore cannot be achieved without further methods such as a controllable perturbation on the system. And thirdly, the ability to reproducibly control the impact of a photonic environment needs both, a full description of the perturbation and an appropriate instrumental device.
Several attempts have been reported addressing these issues. One method focuses on using plasmonic based nanoresonators,29,30 nanocrystals31 and nanoapertures32,33 to shape and control the fluorescence of molecules. In particular, nanoantennas combined with scanning probes are promising devices to detect the near-field of fluorescent molecules.34 Summarizing these studies, nanoscopic antennas with determinable impact on the near- and far-field of emitters can be used to obtain a deeper insight by modifying the dynamics of fluorescent and non-fluorescent deactivation mechanisms. The major advantage of such antennas is their very large field enhancement at certain localized hot spots and thus their strong impact on fluorescence. However, using metallic antennas in an extremely close proximity can cause besides quenching severe chemical interactions with the specimen leading to conformational changes or even chemical degradation.35,36 Another problem arises from the positioning of the metal–antenna system with respect to the molecule, which has to be in a controlled manner with sub-nanometer precision due to the competitive enhancement of deactivation processes.8 Additionally, the precise position and geometry of the antenna with respect to a molecule are often not well defined; also the inter- and intra-molecular dynamics of the specimen in time and space have to be known to achieve a quantitatively assessable impact on fluorescence. Other methods to gain information on fluorescent molecules are saturation spectroscopy, where the fluorescence intensity is detected as a function of excitation flux37 or alternatively low-temperature single molecule spectroscopy,38,39 where the inhomogeneous broadening of the spectra can be minimized in order to gain information on the spectral and temporal properties of a molecule. However, both methods also have their difficulties such as heating and photobleaching in the case of saturation spectroscopy or the use of experimentally demanding equipment in the case of low temperature single molecule spectroscopy.
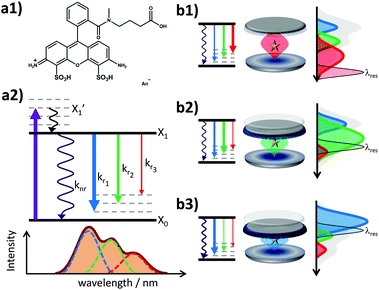
Therefore, Fabry–Pérot-type λ/2-microresonators are promising candidates to investigate these issues avoiding an altered chemical environment by metal particles and without the requirement of single molecules or cryogenic temperatures. Their simple geometry allows one to tune reproducibly the cavity resonance via a mirror separation and thus the effective Purcell effect.40,41 Several studies have demonstrated the ability of such microresonators to shape emission spectra of luminescent systems and enhance or suppress excited state relaxation dynamics such as the lifetimes of fluorescent molecules.4,16,22,28 However, a study revealing the optical properties of a fluorescent molecule in both, the spectral and time domains under ambient conditions at the ensemble level is still missing. To this end, the fluorescence of the rhodamine derivative known under the commercial name Atto488 (see Fig. 1(a1); purchased from ATTO-TEC, Siegen, Germany) was analyzed in free space and in a tunable λ/2-microresonator by confocal scanning microscopy and spectroscopy combined with time correlated single photon counting (TCSPC). Rhodamine dyes exhibit a large quantum yield and have been exceedingly used in the last few decades.42 The fluorescence decay of Atto488 obeys a mono-exponential time law, where the lifetime is in the regime of nanoseconds and is thus experimentally accessible by the Purcell effect. For a large number of different cavity lengths, the fluorescence of Atto488 was evaluated using a theoretical model18,28 allowing us to assign quantitatively the relaxation properties of the excited molecule in both, the time and spectral domains, even for spectrally overlapping fluorescence bands. The quantitative assignment includes the characterization of the spectral distribution of the fluorescence as well as the radiative and non-radiative relaxation properties as a function of cavity separation. This approach finally allows us to correlate the optical information of the time and the spectral domains, which are connected via the wavelength dependent Purcell effect on the radiative decay rates and the shaping of the fluorescence spectra.
The fluorescence spectrum of Atto488 under ambient conditions is composed of several radiative transitions from the first electronically excited state to a sequence of vibronic levels of the electronic ground state with decreasing energy. Due to a large inhomogeneous broadening of these transitions, they cannot be resolved spectrally in free space. However, the controllable wavelength dependent perturbation via the Purcell effect allows us to overcome this issue. The energy level diagram in Fig. 1(a2) illustrates the transition from the electronically excited state to the vibronic levels of the electronic ground state yielding different emission spectra for free space and in a microresonator for three different mirror separations (b1–b3). Each inhomogeneously broadened radiative transition (k1–3) can be described in the spectral domain by a Gaussian with the parameters amplitude, spectral position and full width at half maximum (FWHM). For each microresonator setting, given by the on-axis transmission wavelength, the Purcell factor can be calculated as a function of the emission wavelengths.18,28,40 This allows us to determine the effective enhancement and shaping for each vibronic band by calculating the modification of the radiative decay rate according to eqn (1):
 | (1) |
 is the modified decay rate for the electronic transition i, kri is the free space decay rate (i.e. without resonator) for transition i, P(λ,λtrans) is the wavelength dependent Purcell factor for a given transmission wavelength and S0i(λ) is the spectral shape representing the transition i, which is here the average of an ensemble of molecules. We assume that the spectrum of transition i under ambient conditions at the ensemble level can be described by a Gaussian.43,44 Our model also implies that the resonator has no impact on both, the mechanisms of inhomogeneous broadening and the intrinsic eigenfrequency of the electronic transition dipole moment due to the weak coupling to the optical fields. The degree of inhomogeneous broadening for an ensemble spectrum is dependent on the interaction of the molecule with its chemical environment in a matrix, the temperature, and the ratio between the rate of spectral diffusion and the integration time. None of these parameters are altered when the experiments are performed in the resonator with respect to free space. Additionally, we assume that a transition into a higher vibronic level has a spectrum with a larger FWHM due to an increasing number of phonons accompanying the electronic transition.
Access to quantitative decay rate constants can be gained by measuring the fluorescence lifetimes of the molecules for respective transmission wavelengths  in free space ktot. The total decay rate is composed of the modified radiative rate constants for the single electronic transitions based on eqn (2):
 | (2) |
 is the non-radiative contribution, which is independent of the Purcell effect but dependent on the distance between the emitter and the metal surfaces. The evaluation method for determining the free space spectral shapes S0i and the decay rates of each process is based on reproducing the measured spectral shapes S0(λ) and decay constants ktot of the fluorescence in free space and for various cavity lengths the spectral shapes S*(λ,λtrans) and decay constants
  . This is done by a global fitting procedure, which first fits the spectral parameters for the individual bands for the free space spectrum. Second, the resonator shaped spectra and the respective transition rates are calculated using the Purcell factor for each transmission wavelength. Third, the deviation between the resulting simulated spectral shapes/total decay rates and the measured spectral shapes/decay rates is minimized by varying the respective spectral parameters for the Gaussians and the quantum yield. The benefit of this method is that the evaluation is completely independent of intensity dependent parameters such as the excitation power or the number of molecules in the focal volume.29,30,34 Since the intensity ratio of the vibronic bands given by the spectral shape of one and the same spectrum only depends on P(λ,λtrans) and their given intensity ratio in free space their spectral parameters can be determined by the outlined fitting procedure. A detailed description on the deduction of the used model function is given in the ESI.†
2. Results
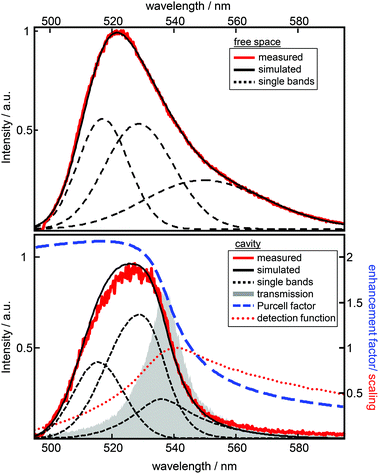
Experimentally, a large number of fluorescence spectra and decay curves are recorded at various resonator configurations for the global fitting-algorithm. The used procedure, performed in the energy regime, optimizes the parameters of the Gaussians representing the free space spectral bands as shown in Fig. 2 and further the values for the respective rate constants. For a more detailed description of the confocal microscope and the resonator design see the ESI.† In Fig. 2 the impact of a λ/2-microresonator with a transmission wavelength around 540 nm on the fluorescence spectrum is demonstrated. In the upper panel the free space fluorescence spectrum of Atto488 in a PVA-matrix (red lines) is shown and can be described by the superposition of three Gaussians (black dashed curves). The spectral appearance of an electronic transition is modified, first, by an altered fluorescence intensity according to the overlap of the respective band with the Purcell factor (eqn (1)). Hence, an additional detection function is required to take into account the angular distributed fluorescence and the angle dependent collection efficiency of the objective lens. Since a molecule can emit not only into the longitudinal mode of the resonator but also into the off-axis modes, whose wavelengths are blue shifted with respect to the longitudinal mode, the signal collected by the objective lens has an increasing blue shifted tail with increasing NA. In the lower panel of Fig. 2 the fluorescence spectrum (red line) is shown for a transmission wavelength around 540 nm as indicated by the gray shaded Lorentzian together with the calculated Purcell factor (blue curve), the detection function (red dots) and the modified spectral bands (black dashed lines) from the upper panel. It can be seen that the contribution around 549 nm is nearly completely suppressed by the Purcell factor, while the contribution around 530 nm is enhanced.Hence, the cavity dependent fluorescence spectrum can be calculated from the measured free space spectrum and the respective transmission spectrum of the resonator. In Fig. 3a sequences of measured (a) and calculated (b) fluorescence spectra are shown as a function of the measured transmission wavelength of the resonator. Each simulated spectrum is based on the modification of the same three Gaussians from Fig. 2. The respective measured on-axis transmission wavelengths λres are displayed as gray circles and were acquired by Lorentzian linefits to white light transmission spectra at the very same resonator setting at which the respective fluorescence spectra were recorded.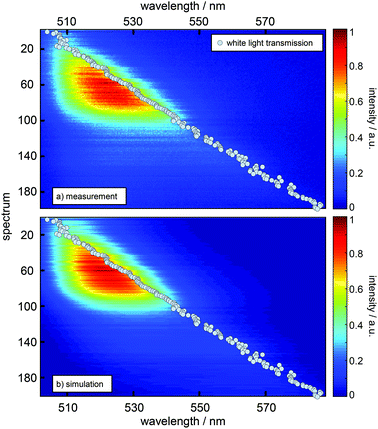 | ||
| Fig. 3 Comparison of a sequence of measured emission spectra (a) and a sequence of calculated spectra (b) as a function of the resonance wavelength (grey dots) as obtained from the on-axis transmission recorded for the respective resonator setting. The y-axis represents the number of acquired spectra in this series and scales with the stepwise increase of mirror separation. Each spectrum in (b) is composed of the same three Gaussian vibronic bands as in Fig. 2 with relative intensities scaled by the Purcell factor calculated for the respective resonance wavelength and detection function. | ||
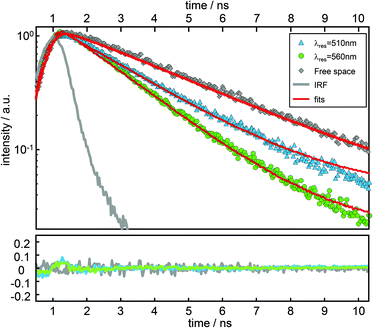
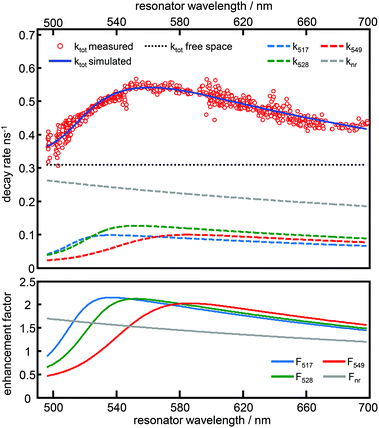
In Fig. 4, time resolved fluorescence decay curves for free space and the resonator settings λres = 510 nm (blue) and 560 nm (green) are shown together with mono-exponential curves (red curves) fitted to the data by the convolution of the model function with the instrument response function (gray line). In the upper panel of Fig. 5 we show the quantitative evaluation of all experimental decay rates as a function of the cavity resonance, whereby the total decay rate is enhanced for all resonator settings with respect to free space. Hence, an enhanced non-radiative decay of the excited emitter, induced by a decreasing mirror–emitter separation must be also taken into account, which reflects quenching by the silver surface with decreasing mirror separation. With decreasing transmission wavelengths, the distance between the emitters and the silver mirrors are also decreasing and thus enhance near-field coupling between the molecule and the metal surface. As a reasonable assumption, we model the course of the non-radiative decay rate as a function of transmission wavelength with respect to the r−3-distance dependency of the near-field amplitude.8,45,46 Thus, in the lower panel of Fig. 5 the respective enhancement and inhibition for each relaxation mechanism including the non-radiative decay due to quenching by the metal mirrors is shown. The total decay rates in the cavity (red dots) as a function of transmission wavelengths are in excellent agreement with the superposition of the individual relaxation processes, which are the three radiative transitions (blue, green and red dashed curves) and the non-radiative decay (gray dashed line).
As can be seen in Fig. 3 and 5, both simulations accurately reproduce the fluorescence properties of Atto488 embedded in a tunable λ/2-microresonator. The quality of the fitting procedure is based on a large number of recorded datasets (800 fluorescence spectra and decay curves) allowing us to also determine the non-radiative relaxation rate constant as a function of transmission wavelength.
3. Discussion
The impact on the spectral behavior of the cavity embedded fluorophore is in agreement with several previous studies such as the spectral shaping and the modification of the radiative decay rate.23,28,47 Additionally, the behavior of the non-radiative rate is in accordance with the results of other studies.9,48–50 A major difference between our photonic microresonators and plasmonic nanoantennas is the separation of the molecules from the metal. In our experiment, we reach a minimum emitter–metal separation of 60 nm (for resonator on-axis transmission of 500 nm). Hence, the near-field of the molecule at the mirror surface (silver) is small just as the spectral overlap between the fluorescence of the molecule and the plasmon resonance of silver. Therefore quenching due to dissipative energy transfer to the metal plays a minor role. In contrast, for very close metal–molecule proximity as in plasmonics (<10 nm), near-field coupling or the coupling to non-radiative or evanescent modes, which can lead to quenching has to be taken into account. This means, the far-field contribution of the LDOS at the position of the emitter mainly determining the observed spectral properties is induced by the mirror separation of the cavity and the mirror–mirror separation, while a weak near-field contribution is induced by the presence of silver surfaces, whose plasmonic impact on the spectral properties is negligible and independent of the mirror–mirror separation.4,16To date, the quantitative and rigorous separation between radiative and non-radiative relaxation processes for fluorophores in one and the same experimental series could not be performed to the best of our knowledge in the spectral and time-domain. However, numerical simulations are able to reproduce the total decay rates of excited organic dyes within λ/2-microresonators in order to determine the free space quantum yield.23 For Atto488 in an aqueous solution, the quantum yield was determined by Chizhik et al. to be 70%, who performed their experiments in aqueous solution in contrast to our experiments that were performed in a PVA-matrix.
Our study demonstrates that we can correlate the spectral distribution and the decay mechanisms of a fluorescent dye molecule under ambient conditions at the ensemble level and we find a quantitative agreement with our simulations. This could be accomplished at the ensemble level, under ambient conditions, on a system with largely inhomogeneously broadened overlapping fluorescence bands and with a finely tunable and simple to build photonic device avoiding chemical interaction with the molecules. Also, our approach does not require high excitation fluxes or cryogenic temperatures. Under such conditions emitters can show dramatically altered spectral behavior with respect to ambient conditions and free space hampering the extrapolation to normal conditions. The advantage of using excitation power independent properties is obvious that for low excitation power at the ensemble level, the quality of the results can be enhanced due to the possibility of recording a large number of datasets in different controllable environments.
Our approach also describes the effective perturbation on the examined system and the kinetic relaxation parameters requiring only a large number of recorded datasets due to the fitting procedure. However, tuning and controlling the cavity resonance is easy and reproducible with our resonator design and allows us to record more than the required number of datasets. By finally combining the spectral and temporal information we are able to gain a deeper insight into the dynamics of the vibronic progression of a fluorescence spectrum and furthermore to have the opportunity to tune controllably the near- and far-field induced photonic influence of our resonators on the deactivation mechanisms of the excited fluorophores.
Acknowledgements
Financial support from the German Research Council (DFG) for ME1600/13-1 and Heisenberg-Programm (BR 4102/1-1 and BR 4102/2-1) is gratefully acknowledged.References
- K. J. Vahala, Nature, 2003, 424, 839–846 CrossRef CAS PubMed.
- M. Barth, S. Schietinger, S. Fischer, J. Becker, N. Nusse, T. Aichele, B. Lochel, C. Sonnichsen and O. Benson, Nano Lett., 2010, 10, 891–895 CrossRef CAS PubMed.
- G. M. Akselrod, C. Argyropoulos, T. B. Hoang, C. Ciraci, C. Fang, J. Huang, D. R. Smith and M. H. Mikkelsen, Nat. Photonics, 2014, 8, 835–840 CrossRef CAS.
- A. Konrad, M. Metzger, A. M. Kern, M. Brecht and A. J. Meixner, Nanoscale, 2015, 7, 10204–10209 RSC.
- P. Lodahl, A. F. van Driel, I. S. Nikolaev, A. Irman, K. Overgaag, D. Vanmaekelbergh and W. L. Vos, Nature, 2004, 430, 654–657 CrossRef CAS PubMed.
- P. Zijlstra and M. Orrit, Rep. Prog. Phys., 2011, 74, 106401 CrossRef.
- J. R. Lakowicz, J. Malicka, I. Gryczynski, Z. Gryczynski and C. D. Geddes, J. Phys. D: Appl. Phys., 2003, 36, R240–R249 CrossRef CAS PubMed.
- A. M. Kern, D. Zhang, M. Brecht, A. I. Chizhik, A. V. Failla, F. Wackenhut and A. J. Meixner, Chem. Soc. Rev., 2014, 43, 1263–1286 RSC.
- P. Anger, P. Bharadwaj and L. Novotny, Phys. Rev. Lett., 2006, 96, 113002 CrossRef PubMed.
- A. M. Kern and O. J. F. Martin, Nano Lett., 2011, 11, 482–487 CrossRef CAS PubMed.
- M. Frimmer, Y. T. Chen and A. F. Koenderink, Phys. Rev. Lett., 2011, 107, 123602 CrossRef PubMed.
- M. Brecht, M. Hussels, J. B. Nieder, H. Fang and C. Elsässer, Chem. Phys., 2012, 406, 15–20 CrossRef CAS.
- E. Fort and S. Gresillon, J. Phys. D: Appl. Phys., 2008, 41, 013001 CrossRef.
- X. Wang, K. Braun, D. Zhang, H. Peisert, H. Adler, T. Chasse and A. J. Meixner, ACS Nano, 2015, 9, 8176–8183 CrossRef CAS PubMed.
- R. Roy, S. Hohng and T. Ha, Nat. Methods, 2008, 5, 507–516 CrossRef CAS PubMed.
- F. Schleifenbaum, A. M. Kern, A. Konrad and A. J. Meixner, Phys. Chem. Chem. Phys., 2014, 16, 12812–12817 RSC.
- E. Schlodder, M. Hussels, M. Cetin, N. V. Karapetyan and M. Brecht, Biochim. Biophys. Acta, 2011, 1807, 1423–1431 CrossRef CAS PubMed.
- A. Konrad, A. L. Trost, S. Skandary, M. Hussels, A. J. Meixner, N. V. Karapetyan and M. Brecht, Phys. Chem. Chem. Phys., 2014, 16, 6175–6181 RSC.
- A. C. Millard, L. Jin, J. P. Wuskell, D. M. Boudreau, A. Lewis and L. M. Loew, J. Membr. Biol., 2005, 208, 103–111 CrossRef CAS PubMed.
- D. I. Schuster, A. Wallraff, A. Blais, L. Frunzio, R. S. Huang, J. Majer, S. M. Girvin and R. J. Schoelkopf, Phys. Rev. Lett., 2005, 94, 123602 CrossRef CAS PubMed.
- S. Noda, M. Fujita and T. Asano, Nat. Photonics, 2007, 1, 449–458 CrossRef CAS.
- S. Bär, A. Chizhik, R. Gutbrod, F. Schleifenbaum, A. Chizhik and A. J. Meixner, Anal. Bioanal. Chem., 2010, 396, 3–14 CrossRef PubMed.
- A. I. Chizhik, I. Gregor, B. Ernst and J. Enderlein, ChemPhysChem, 2013, 14, 505–513 CrossRef CAS PubMed.
- K. Becker, J. M. Lupton, J. Müller, A. L. Rogach, D. V. Talapin, H. Weller and J. Feldmann, Nat. Mater., 2006, 5, 777–781 CrossRef CAS PubMed.
- A. Laucht, F. Hofbauer, N. Hauke, J. Angele, S. Stobbe, M. Kaniber, G. Bohm, P. Lodahl, M. C. Amann and J. J. Finley, New J. Phys., 2009, 11, 023034 CrossRef.
- E. Fermi, Rev. Mod. Phys., 1932, 4, 87–132 CrossRef CAS.
- A. Caze, R. Pierrat and R. Carminati, Photonics and Nanostructures-Fundamentals and Applications, 2012, 10, 339–344 Search PubMed.
- A. I. Chizhik, A. M. Chizhik, A. M. Kern, T. Schmidt, K. Potrick, F. Huisken and A. J. Meixner, Phys. Rev. Lett., 2012, 109, 223902 CrossRef PubMed.
- M. Ringler, A. Schwemer, M. Wunderlich, A. Nichtl, K. Kurzinger, T. A. Klar and J. Feldmann, Phys. Rev. Lett., 2008, 100, 203002 CrossRef CAS PubMed.
- C. Sauvan, J. P. Hugonin, I. S. Maksymov and P. Lalanne, Phys. Rev. Lett., 2013, 110, 237401 CrossRef CAS PubMed.
- L. Aigouy, A. Caze, P. Gredin, M. Mortier and R. Carminati, Phys. Rev. Lett., 2014, 113, 076101 CrossRef CAS PubMed.
- P. Holzmeister, E. Pibiri, J. J. Schmied, T. Sen, G. P. Acuna and P. Tinnefeld, Nat. Commun., 2014, 5, 5356 CrossRef CAS PubMed.
- J. Wenger, D. Gerard, J. Dintinger, O. Mahboub, N. Bonod, E. Popov, T. W. Ebbesen and H. E. Rigneault, Opt. Express, 2008, 16, 3008–3020 CrossRef CAS PubMed.
- D. Cao, A. Caze, M. Calabrese, R. Pierrat, N. Bardou, S. Collin, R. Carminati, V. Krachmalnicoff and Y. De Wilde, ACS Photonics, 2015, 2, 189–193 CrossRef CAS.
- L. Shang, Y. Z. Wang, J. G. Jiang and S. J. Dong, Langmuir, 2007, 23, 2714–2721 CrossRef CAS PubMed.
- S. Chah, M. R. Hammond and R. N. Zare, Chem. Biol., 2005, 12, 323–328 CrossRef CAS PubMed.
- P. Winckler and R. Jaffiol, Anal. Chem., 2013, 85, 4735–4744 CrossRef CAS PubMed.
- W. E. Moerner and T. Basche, Angew. Chem., Int. Ed., 1993, 32, 457–476 Search PubMed.
- T. Basche, Single Mol., 2001, 2, 237–240 CrossRef CAS.
- G. Bjork, IEEE J. Quantum Electron., 1994, 30, 2314–2318 CrossRef CAS.
- A. Konrad, A. M. Kern, M. Brecht and A. J. Meixner, Nano Lett., 2015, 15, 4423–4428 CrossRef CAS PubMed.
- J. Lakowicz, Principles of Fluorescence Spectroscopy, Springer, 2006 Search PubMed.
- J. M. Hayes, J. K. Gillie, D. Tang and G. J. Small, Biochim. Biophys. Acta, 1988, 932, 287–305 CrossRef CAS.
- T. P. Krüger, V. I. Novoderezhkin, C. Ilioaia and R. van Grondelle, Biophys. J., 2010, 98, 3093–3101 CrossRef PubMed.
- R. R. Chance, A. Prock and R. J. Silbey, J. Chem. Phys., 1974, 60, 2744–2748 CrossRef CAS.
- A. Campion, A. R. Gallo, C. B. Harris, H. J. Robota and P. M. Whitmore, Chem. Phys. Lett., 1980, 73, 447–450 CrossRef CAS.
- M. Steiner, F. Schleifenbaum, C. Stupperich, A. V. Failla, A. Hartschuh and A. J. Meixner, J. Lumin., 2006, 119, 167–172 CrossRef.
- K. H. Drexhage, Sci. Am., 1970, 222, 108–118 CrossRef CAS.
- B. C. Buchler, T. Kalkbrenner, C. Hettich and V. Sandoghdar, Phys. Rev. Lett., 2005, 95, 063003 CrossRef CAS PubMed.
- E. Castanie, V. Krachmalnicoff, A. Caze, R. Pierrat, Y. De Wilde and R. Carminati, Opt. Lett., 2012, 37, 3006–3008 CrossRef CAS PubMed.
Footnote |
| † Electronic supplementary information (ESI) available. See DOI: 10.1039/C6NR02380K |
| This journal is © The Royal Society of Chemistry 2016 |

