 Open Access Article
Creative Commons Attribution 3.0 Unported Licence
The interaction with gold suppresses fiber-like conformations of the amyloid β (16–22) peptide†
Luca
Bellucci
*ab,
Albert
Ardèvol
cd,
Michele
Parrinello
cd,
Helmut
Lutz
e,
Hao
Lu
e,
Tobias
Weidner
e and
Stefano
Corni
*bd
aDipartimento FIM, Università di Modena e Reggio Emilia, I-41125, Modena, Italy. E-mail: luca.bellucci_s3@unimore.it
bCentro S3, CNR-NANO Istituto Nanoscienze, I-41125, Modena, Italy. E-mail: stefano.corni@nano.cnr.it
cDepartment of Chemistry and Applied Biosciences, ETH-Zurich, Switzerland
dFacoltà di Informatica, Istituto di Scienze Computazionali, Università della Svizzera Italiana, CH-6900, Lugano, Switzerland
eMax Planck Institute for Polymer Research, D-55128 Mainz, Germany
First published on 17th March 2016
Abstract
Inorganic surfaces and nanoparticles can accelerate or inhibit the fibrillation process of proteins and peptides, including the biomedically relevant amyloid β peptide. However, the microscopic mechanisms that determine such an effect are still poorly understood. By means of large-scale, state-of-the-art enhanced sampling molecular dynamics simulations, here we identify an interaction mechanism between the segments 16–22 of the amyloid β peptide, known to be fibrillogenic by itself, and the Au(111) surface in water that leads to the suppression of fiber-like conformations from the peptide conformational ensemble. Moreover, thanks to advanced simulation analysis techniques, we characterize the conformational selection vs. induced fit nature of the gold effect. Our results disclose an inhibition mechanism that is rooted in the details of the microscopic peptide–surface interaction rather than in general phenomena such as peptide sequestration from the solution.
1. Introduction
The heptapeptide Aβ16–22 (sequence: KLVFFAE)‡ is a fragment from residue 16 to residue 22 of the full-length amyloid β peptide (Aβ).1 The latter (featuring various alloforms, the most important being Aβ40 and Aβ42) is the basic constituent of the amyloid plaque characteristic of Alzheimer's disease.2 In aqueous solution Aβ16–22 does not have a specific conformation, but it is able to aggregate into amyloid fibrils with high β-sheet structure content.3,4 Because of its propensity to self-assemble, Aβ16–22 is well suited as a model system for probing the mechanisms of aggregation by using experimental3–9 and theoretical10–21 approaches. For example, it was possible to determine that Aβ16–22 in aqueous solution self-assemble to form fibrils by a direct transition from a random coil state to a β-sheet structure.9 The fibrillation process of Aβ16–22 is promoted by the presence of the sequence LVFFA22 which also constitutes the hydrophobic core of the full-length Aβ peptide. Aβ16–22 represents therefore a key system to understand the more complex fibrillation processes of Aβ.It is well-known that the fibrillation process of this (and of other) peptide can be affected by the environmental conditions. For example, the self-assembling of Aβ16–22 can be manipulated by tuning the protonation state of the terminal residues (i.e., K and E) by a pH change, and/or capping the charged terminal, that are hydrophilic groups.5,12,23 At acidic pH the uncapped Aβ16–22 peptides self-assembled into nanofibrils, whereas the capped ones formed nanotapes.5 Recently, the interaction with nanoparticles (NPs) and inorganic surface24,25 has been identified as a further environmental condition that can strongly affect the fibrillation propensity of peptides and proteins.26 Depending on the nature of the nanoparticle and the protein/peptide considered, either acceleration or inhibition of the fibrillation process was obtained. Limiting ourselves to Aβ peptides, various NPs have been investigated, obtaining acceleration of fibrillation,27–29 its retardation,27,28,30–35 or both effects depending on the relative peptide/NP concentrations.36,37 Despite the extensive experimental evidence, the underlying molecular mechanism determining the role of nanoparticle is mostly unknown. A general mechanism accelerating fibrillation has been proposed early:38,39 when the nanoparticle binds the peptide/protein, the local concentration on the NP surface is higher than in solution, making the formation of critical fiber nuclei easier. In contrast, mechanisms leading to inhibition of folding are less general36,37,40,41 and much less well-characterized. A concentration-dependent mechanism that has been suggested is the sequestration of the peptide from the solution.37,42 Another important piece of information is that for peptides, the propensity to fibrillate is related to their propensity to assume fiber-like conformations at the single peptide level.37,43,44 This has been established largely by coarse-grained simulations validated against experiments, also in the presence of surfaces.37 Therefore, we propose that a mechanism leading to inhibition of fibrillation consists of the reduction of the population of fiber-like conformations upon interaction with the surface/nanoparticle.
We have recently demonstrated that the interaction with a gold surface can re-shape the internal free-energy landscape (and thus the conformational ensemble) of the prototypical alanine dipeptide.45 To identify the effect of the interaction with inorganic materials on the conformational ensemble of a fibrillogenic peptide, we study the conformational ensemble of Aβ16–22 in bulk solution and when adsorbed on the Au(111) surface by means of enhanced sampling atomistic simulations. Au(111) is the most stable surface of gold, and the most frequently occurring in nanoparticles.46 In particular, we have used Parallel Tempering47,48 combined with Metadynamics49,50 to effectively explore the conformational space of the peptide, and its perturbation due to the interaction with gold. To characterize such multi-dimensional conformational space, we have analyzed the outcome of the simulations using a recently proposed dimensionality-reduction technique, called sketch-map analysis,51–54 whose usefulness to interpret the behavior of complex polypeptides has been recently shown.55 Fiber-like conformations turn out to be suppressed by the interaction with the surface, suggesting that inhibition of fibrillation is possible. Moreover, we could identify the molecular mechanism leading to this result. Our findings are corroborated by X-ray Photoelectron Spectroscopy (XPS) and Sum-Frequency Generation (SFG) experiments, and are in agreement with existing experimental evidence showing that inorganic species able to engage the LVFFA segment of Aβ, such as fullerenes,56,57 are indeed able to inhibit fibrillation.
2. Methods and computational details
All simulations were performed with Gromacs58 (v4.5.3) in conjunction with the PLUMED59 (v1.3) plug-in. Analyses were performed with Gromacs tools and VMD.60 The peptide and gold surface were treated with GolP FF,61,62 a force field that was specifically parameterized to describe peptide–Au(111) surface interactions. GolP employs OPLS/AA for the peptide and that gave good results compared with experiments for the amyloid β peptide.63,64 The initial conformation of the Aβ16–22 segment (i.e. residues KLVFFAE) was extracted from the first NMR structure deposited at the protein data bank (PDB code 1IYT). The peptide was modeled in the zwitterionic form with an N-terminal of NH3+ and a C-terminal of COO−; the lysine side-chain was protonated and the glutamic acid side chain was deprotonated.The simulations were performed in explicit solvent using SPC65 water. The total number of water molecules was 2773 in a rectangular box of dimensions 41 × 41 × 62 Å3. The simulations were conducted using periodic boundary conditions (PBC), in all the three dimensions. The long-range part of the electrostatic potential was treated with the Particle Mesh Ewald (PME) sum with a grid size of 42 × 42 × 64. The cut off distance for non-bonded interactions was set to 10 Å and a switch function was applied to smooth interactions between 9 and 10 Å. The integration time step was set to 2 fs and all bonds were treated as holonomic constraints using the LINCS algorithm.66
The equilibration protocol consisted of several steps. First the peptide (i.e., KLVFFAE) was placed in the middle of the box, which contains water and a gold slab (exposing the (111) face and composed of five layers) and was minimized by 3000 steps using the steepest descent algorithm. The coordinates thus obtained were used to perform 100 ps of MD simulation in the NVT ensemble (temperature 300 K) with protein heavy atoms restrained. 200 ps without restraints were then performed in the NPT ensemble (pressure 1 atm, temperature 300 K). The final conformation was used to perform 200 ps in the NVT (temperature 300 K) ensemble, obtained via the stochastic velocity-rescaling thermostat.67
2.1. Parallel-tempering metadynamics
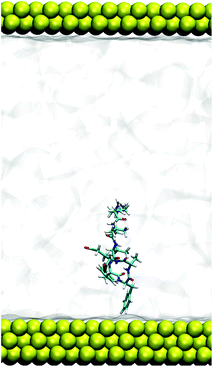
Because of the large number of degrees of freedom and the different kinds of interactions of the system under study (i.e. protein–protein, protein–gold, protein–water etc.) the mere use of standard MD does not ensure a sufficient conformational sampling of the system (Fig. 1).As already stated in the Introduction, to ensure an adequate sampling, we used Parallel Tempering47,48 molecular dynamics together with MetaDynamics49,50 (PTMTD). Following such a protocol, 16 copies of the system (replicas) are simulated concurrently at different temperatures (see below for details). Exchanges of the configurations of neighboring replicas are attempted at fixed intervals, and are accepted or rejected by means of a Metropolis test so as to ensure the correct sampling of the equilibrium ensemble. Using high temperatures it is possible to accelerate the crossing of the conformational energy barriers of the protein, and to have faster diffusion. In metadynamics, a history-dependent bias potential is added regularly during the simulation along some selected collective variables (CVs) so as to disfavor the visit of already visited states and enhancing the sampling. It is possible to demonstrate50,68 that this bias converges to the free-energy landscape along the CVs, up to a constant.
To set up the enhanced sampling simulation, the last conformation obtained from the equilibration protocol was replicated 16 times. The replicas were simulated with parallel tempering (PT) for 2 ns; the temperatures of the replicas spanned between 300 and 366 K. The exchange between replicas was attempted every 300 steps, i.e. 0.6 ps.
Parallel-tempering metadynamics (PTMTD)49 was performed starting from the replicas obtained by the previous parallel tempering equilibration. The setup of the parallel tempering protocol was the same as in the equilibration run. All replicas were simulated by metadynamics using as CV the projection along the z coordinate of the distance between center of mass (COM) of the peptide and the gold surface. In this way, surface and bulk-water conditions are sampled with statistically relevant probabilities. The width and the height of the Gaussian functions were set at 0.35 Å and 2 kJ mol−1 respectively. The bias potential was regularly updated at every 5 ps intervals throughout the simulation. After 78 ns of metadynamics the height of the Gaussian functions was scaled to 1 kJ mol−1 to refine the energy profile. Each replica was simulated for 140 ns yielding an aggregated total time of 2.2 μs. The mean acceptance ratio evaluated at the end of the PTMTD simulation was 18%. The reconstruction of the free-energy profiles was performed with the PLUMED plugin.69 To estimate the accuracy of the reconstructed free energy profile, we first generated the free energy profiles (as the sum of the deposited hills) every 1 ns excluding the first 50 ns of metadynamics, then we aligned such profiles following the results of ref. 70 and finally, for selected COM–Au distances placed every 2 Å, we calculated the error by block-averaging the free-energies obtained for those distances at different times. The free energy of adsorption was obtained from the free-energy profile as described by Schneider et al.71 Such a procedure requires to define the range of COM–Au distances corresponding to the adsorbed peptide. The lower boundary of this COM–Au distance range was here chosen to be 0; the higher boundary was chosen as the COM–Au distance where the free energy profile is 2.4 kJ mol−1 (i.e., kT) below the bulk solution free-energy.
2.2. Setup of the sketch-map analysis
The analysis of the conformational ensemble of a flexible peptide as Aβ16–22 is far from being straightforward. Conformations are defined in a high dimensional space (even considering only the backbone dihedral angles Φ and Ψ, a 7 aa peptide like Aβ16–22 requires 12 angles, i.e., a 12-dimensional space). While it is reasonable to suppose that the peptide conformations are still clustered in basins,51 it is not obvious how to choose a manageably small set of order parameters (collective variables) that allows to discriminate them. Recently, a procedure to map the high-dimensional (high-D) conformational space to a 2D space by keeping the relevant elements of the high-D space structure has been proposed and successfully applied to problems in different fields.51–54 The basic idea consists of: defining a distance between structures in the high-D space (here the circular distance in the backbone torsional angle space), associated to each conformation in the high-D space a point in the Cartesian (2D) space and arranging these points in such a way that the Euclidean distances between them reproduce at best (in a sense that will be clarified shortly) the distances in the high-D space.In general it is not possible to preserve in the 2D space all the distances of the high-D space, so what is really required is that the high-D distances that are smaller than a typical, user-defined threshold length σ are mapped to 2D distances that are also smaller than σ, and vice versa. By judiciously choosing σ, and a few other numerical parameters that control the numerical mapping, the set of representative points distribute on the Cartesian plane conserving the main features of basins in the high-D space (for this property, such sets have been called sketch-maps), providing a manageable way to identify changes in the conformational ensemble as a response to external perturbations (such as the surface). We refer the reader to the original work51 for a comparison of sketch-maps with other dimensionality reduction techniques such as principal component analysis.
Sketch-map analysis has been performed via the suite of programs distributed from the web-site http://epfl-cosmo.github.io/sketchmap/. A snapshot every 2 ps was saved from the trajectory of the lowest temperature replica in the PTMTD, and the values of the 12 backbone angles in each such snapshot was extracted. The high-D distance was defined as previously51 and fully takes into account the dihedral angle periodicity. 1000 landmark points in the 12-dimensional space defined by these angles were selected according to the staged algorithm54 with gamma = 0.1. Since the landmark points were selected from the whole trajectory (i.e. from the peptide-adsorbed, the peptide-solvated and the intermediate states), the same numerical transformation can be used to produce the sketch-maps associated to the conformational ensembles of all states, making their comparison straightforward. The sketch-map was built by minimizing the stress function reported in ref. 51 for the landmarks using a distance threshold σ = 2.5, and aD = bD = 7 for the sigmoid function of high-dimensional distances and ad = 2, bd = 7 for the sigmoid function of bidimensional distances (see ref. 51 for definitions). σ, the most important parameter in defining the sketch-map, was determined by trial-and-error, aD/d and bD/d were chosen on the basis of previous experience and were not optimized further. The sketch-map that refers to bulk behavior was obtained from the projection on the 2D space of the PTMTD snapshots where the COM–gold distance was larger than 22 Å and the sketch-map for the peptide on the surface was obtained from snapshots where the COM–gold distance was ±1 Å of the minimum free-energy distance (4.7 Å).
2.3. XPS and SFG experiments
3. Results and discussion
3.1. Adsorption free-energy profile
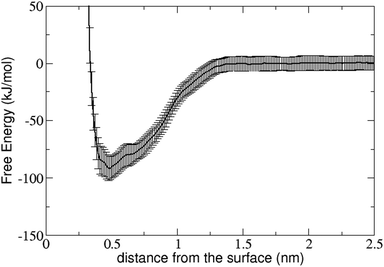
Adsorption free-energy profiles were calculated previously for other peptides71 but not in the context of amyloidogenesis. The adsorption free energy profile along the chosen CV (the metal–peptide distance) is shown in Fig. 2. The profile has been obtained by averaging the results at the two gold/water interfaces present in the simulated system, the error bars represent the accuracy of the free energy calculated as described in the previous section.In the range 1.5–2.5 nm, the interactions between the surface and the peptide are negligible. At 2.5 nm the peptide is equidistant from both gold surfaces and the corresponding free energy value was taken as zero. At 1.5 nm the peptide starts to interact with the metal surface and the free energy decreases. At lower distances the free energy profile shows some irregularities, different for the two interfaces. These irregularities might suggest that the peptide during the adsorption process can approach and finally adsorbs onto the gold surface in a series of different conformations/orientations. However, these irregularities are comparable to the extent of the error bars of the free energy, therefore no definitive conclusion can be drawn.
The absolute minimum is located at 0.47 nm from the gold surface. At this distance Aβ16–22 is completely adsorbed onto the gold surface. We have calculated the adsorption free energy as discussed in ref. 71, obtaining a value of −62 ± 16 kJ mol−1. There are no experimental data to compare directly with. Typical adsorption free-energy values for other dodecapeptides at polycrystalline (vs. single plane (111)) surfaces are in the same range but somewhat smaller, around −40 kJ mol−1.74,75 Certainly the presence of other Au faces in the experiments decreases the affinity with respect to Au(111),76–78 and the highly charged nature of the experimentally measured dodecapeptides may also contribute to reduce their adsorption by creating unfavorable peptide–peptide Coulomb repulsion effects as well as substantially improving the solvation free energy. Finally, part of the difference may be due to the force field, since the original GolP force field tends to overestimate the binding free energies in solution with respect to the more recent GolP-CHARMM.76,79
3.2. Conformational analysis on the basis of the end-to-end distance
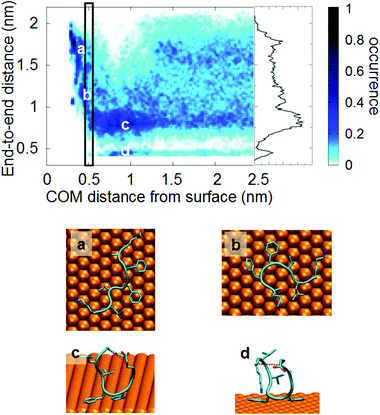
In this section we shall present an analysis of the conformational changes upon adsorption based on a standard collective variable for a floppy peptide, i.e., the end-to-end distance. Although its descriptive power is quite limited, it provides a first glimpse of what happens to the peptide conformational ensemble. In the next section, we shall use instead an analysis technique specifically designed to study conformational ensembles and their changes. The end-to-end distance d of the peptide is here defined as the distance between the terminal Cα atoms (dotted red line in Fig. 3d).The distribution of the end-to-end distance by the bias of the metadynamics as a function of the COM–gold distance is reported in Fig. 3. Not surprisingly, the end-to-end distance is not effective in defining the conformational basins in bulk solution: when the peptide is far from the surface, the distribution of end-to-end distance spans a large interval with a quite homogeneous distribution, possibly with a maximum around 0.8 nm and with a distinct region below 0.6 nm. Nevertheless, when the peptide comes closer to the surface, the distribution of end-to-end distance becomes more structured. We can recognize roughly 4 regions of end-to-end distances: (a) completely elongated with d greater than 1.2 nm, (b) partially elongated with d between 1 nm and 1.2 nm, (c) partially closed with d between 0.6 nm and 1 nm (Fig. 3(c) and (d)) completely closed (i.e. U shape)80 with d lower than 0.6 nm (Fig. 3(d)). Visual inspection shows that within each d interval, various backbone conformations co-exist. It is worth noting that the partially closed conformations (Fig. 3(c)) are stabilized by a salt bridge between the long side chain of the LYS residues and the carboxylic groups of the C-terminal tail or GLU residue, whereas the completely closed conformations (Fig. 3(d)) are stabilized by a salt bridge between the N-terminal and the same carboxylic groups (i.e. C-terminal tail or GLU residue).
At short distances from the surface (closer than 1.2 nm) Aβ16–22 starts to interact with the surface. Usually the FF motif (which shows high affinity towards the metal surface) is adsorbed to the surface, whereas charged groups (i.e. terminal residues) point towards the solvent. In this region the most populated states are the partially closed (Fig. 3(c)) and the closed conformers (Fig. 3(d)). The elongated conformers are not present.
At a distance lower than 0.5–0.6 nm the peptide is completely adsorbed and starts to populate the elongated and partially elongated conformer states (Fig. 3(c and d)). While end-to-end distance may convey some useful information, the picture of the peptide conformational ensemble that it provides is rather partial, and more advanced analysis techniques, like that presented in the next section, are needed.
3.3. Effect of the adsorption on the peptide conformations: conformational selection vs. induced fit
In the previous section, we have described some of the changes in the structural properties of the peptide as a function of the distance from the surface via the end-to-end distance. It is clear, from that analysis, that the conformational ensemble is modified upon adsorption on the surface. However, the use of a single, structural descriptor is certainly not enough to characterize the peptide conformations. Indeed, sketch-maps51,54 will be used here to analyze the effect of the adsorption on the peptide conformations. Analogously to intrinsically disordered proteins and peptides that bind to a biological partner,81,82 two extreme cases can be defined.83 In conformational selection,84 the “biological partner” (the surface here) would bind only a subset of the conformations that exist in solution; in induced fit,85 it would instead induce new conformations that do not belong to conformational basins of bulk solution. The first issue that we shall address here is whether the interaction with the surface is akin to conformational selection, induced fit or an intermediate case.The sketch-map for the molecule in solution (i.e., when the COM–gold distance is greater than 2.1 nm) is presented in Fig. 4(a) in terms of normalized density of conformations. The conformations that characterize each basin are shown in Fig. S1,† showing that indeed the sketch-map preserves the basin repartition of the high-D space. Populations for the major basins are also given in Fig. S1;† none of the basins collect more than 10% of the total population, showing that this peptide is floppy and lacks a dominant conformation. Fig. 4(b) shows the sketch-map for the peptide on the surface (i.e., when the COM is within ±1 Å from the COM–surface distance corresponding to the minimum of the free energy). First, by comparing the two sketch-maps in Fig. 4(a) and (b), we note that indeed the surface changes sizably the conformational ensemble of the peptide. The comparison between the two sketch-maps (in solution and on the surface) allows us to address the question whether the binding to the surface is more similar to conformational selection or to induced fit. First, we note that there are indeed peptide conformations in water that are conserved also on the surface, i.e., some portion of the maps of Fig. 4(a) and (b) are similarly populated. In particular, the basin identified by the basin labeled 2 is the most populated both in solution and on the gold surface (with a similar population, around 10%), albeit the center of the basin undergoes a small shift in the CV plane. However, many other well populated basins in solution disappear on the gold surface (e.g., basin 1), i.e., many conformations that exist in solution are not bound by the surface. In this respect, the binding process resembles the conformational selection mechanism, where some conformations do not participate in the binding. On the other hand, a pure conformational selection would require the sketch-map at the surface to be a sub-set of that in water. This is clearly not the case since new spots (i.e., conformational basins) appear on the surface sketch-map that are not present in bulk water (see, e.g., the spot marked by arrow 3). Therefore, the surface is inducing new conformations, i.e., an induce-fit mechanism is also at work. We can characterize the conformational ensemble changes due to the surface as intermediate between an induced fit and a conformational selection one.
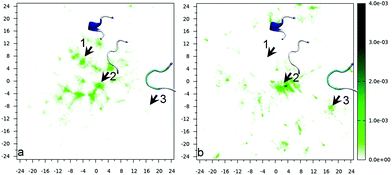 | ||
| Fig. 4 Sketch-map for Aβ16–22 in (a) bulk solution and (b) on the surface. The three arrows, labeled 1, 2 and 3, mark basins that change in three different ways passing from bulk to surface (1 is suppressed, 2 is almost unaffected – slightly shifted – and 3 is enhanced). Structures selected from the conformational basins 1, 2 and 3 are shown as insets in the panels. Representative structures for the other basins and basin populations are shown in Fig. S1.† The colour bar denotes the relative population. | ||
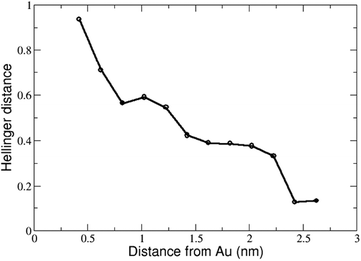
To quantify the changes of the conformational ensemble continuously from bulk solution to the surface, we have calculated the Hellinger's distance between the sketch-map in bulk solution and those at various COM heights. The Hellinger distance H[f,g] is a measure of the overlap of two normalized distributions f(Q) and g(Q), function of a set of variables Q:
 | (1) |
It is symmetric with respect to f and g, and yields a number between 0 (identical distributions) and 1 (no overlap). All the structures of the peptide found at varying values of COM distance to the gold surface were projected on the sketch-map to obtain the conformational population density of all the possible intermediate ensembles. By applying this distance definition we were able to show that the sketch-map changes almost monotonically from solution to surface, as shown in Fig. 5.
The distance between two sketch-maps both taken in bulk solution but at different COM positions turns out to be 0.1 (rightmost values in Fig. 5). We can take this value as a measure of the statistical uncertainty on the sketch-maps (in fact, without statistical noise the distance between two sketch-maps both in bulk solution would be 0). This confirms that the changes in the sketch-map upon adsorption (reaching a Hellinger distance of 0.9, leftmost value of Fig. 5) are well-beyond the level of statistical noise.
3.4. Effect of the adsorption on fibril-like conformations
The second issue that we want to address is whether the conformational space as modified by the surface is enriched or depleted of conformations that resemble amyloid fibers. To this end, we have calculated the backbone dihedral similarity s between an experimental structure of the peptide in a fiber and each member of the conformational ensembles of Aβ16–22 in the bulk and on the surface. Such similarity s is defined as: | (2) |
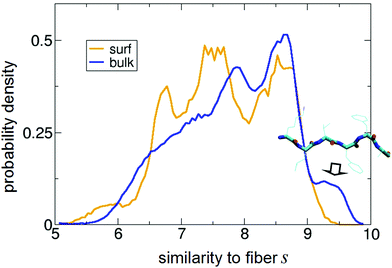 | ||
| Fig. 6 Normalized distribution of s obtained for the peptide on the surface (“surf”) and in bulk water (“bulk”). s = 10 corresponds to perfect matching with the backbone angles of the 2Y29 fiber structure of Aβ16–21.86 In the inset, a representative PTMD structure with s = 9.6 is shown. It highlights the clear β-strand (i.e., fiber-like) character of the conformations contributing to the peak indicated with the arrow. | ||
The most interesting region of such a plot is for s close to 10, i.e., for perfect similarity with the experimental structure. First, it is apparent that in solution the peptide does assume fiber-like conformations (represented by the peak centred at s ≈ 9.5), in agreement with its propensity to fibrillate. But the most important result comes from the on-surface distribution: the bulk peak at 9.5 fully disappears, showing that the adsorbed state is in fact strongly depleted of fiber-like conformations with respect to the water case. In other words, the interaction with the surface is suppressing fiber-like structures. It is also apparent that such population is replaced by new peaks in the region between 6.5 and 7.5 (i.e., having several backbone angles far from those in the fibers).
To strengthen our analysis, we have also projected all the existing experimental fiber structures on the sketch-maps in the bulk and on the surface. The results, reported in Fig. S2,† show that fiber-like structures sit in sketch-map regions that are populated for the peptide in the bulk and empty for the adsorbed peptides, confirming the picture just described.
This finding suggests that the intrinsic effect of the surface is to inhibit fiber formation, although one should not forget a possible opposite effect due to the increased local concentration of peptides following the adsorption from the solution of several peptide molecules.39 The free-energy profile in Fig. 2, in fact, shows that the surface has a high propensity to bind Aβ16–22 from the solution.
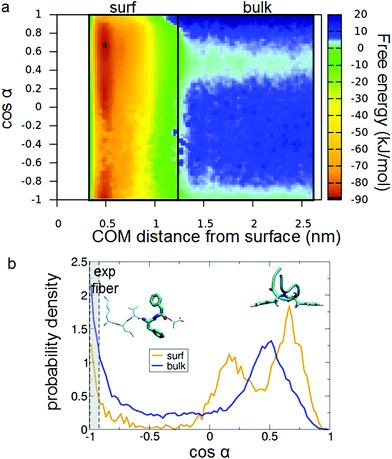
What is the driving force of this fiber-conformation suppression? The affinity of Au(111) for PHE88 and the presence of two contiguous PHE's in the Aβ16–22 peptide suggest a role for such residues. We can define their relative orientation in terms of the angle α between the Cα–Cβ bonds, as presented in Fig. 7(a). cos(α) > 0 means that the phenyl rings are on the same side of the molecule (parallel orientation) while cos(α) < 0 means they are on the opposite side (called also antiparallel orientation in the following). Experimental fiber structures have cos(α) close to −1 (Fig. 7(b)). By coloring the projections on the sketch-map of the PTMTD snapshots by the value of such cos(α) (Fig. 7(d)), it turns out that the conformations with different relative PHE orientations are well separated in the peptide conformational space (i.e., sketch-map spots are homogeneously colored).
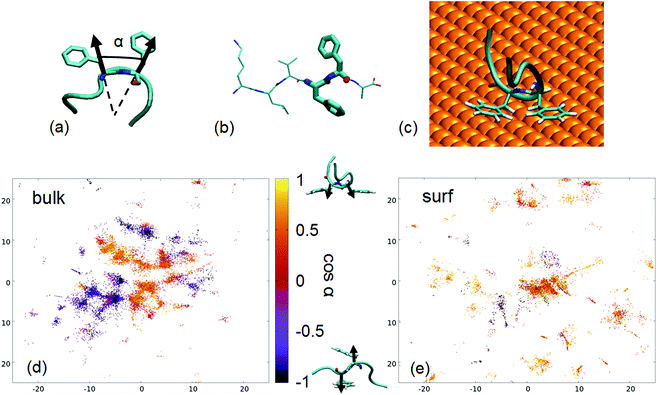 | ||
| Fig. 7 (a) Definition of the angle α used to describe the relative orientation of PHE side chains; (b) representation of a fiber-like conformation of the peptide Aβ16–21, from PDB 3OVJ87 with PHE residues in thicker licorice representation; (c) an example of antiparallel, U-shaped conformation taken from the PTMTD; (d) sketch-map projections of the PTMTD trajectory snapshots where Aβ16–22 is in bulk water on the sketch-map CVs, colored as cos(α); (e) sketch-map projections of the PTMTD trajectory snapshots where Aβ16–22 is on the gold surface, colored as cos(α). | ||
Interestingly, the comparison of the sketch-map in bulk (Fig. 7(d)) with the sketch-map on the surface (Fig. 7(e)) shows that α is indeed a good coordinate to identify conformations that are suppressed by the surface: most of the structures with antiparallel phenyl rings disappear on the surface, in favor of new parallel ones. The driving force is clear: the favorable simultaneous interaction of both phenyl rings with the surface is possible only when they are on the same side of the molecule; therefore, antiparallel structures, where this interaction is impossible, are comparatively disfavored. Moreover, the other residues in the peptide do not interact strongly with the gold surface, leading to the U-shaped conformation previously discussed (an example is shown in Fig. 7(c)).
To explore the conformational ensemble as described by the variable α, in Fig. 8(a) we present the 2D free energy surface as a function of the peptide distance from the surface and of cos(α). The change in the free-energy topology passing from the bulk (right-hand portion of the color map) to the surface (left-hand part) is visible. To make it more clear, we report in Fig. 8(b) the distribution of cos(α) averaged for the two regions identified as “bulk” and “surf” in panel (a). It is evident that the interaction with the surface does change the relative population of parallel and antiparallel phenyl orientations, by suppressing the antiparallel (cos(α) < 0) conformations.
The range of variability of α in the experimental X-ray structures is identified as the gray region in Fig. 8(b). It is apparent also from this plot that in the on-surface distribution (blue curve in Fig. 8(b)) the region where experimental fibers sit is strongly depleted of conformations with respect to the bulk water case.
Interestingly, a permutation of the Aβ16–22 residues leading to a sequence where the two PHE's are separated by an odd number of residue (e.g., KLVFAFE) does not benefit by the potential inhibition mechanism described here, as the two PHE would be on the same side of a fiber-like conformation.
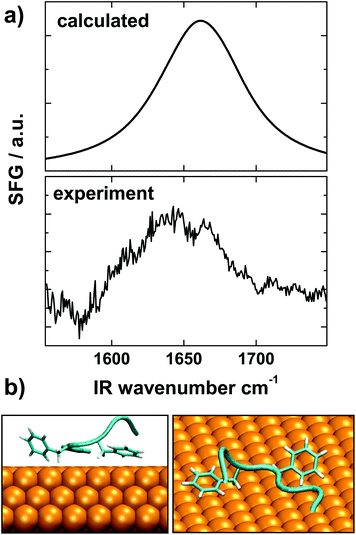
SFG was used to probe the conformation of Aβ16–22 peptides on gold. The selection rules of SFG dictate that only ordered species at interfaces are visible in the SFG vibrational spectra.91 SFG has been recently been developed into a reliable probe of interfacial folding and binding of peptides92–94 and proteins.95,96 For the experiments we adsorbed Aβ16–22 peptides onto gold surfaces and recorded the spectra in the amide I region, which reports back on the secondary structure of protein backbones. The SFG spectrum shown in Fig. 9a exhibits a broad feature between 1620 and 1690 cm−1, which is typical for the extended chain and strand motifs also observed in the simulations.97 The presence of an SFG signal shows that the peptide film is reasonably well ordered and defined.98
For a more direct comparison of the simulations with the experimental data we calculated a theoretical SFG spectrum from a representative conformation for Aβ16–22 at the surface (see Fig. 9b). This conformation is taken at the center of the most densely populated region of the on-surface sketch-map, Fig. 4(b). For the spectra calculations we followed a procedure described by Roeters et al.73 The calculated spectrum, shown in the top panel of Fig. 9a, captures the broad shape and the energy position of the experimental peak very well, which shows a remarkable agreement of the SFG experiment and the MD simulations. The SFG spectra obtained from structures representative of bulk-like conformations did not provide such agreement (see Fig. S3†).
Our computational and experimental predictions are also coherent with other published experimental studies. It has been remarked that the effect of NPs on aggregation propensity is not only related to the increase of local concentration upon adsorption, but is also related to the peptide sequence itself.99 More specifically, it was demonstrated that fullerenes can inhibit the fibril formation from Aβ by binding the region 16–21, KLVFF56,57 with a mechanism that is also based of the affinity of PHE for the inorganic material57 that has been found relevant also for other amyloidogenic peptides.100 Moreover, it has been shown that hydrophobic nanoparticles slow down Aβ fibrillation under conditions when the hydrophobic core region LVFF is exposed.101 What we find here is a very similar mechanism, although for an extended surface the balance between inhibition by fiber-conformation disruption and acceleration by increased surface concentration is likely more tilted toward the latter than for the fullerene molecules.
Recently, Crespi et al.42 determined the crystal structure of the antibody Solanezumab (Eli Lilly) complexed to the mid-region (12–28) of the Aβ peptide. Clinical trials to evaluate Solanezumab as a possible drug to decrease the risk of Alzheimer's disease are under way. In that study it is shown that Solanezumab selectively binds the mid-region of the Aβ peptide, with the two PHE oriented parallel to each other, as we find here on the surface. Sequestration from the solution via high binding affinity and disruption of fiber-prone conformations are common features of this antibody and of gold surfaces, at least with regard to the truncated peptide considered here. The effect of the surface on the entire Aβ peptide cannot be extrapolated by these findings, and requires a specific investigation.
4. Conclusions
In this work, we have presented state-of-the-art enhanced sampling atomistic simulations of an amyloidogenic peptide interacting with a gold surface in water. In particular, we have characterized how the conformational ensemble of the peptide is modified by the interaction with the surface using a recently developed powerful analysis technique (sketch-map), and we have rationalized these changes in terms of the affinity of gold to phenylalanine. The main conclusion is that the surface depletes the conformational ensemble of fiber-like structures via a mechanism that is intermediate between induced fitting and conformational selection. Taking into account that the probability of assuming fiber-like conformations is correlated with fibrillation propensity,44 we can conclude that the intrinsic effect of the surface is to reduce the fibrillation propensity of Aβ16–22. However, this is contrasted by the capability of the surface to bind the peptide efficiently (as shown by binding free-energy results). This leads to a high peptide concentration at the surface, which may seed fibrillation.39 Since the two processes (depletion of fiber-like conformations and surface-induced nucleation) involve a different number of peptide molecules (the former acts on single peptides, the latter involves different peptides, depending on concentration),102 we expect the resulting effect of the gold surface on Aβ16–22 fibrillation propensity to be concentration dependent.37 Despite this complexity, our results clearly highlight how the details of the peptide–surface interactions can determine the role of inorganic surfaces in affecting fibrillation, and may stimulate new strategies to exploit nanoparticles to control protein aggregation.Acknowledgements
LB and SC acknowledge funding from MIUR for funding under the PRIN projects 20105ZZTSE and 2012A7LMS and the CINECA award under the ISCRA initiative, for the availability of high performance computing resources and support. AA and MP acknowledge funding from European Union under the Grant No. ERC-2009-AdG-247075 and from the National Centre of Competence in Research “Materials’ Revolution: Computational Design and Discovery of Novel Materials” (NCCR-MARVEL) project.References
- D. M. Walsh and D. J. Selkoe, J. Neurochem., 2007, 101, 1172–1184 CrossRef CAS PubMed.
- E. Karran, M. Mercken and B. De Strooper, Nat. Rev. Drug Discovery, 2011, 10, 698–712 CrossRef CAS PubMed.
- J. J. Balbach, Y. Ishii, O. N. Antzutkin, R. D. Leapman, N. W. Rizzo, F. Dyda, J. Reed and R. Tycko, Biochemistry, 2000, 39, 13748–13759 CrossRef CAS PubMed.
- S. A. Petty and S. M. Decatur, J. Am. Chem. Soc., 2005, 127, 13488–13489 CrossRef CAS PubMed.
- K. Tao, J. Wang, P. Zhou, C. Wang, H. Xu, X. Zhao and J. R. Lu, Langmuir, 2011, 27, 2723–2730 CrossRef CAS PubMed.
- K. Lu, J. Jacob, P. Thiyagarajan, V. P. Conticello and D. G. Lynn, J. Am. Chem. Soc., 2003, 125, 6391–6393 CrossRef CAS PubMed.
- H. Inouye, K. A. Gleason, D. Zhang, S. M. Decatur and D. A. Kirschner, Proteins: Struct., Funct., Bioinf., 2010, 78, 2306–2321 CrossRef CAS PubMed.
- D. J. Gordon, J. J. Balbach, R. Tycko and S. C. Meredith, Biophys. J., 2004, 86, 428–434 CrossRef CAS PubMed.
- A. Lakshmanan, D. W. Cheong, A. Accardo, E. Di Fabrizio, C. Riekel and C. A. Hauser, Proc. Natl. Acad. Sci. U. S. A., 2013, 110, 519–524 CrossRef CAS PubMed.
- U. F. Röhrig, A. Laio, N. Tantalo, M. Parrinello and R. Petronzio, Biophys. J., 2006, 91, 3217–3229 CrossRef PubMed.
- F. Baftizadeh, F. Pietrucci, X. Biarnés and A. Laio, Phys. Rev. Lett., 2013, 110, 168103 CrossRef PubMed.
- L. Xie, Y. Luo and G. Wei, J. Phys. Chem. B, 2013, 117, 10149–10160 CrossRef CAS PubMed.
- W. M. Berhanu and U. H. Hansmann, Protein Sci., 2012, 21, 1837–1848 CrossRef CAS PubMed.
- P. H. Nguyen, M. S. Li, G. Stock, J. E. Straub and D. Thirumalai, Proc. Natl. Acad. Sci. U. S. A., 2007, 104, 111–116 CrossRef CAS PubMed.
- S. Gnanakaran, R. Nussinov and A. E. García, J. Am. Chem. Soc., 2006, 128, 2158–2159 CrossRef CAS PubMed.
- G. Favrin, A. Irbäck and S. Mohanty, Biophys. J., 2004, 87, 3657–3664 CrossRef CAS PubMed.
- S. Santini, G. Wei, N. Mousseau and P. Derreumaux, Structure, 2004, 12, 1245–1255 CrossRef CAS PubMed.
- B. Ma and R. Nussinov, Proc. Natl. Acad. Sci. U. S. A., 2002, 99, 14126–14131 CrossRef CAS PubMed.
- P. H. Nguyen, M. S. Li and P. Derreumaux, Phys. Chem. Chem. Phys., 2011, 13, 9778–9788 RSC.
- D. K. Klimov and D. Thirumalai, Structure, 2003, 11, 295–307 CrossRef CAS PubMed.
- T. Takeda and D. K. Klimov, J. Mol. Biol., 2007, 368, 1202–1213 CrossRef CAS PubMed.
- L. O. Tjernberg, J. Näslund, F. Lindqvist, J. Johansson, A. R. Karlström, J. Thyberg, L. Terenius and C. Nordstedt, J. Biol. Chem., 1996, 271, 8545–8548 CrossRef CAS PubMed.
- A. Irbäck and S. Mitternacht, Proteins: Struct., Funct., Bioinf., 2008, 71, 207–214 CrossRef PubMed.
- C. E. Giacomelli and W. Norde, Macromol. Biosci., 2005, 5, 401–407 CrossRef CAS PubMed.
- P. P. Mangione, G. Esposito, A. Relini, S. Raimondi, R. Porcari, S. Giorgetti, A. Corazza, F. Fogolari, A. Penco, Y. Goto, Y.-H. Lee, H. Yagi, C. Cecconi, M. M. Naqvi, J. D. Gillmore, P. N. Hawkins, F. Chiti, R. Rolandi, G. W. Taylor, M. B. Pepys, M. Stoppini and V. Bellotti, J. Biol. Chem., 2013, 288, 30917–30930 CrossRef CAS PubMed.
- M. Mahmoudi, H. R. Kalhor, S. Laurent and I. Lynch, Nanoscale, 2013, 5, 2570–2588 RSC.
- S. Rocha, A. F. Thünemann, M. D. C. Pereira, M. Coelho, H. Möhwald and G. Brezesinski, Biophys. Chem., 2008, 137, 35–42 CrossRef CAS PubMed.
- Q. Ma, G. Wei and X. Yang, Nanoscale, 2013, 5, 10397–10403 RSC.
- H. Lee, Y. Kim, A. Park and J.-M. Nam, Small, 2014, 10, 1779–1789 CrossRef CAS PubMed.
- L. Xiao, D. Zhao, W.-H. Chan, M. M. F. Choi and H.-W. Li, Biomaterials, 2010, 31, 91–98 CrossRef CAS PubMed.
- H. Li, Y. Luo, P. Derreumaux and G. Wei, Biophys. J., 2011, 101, 2267–2276 CrossRef CAS PubMed.
- H. Skaat, R. Chen, I. Grinberg and S. Margel, Biomacromolecules, 2012, 13, 2662–2670 CrossRef CAS PubMed.
- Y.-H. Liao, Y.-J. Chang, Y. Yoshiike, Y.-C. Chang and Y.-R. Chen, Small, 2012, 8, 3631–3639 CrossRef CAS PubMed.
- A. Antosova, Z. Gazova, D. Fedunova, E. Valusova, E. Bystrenova, F. Valle, Z. Daxnerova, F. Biscarini and M. Antalik, Mater. Sci. Eng. C, 2012, 32, 2529–2535 CrossRef CAS.
- M. Zhang, X. Mao, Y. Yu, C.-X. Wang, Y.-L. Yang and C. Wang, Adv. Mater., 2013, 25, 3780–3801 CrossRef CAS PubMed.
- C. Cabaleiro-Lago, F. Quinlan-Pluck, I. Lynch, K. A. Dawson and S. Linse, ACS Chem. Neurosci., 2010, 1, 279–287 CrossRef CAS PubMed.
- R. Vácha, S. Linse and M. Lund, J. Am. Chem. Soc., 2014, 136, 11776–11782 CrossRef PubMed.
- S. Linse, C. Cabaleiro-Lago, W.-F. Xue, I. Lynch, S. E. Radford and K. A. Dawson, Proc. Natl. Acad. Sci. U. S. A., 2007, 104, 8691–8696 CrossRef CAS PubMed.
- S. Auer, A. Trovato and M. Vendruscolo, PLoS Comput. Biol., 2009, 5, e1000458 Search PubMed.
- C. Cabaleiro-Lago, O. Szczepankiewicz and S. Linse, Langmuir, 2012, 28, 1852–1857 CrossRef CAS PubMed.
- G. Brancolini, D. Toroz and S. Corni, Nanoscale, 2014, 6, 7903–7911 RSC.
- G. A. N. Crespi, S. J. Hermans, M. W. Parker and L. A. Miles, Sci. Rep., 2015, 5, 9649 CrossRef CAS PubMed.
- A. Morriss-Andrews, G. Bellesia and J.-E. Shea, J. Chem. Phys., 2012, 137, 145104 CrossRef PubMed.
- G. Saracino, D. Cigognini, D. Silva, A. Caprini and F. Gelain, Chem. Soc. Rev., 2013, 42, 225–262 RSC.
- L. Bellucci and S. Corni, J. Phys. Chem. C, 2014, 118, 11357–11364 CAS.
- J. L. Elechiguerra, J. Reyes-Gasga and M. J. Yacaman, J. Mater. Chem., 2006, 16, 3906 RSC.
- U. H. Hansmann, Chem. Phys. Lett., 1997, 281, 140–150 CrossRef CAS.
- Y. Sugita and Y. Okamoto, Chem. Phys. Lett., 1999, 314, 141–151 CrossRef CAS.
- A. Laio and M. Parrinello, Proc. Natl. Acad. Sci. U. S. A., 2002, 99, 12562–12566 CrossRef CAS PubMed.
- J. F. Dama, M. Parrinello and G. A. Voth, Phys. Rev. Lett., 2014, 112, 240602 CrossRef PubMed.
- M. Ceriotti, G. a. Tribello and M. Parrinello, Proc. Natl. Acad. Sci. U. S. A., 2011, 108, 13023–13028 CrossRef CAS PubMed.
- G. A. Tribello, M. Ceriotti and M. Parrinello, Proc. Natl. Acad. Sci. U. S. A., 2012, 109, 5196–5201 CrossRef CAS PubMed.
- P. Söderhjelm, G. A. Tribello and M. Parrinello, Proc. Natl. Acad. Sci. U. S. A., 2012, 109, 5170–5175 CrossRef PubMed.
- M. Ceriotti, G. A. Tribello and M. Parrinello, J. Chem. Theory Comput., 2013, 9, 1521–1532 CrossRef CAS PubMed.
- A. Ardèvol, G. A. Tribello, M. Ceriotti and M. Parrinello, J. Chem. Theory Comput., 2015, 11, 1086–1093 CrossRef PubMed.
- J. E. Kim and M. Lee, Biochem. Biophys. Res. Commun., 2003, 303, 576–579 CrossRef CAS PubMed.
- L. Xie, Y. Luo, D. Lin, W. Xi, X. Yang and G. Wei, Nanoscale, 2014, 6, 9752–9762 RSC.
- B. Hess, C. Kutzner, D. Van Der Spoel and E. Lindahl, J. Chem. Theory Comput., 2008, 4, 435–447 CrossRef CAS PubMed.
- M. Bonomi, D. Branduardi, G. Bussi, C. Camilloni, D. Provasi, P. Raiteri, D. Donadio, F. Marinelli, F. Pietrucci, R. Broglia and M. Parrinello, Comput. Phys. Commun., 2009, 180, 1961–1972 CrossRef CAS.
- W. Humphrey, A. Dalke and K. Schulten, J. Mol. Graphics, 1996, 14, 33–38 CrossRef CAS PubMed.
- F. Iori, R. Di Felice, E. Molinari and S. Corni, J. Comput. Chem., 2009, 30, 1465–1476 CrossRef CAS PubMed.
- F. Iori and S. Corni, J. Comput. Chem., 2008, 29, 1656–1666 CrossRef CAS PubMed.
- D. J. Rosenman, C. R. Connors, W. Chen, C. Wang and A. E. García, J. Mol. Biol., 2013, 425, 3338–3359 CrossRef CAS PubMed.
- S. R. Gerben, J. A. Lemkul, A. M. Brown and D. R. Bevan, J. Biomol. Struct. Dyn., 2014, 32, 1817–1832 CAS.
- H. Berendsen, J. Postma, W. Van Gunsteren and J. Hermans, Intermol. Forces, 1981, 11, 331–342 Search PubMed.
- B. Hess, J. Chem. Theory Comput., 2008, 4, 116–122 CrossRef CAS PubMed.
- G. Bussi, D. Donadio and M. Parrinello, J. Chem. Phys., 2007, 126, 014101 CrossRef PubMed.
- G. Bussi, A. Laio and M. Parrinello, Phys. Rev. Lett., 2006, 96, 090601 CrossRef PubMed.
- M. Bonomi, D. Branduardi, G. Bussi, C. Camilloni, D. Provasi, P. Raiteri, D. Donadio, F. Marinelli, F. Pietrucci, R. A. Broglia and M. Parrinello, Comput. Phys. Commun., 2009, 180, 1961–1972 CrossRef CAS.
- P. Tiwary and M. Parrinello, J. Phys. Chem. B, 2015, 119, 736–742 CrossRef CAS PubMed.
- J. Schneider and L. Colombi Ciacchi, J. Am. Chem. Soc., 2012, 134, 2407–2413 CrossRef CAS PubMed.
- S. Mauri, R. Pandey, I. Rzeźnicka, H. Lu, M. Bonn and T. Weidner, Front. Phys., 2015, 3, 51 Search PubMed.
- S. J. Roeters, C. N. van Dijk, A. Torres-Knoop, E. H. Backus, R. K. Campen, M. Bonn and S. Woutersen, J. Phys. Chem. A, 2013, 117, 6311–6322 CrossRef CAS PubMed.
- M. Hnilova, E. E. Oren, U. O. S. Seker, B. R. Wilson, S. Collino, J. S. Evans, C. Tamerler and M. Sarikaya, Langmuir, 2008, 24, 12440–12445 CrossRef CAS PubMed.
- Z. Tang, J. P. Palafox-Hernandez, W.-C. Law, Z. E. Hughes, M. T. Swihart, P. N. Prasad, M. R. Knecht and T. R. Walsh, ACS Nano, 2013, 7, 9632–9646 CrossRef CAS PubMed.
- L. B. Wright, P. M. Rodger, S. Corni and T. R. Walsh, J. Chem. Theory Comput., 2013, 9, 1616–1630 CrossRef CAS PubMed.
- L. B. Wright, P. M. Rodger, T. R. Walsh and S. Corni, J. Phys. Chem. C, 2013, 117, 24292–24306 CAS.
- L. B. Wright, J. P. Palafox-Hernandez, P. M. Rodger, S. Corni and T. R. Walsh, Chem. Sci., 2015, 6, 5204–5214 RSC.
- J. P. Palafox-Hernandez, Z. Tang, Z. E. Hughes, Y. Li, M. T. Swihart, P. N. Prasad, T. R. Walsh and M. R. Knecht, Chem. Mater., 2014, 26, 4960–4969 CrossRef CAS.
- G. Bellesia and J.-E. Shea, Biophys. J., 2009, 96, 875–886 CrossRef CAS PubMed.
- P. E. Wright and H. J. Dyson, Curr. Opin. Struct. Biol., 2009, 19, 31–38 CrossRef CAS PubMed.
- N. London, D. Movshovitz-Attias and O. Schueler-Furman, Structure, 2010, 18, 188–199 CrossRef CAS PubMed.
- D. D. Boehr and P. E. Wright, Science, 2008, 320, 1429–1430 CrossRef CAS PubMed.
- S. Kumar, B. Ma, C. J. Tsai, N. Sinha and R. Nussinov, Protein Sci., 2000, 9, 10–19 CrossRef CAS PubMed.
- D. E. Koshland, Proc. Natl. Acad. Sci. U. S. A., 1958, 44, 98–104 CrossRef CAS.
- J. Colletier, A. Laganowsky, M. Landau, M. Zhao, A. B. Soriaga, L. Goldschmidt, D. Flot, D. Cascio, M. Sawaya and D. Eisenberg, Proc. Natl. Acad. Sci. U. S. A., 2011, 108, 16938–16943 CrossRef CAS PubMed.
- M. Landau, M. R. Sawaya, K. F. Faull, A. Laganowsky, L. Jiang, S. A. Sievers, J. Liu, J. R. Barrio and D. Eisenberg, PLoS Biol., 2011, 9, e1001080 CAS.
- M. Hoefling, F. Iori, S. Corni and K.-E. Gottschalk, Langmuir, 2010, 26, 8347–8351 CrossRef CAS PubMed.
- J. E. Baio, T. Weidner, G. Interlandi, C. Mendoza-Barrera, H. E. Canavan, R. Michel and D. G. Castner, J. Vac. Sci. Technol., B, 2011, 29, 04D113 Search PubMed.
- T. Weidner, A. Kramer, C. Bruhn, M. Zharnikov, A. Shaporenko, U. Siemeling and F. Trager, Dalton Trans., 2006, 2767–2777 RSC.
- Y. R. Shen, The Principles of Nonlinear Optics, Wiley, New York, 1st edn, 1984 Search PubMed.
- L. Fu, Z. G. Wang and E. C. Y. Yan, Chirality, 2014, 26, 521–524 CrossRef CAS PubMed.
- B. Ding, A. Panahi, J. J. Ho, J. E. Laaser, C. L. Brooks, M. T. Zanni and Z. Chen, J. Am. Chem. Soc., 2015, 137, 10190–10198 CrossRef CAS PubMed.
- D. Schach, C. Globisch, S. J. Roeters, S. Woutersen, A. Fuchs, C. K. Weiss, E. H. G. Backus, K. Landfester, M. Bonn, C. Peter and T. Weidner, J. Chem. Phys., 2014, 141, 22D517 CrossRef PubMed.
- R. Hennig, J. Heidrich, M. Saur, L. Schmuser, S. J. Roeters, N. Hellmann, S. Woutersen, M. Bonn, T. Weidner, J. Markl and D. Schneider, Nat. Commun., 2015, 6, 7018 CrossRef CAS PubMed.
- A. P. Boughton, P. Yang, V. M. Tesmer, B. Ding, J. J. G. Tesmer and Z. Chen, Proc. Natl. Acad. Sci. U. S. A., 2011, 108, E667–E673 CrossRef CAS PubMed.
- K. Nguyen, J. King and Z. Chen, J. Phys. Chem. B, 2010, 114, 8291–8300 CrossRef CAS PubMed.
- L. Baugh, T. Weidner, J. E. Baio, P.-C. T. Nguyen, L. J. Gamble, P. S. Stayton and D. G. Castner, Langmuir, 2010, 26, 16434–16441 CrossRef CAS PubMed.
- S. C. Wagner, M. Roskamp, M. Pallerla, R. R. Araghi, S. Schlecht and B. Koksch, Small, 2010, 6, 1321–1328 CrossRef CAS PubMed.
- N. Todorova, A. J. Makarucha, N. D. M. Hine, A. A. Mostofi and I. Yarovsky, PLoS Comput. Biol., 2013, 9, e1003360 Search PubMed.
- M. Ghavami, M. Rezaei, R. Ejtehadi, M. Lotfi, M. A. Shokrgozar, B. Abd Emamy, J. Raush and M. Mahmoudi, ACS Chem. Neurosci., 2013, 4, 375–378 CrossRef CAS PubMed.
- D. Kashchiev, R. Cabriolu and S. Auer, J. Am. Chem. Soc., 2013, 135, 1531–1539 CrossRef CAS PubMed.
Footnotes |
| † Electronic supplementary information (ESI) available: Representative structures for the most populated conformational structures of Aβ16–22 on bulk and on the metal surface. Normalized distribution of the variable s defined as the sum of internal dihedral angles of the peptide in solution and at the gold/water interface. See DOI: 10.1039/C6NR01539E |
| ‡ K: lysine; L: leucine; F: phenylalanine; A: alanine; E: glutamic acid. |
| This journal is © The Royal Society of Chemistry 2016 |

