
 Open Access Article
 This Open Access Article is licensed under a Creative Commons Attribution-Non Commercial 3.0 Unported Licence
Effective PEGylation of gold nanorods†
F.
Schulz
 *ab,
W.
Friedrich
a,
K.
Hoppe
a,
T.
Vossmeyer
a,
H.
Weller
abc and
H.
Lange
ab
*ab,
W.
Friedrich
a,
K.
Hoppe
a,
T.
Vossmeyer
a,
H.
Weller
abc and
H.
Lange
ab
aInstitute for Physical Chemistry, University of Hamburg, Grindelallee 117, 20146 Hamburg, Germany. E-mail: schulzf@chemie.uni-hamburg.de
bThe Hamburg Centre for Ultrafast Imaging (CUI), Luruper Chaussee 149, 22761 Hamburg, Germany
cDepartment of Chemistry, Faculty of Science, King Abdulaziz University, Jeddah, Saudi Arabia
First published on 7th March 2016
Abstract
Standard procedures to coat gold nanorods (AuNR) with poly(ethylene glycol) (PEG)-based ligands are not reliable and high PEG-grafting densities are not achieved. In this work, the ligand exchange of AuNR with PEGMUA, a tailored PEG-ligand bearing a C10 alkylene spacer, is studied. PEGMUA provides AuNR with very high stability against oxidative etching with cyanide. This etching reaction is utilized to study the ligand exchange in detail. Ligand exchange is faster, less ligand consuming and more reproducible with assisting chloroform extraction. Compared to PEG ligands commonly used, PEGMUA provides much higher colloidal and chemical stability. Further analyses based on NMR-, IR- and UV/Vis-spectroscopy reveal that significantly higher PEG-grafting densities, up to ∼3 nm−2, are obtained with PEGMUA. This demonstrates how the molecular structure of the PEG ligand can be used to dramatically improve the ligand exchange and to synthesize PEGylated AuNR with high chemical and colloidal stability and high PEG grafting densities. Such AuNR are especially interesting for applications in nanomedicine.
Introduction
To enable the wide use of gold nanorods (AuNR), the control of their surface chemistry is fundamental.1–6 However, the ligand exchange of cetyltrimethylammonium bromide (C19H42BrN, CTAB), the typical surfactant and stabilizer for AuNR, is much more challenging than e.g. the exchange of citrate on spherical gold nanoparticles (AuNP).7,8 This is a key challenge in the development of safe nanomedicines and AuNR-based probes for biological imaging because CTAB can be cytotoxic.9 CTAB forms a densely packed bilayer or admicelle at the AuNR surface that requires a sufficiently high concentration of unbound CTAB to stay intact and to provide effective stabilization of the AuNR.10–15 Especially the surface bound CTAB is difficult to remove and the surface chemistry is complicated by significant amounts of silver on the AuNR surface that is needed in their synthesis to promote anisotropic growth.6,16,17 Indrasekara et al. have recently reviewed the current strategies for AuNR ligand exchange and emphasized the challenge of analyzing the AuNR surface chemistry.7Problems during the ligand exchange of CTAB stabilized AuNR, AuNR@CTAB, include concentration losses due to aggregation and incomplete exchange.6–8 Large amounts of residual CTAB result in a higher toxicity of the AuNR but also affect their stability.5,18–21 Polymers can be used as ligands to stabilize the AuNR and among these, poly(ethylene glycol)- (PEG-) thiols are probably the most important ones.6–8,22 PEG-ligands are well studied and established in nanomedicine.23,24 They can provide biocompatibility and stability and are readily available. Accordingly, many strategies have been studied that aim for functionalization of AuNR with PEG, PEGylation.22,25–29 However, although stabilization and reduced toxicity can be achieved, considerable amounts of CTAB often remain on the AuNR surface, AuNR-stability during ligand exchange and purification can be problematic and just low or moderate grafting densities of PEG are achieved.7,8,30 Recently, Hore et al. have used small angle neutron scattering (SANS) experiments to show that quantities as low as 5–10 PEG-thiols, corresponding to a grafting density of σ = 0.002 ± 0.0005 chains per nm2, are bound to the AuNR surface after a standard ligand exchange protocol, leaving the CTAB-layer virtually unchanged.12 A higher grafting density of the PEG ligands would be highly desirable, not only for replacing more CTAB and increasing steric stabilization, but also because it is favorable in terms of immune response.31
It is established that an effective ligand exchange of AuNR@CTAB critically depends on the effective removal of surface-bound and free CTAB.6–8,14 In the context of PEGylation, promising approaches include the use of additives,26,27 buffers29 or ethanol25 to assist the CTAB removal. Beyond PEGylation, chloroform32 and temperature33 assisted strategies were reported. In all these strategies, sufficient stabilization of the AuNR has to be ensured, e.g. by using stabilizers, 2-step procedures or sonication to prevent aggregation. Good results, even with quantitative CTAB removal,34 were obtained especially with molecules that have a structure similar to CTAB, namely a long alkyl chain, at the surface-binding group.28,33,35 We thus investigated whether a structural similarity at the surface-binding group can also be utilized for the PEGylation of AuNR.
The incorporation of a C10 alkylene spacer between the thiol-group and the PEG-moiety can dramatically increase the stability against oxidative etching with cyanide, as already observed for spherical gold nanoparticles (AuNP).36 It is hypothesized that C10-spacer favor a high grafting density via attractive hydrophobic interactions (in contrast to repulsive interactions of the hydrophilic PEG chains in water) and form an inner hydrophobic region in the ligand layer. This inner hydrophobic region constitutes an effective barrier against reactions at the particles’ surface. Competitive displacement of PEG-ligands by small molecules, as e.g. present in plasma (as cysteine) and leading to opsonization and phagocytosis can be prevented by such a hydrophobic region as demonstrated by Larson et al.37 These results show that rationally designing the molecular structure of PEG-ligands can be an effective tool to improve the stability and biocompatibility of nanomaterials. In the case of AuNR, CTAB provides very little stabilization against oxidative etching with cyanide (despite its postulated bilayer structure with hydrophobic interior). On the contrary, α-methoxypoly(ethylene glycol)-ω-(11-mercaptoundecanoate) (PEGMUA), a PEG-ligand with C10-spacer, provides excellent stabilization in this respect as shown herein. Utilizing this large difference in stability of CTAB-coated and PEGMUA-coated AuNR against cyanide etching, the according ligand exchange was studied in detail.
We compared the displacement of CTAB by PEGMUA in water and the displacement in water assisted by extraction of CTAB with chloroform. The latter strategy was proposed for the first time by Takahashi et al. for the exchange of CTAB with phosphatidylcholine.32 The authors found that CTAB in solution was efficiently removed by chloroform extraction and that the amount of surface bound CTAB was reduced. To achieve a high grafting density, very high stabilization and good biocompatibility,37–39 PEGMUA is an excellent candidate for ligand exchange. Still, we show herein, that the ligand exchange can be improved effectively when combined with chloroform extraction. In additional experiments we compared the performance of PEGMUA to that of a commercially available PEG-ligand PEGSH, which has the same molecular weight as PEGMUA, but bears no alkylene spacer. PEGSH provided much less stabilization against oxidative etching and less colloidal stability than PEGMUA. AT-FTIR-experiments strongly suggest that, using the same concentration and procedure, substantially more PEGMUA than PEGSH is ultimately bound to the AuNR. The grafting density of PEGMUA on AuNR was assessed with quantitative NMR and found to be sufficiently high to constitute a dense PEG-brush. Our experiments demonstrate that the use of PEGMUA significantly promotes the ligand exchange reaction and enables highly efficient PEGylation. As a result, PEGylated AuNR with high chemical and mechanical stability and PEG grafting densities are obtained.
Experimental section
Materials
The AuNR syntheses, PEGMUA synthesis and subsequent experiments were performed with the following chemicals: ascorbic acid (99%, Sigma-Aldrich), cetyltrimethylammonium bromide (CTAB, 99%, Sigma-Aldrich), hydrochloric acid (HCl, 37%, Merck), nitric acid (70%, Merck), potassium cyanide (KCN, 96%, Sigma-Aldrich), silver nitrate (99%, Sigma-Aldrich), sodium borohydride (98%, Fluka), sodium oleate (97%, TCI), tetrachloroauric acid trihydrate (99%, Sigma-Aldrich), 11-mercaptoundecanoic acid (95%, Sigma-Aldrich), poly(ethylene glycol) monomethyl ether (Mn ∼ 2000 g mol−1, Sigma-Aldrich), α-methoxy-ω-mercaptopoly(ethylene glycol) (Mn ∼ 2000 g mol−1, Rapp Polymere GmbH, Tuebingen, Germany), iodoform (99%, Sigma-Aldrich). Ultrapure water (18.2 MΩ cm, Millipore) was used for all procedures. Solvents were used in p.a. grade. Chloroform-d3 (CDCl3, 99.8% with 0.03% tetramethylsilane, TMS) and deuterium oxide (D2O, 99.9%) were from Deutero GmbH (Kastellaun, Germany).UV/Vis-spectroscopy
Absorbance spectra were recorded using a Varian Cary 50, a Perkin Elmer Lambda 25 or a Perkin Elmer Lambda 1050 spectrometer. UV-micro-cuvettes sealed with lids (Plastibrand®, Carl Roth GmbH, Karlsruhe Germany) were used for all experiments. AuNR-concentrations were determined by the method reported by Liz-Marzán's group using the absorbance at 400 nm.40 The method is based on the idea that 0.5 mM gold causes an absorbance of 1.2 at 400 nm, regardless of the particles’ shape if they are not too big.ATR-FTIR spectroscopy
FTIR-spectra were recorded with a Varian 660 FTIR spectrophotometer equipped with a PIKE MIRacle™ ATR sampling accessory. Spectra of PEGMUA, CTAB and MUA were recorded from the pure solids pressed onto the crystal (diamond) with a high pressure clamp. To record spectra of AuNR samples, 2–3 μl of the according solution were pipetted directly onto the crystal. After evaporation of the solvent (usually within 15–30 min) spectra were recorded. Afterwards the crystal was thoroughly cleaned with water and ethanol. 32 scans in absorbance mode with 4 cm−1 resolution were recorded for each measurement.1H-NMR spectroscopy
1H-NMR spectra were recorded using a Bruker AV2-400 NMR spectrometer operated at 400.13 MHz and 298 K.Mass spectrometry
MALDI-TOF/TOF-measurements were done with a Bruker UltrafleXtreme mass spectrometer. 2,5-Dihydroxybenzoic acid (20 mg ml−1 in 30% acetonitrile, 0.1% trifluoroacetic acid, water) was used as a matrix for matrix assisted measurements. Concentrated and purified AuNR-samples were drop-casted onto a ground steel target for measurements and ionized by a smartbeam-II laser.Graphit furnace atom absorption spectrometry (GF-AAS)
GF-AAS measurements were performed with a ContrAA-700 AAS-spectrometer (Analytik Jena, Germany) at 242.795 nm (Au) or 328.068 nm (Ag). The limit of detection (LOD) was 10 μg l−1. Measurements were performed in triplicates and the relative standard deviation of the mean was 1–5%.Transmission electron microscopy, TEM
TEM measurements for standard characterization of the AuNR were performed using a Jeol JEM-1011 operating at 100 kV. Samples were prepared by drop casting ∼10 μl AuNR solution onto carbon-coated copper grids. HR-STEM-EDX measurements were performed using a JOEL JEM 2200 FS (UHR) with a CESCOR and a CETCOR corrector and an JEOL JED-2300 T EDX with 50 mm2 Si(Li) detector at 200 kV.AuNR@CTAB synthesis
AuNR were synthesized based on the seeded-growth method developed by the Murray group using binary surfactant mixtures.41 It was essential for the success of the syntheses to store sodium borohydride under nitrogen atmosphere. The preparation was divided into a seed nucleation and a growth step. All glass devices were carefully cleaned with aqua regia [Caution! Aqua regia is hazardous. Handle with extreme care and dispose of unused material using methods appropriate for your workplace] and subsequently washed with ultrapure water before use. The basic synthetic protocol was as follows. For the growth solution, CTAB (7.00 g, 19.2 mmol) and sodium oleate (1.234 g, 4.053 mmol) were dissolved in water (250 ml) at 50 °C. After the solution had cooled down to 30 °C, AgNO3 solution (18 ml, 4.0 mM) was added and the solution was kept undisturbed at 30 °C for 30 min. Subsequently, Au3+ solution (250 ml 1.0 mM) was added and the orange-yellow mixture was stirred until it was colorless for 90 min with 700 rpm at 30 °C. In between, the seed solution was prepared. A CTAB solution (5 ml, 0.2 M) was mixed with HAuCl4 solution (5 ml, 0.5 mM) in a 20 ml glass vial. The yellowish solution was stirred with 1200 rpm and freshly prepared sodium borohydride solution (600 μl, 10 mM) filled up with water to 1.0 ml was quickly injected. After 2 min of stirring the solution was aged for 30 min while it changed its color from blue-grey to amber. To the now colorless growth solution HCl (2.1 ml 12 M) was admixed while stirring with 400 rpm. The speed was increased to 1200 rpm and ascorbic acid solution (1.25 ml, 64 mM) and after 30 s of stirring seed solution (0.8 ml) were added. The solution was stirred for another 30 s. Then the stirring was stopped and the growth solution was aged for 14 hours while it became brownish-pink. The AuNR were centrifuged for 30 min at 5000g and the supernatant replaced by water to yield a final volume of 160–170 ml per batch. Variations of the basic synthetic protocol are listed in Table 1.| AuNR batcha | Variation | Length [nm] | Width [nm] | Aspect ratio |
|---|---|---|---|---|
| a During NaBH addition. | ||||
| 1 | — | 86.7 ± 7.6 | 29.0 ± 2.1 | 3.0 ± 0.4 |
| 2 | — | 85.7 ± 9.2 | 28.9 ± 2.4 | 3.0 ± 0.4 |
| 3 | — | 80.0 ± 12.8 | 26.1 ± 1.8 | 3.1 ± 0.4 |
| 4 | 900 μl NaBH (10 mM) | 75.4 ± 7.4 | 21.4 ± 1.6 | 3.6 ± 0.4 |
| 5 | 200 rpm stirringa | 80.1 ± 6.1 | 25.7 ± 1.7 | 3.1 ± 0.4 |
| 6 | No stirringa | 82.5 ± 8.0 | 26.3 ± 1.8 | 3.2 ± 0.4 |
| 7 | 12.0 ml AgNO3 | 81.6 ± 7.6 | 28.2 ± 2.3 | 2.9 ± 0.3 |
PEGMUA synthesis
α-Methoxypoly(ethylene glycol)-ω-(11-mercaptoundecanoate) (PEGMUA) was synthesized by esterification of poly(ethylene glycol) monomethyl ether and 11-mercaptoundecanoic acid and characterized as described previously.36,42Ligand exchange with PEGMUA or PEGSH
Stock solutions of PEGMUA and PEGSH were 1 mM or 10 mM in water. For ligand exchange the according volumes were pipetted to AuNR solutions to the desired concentrations. In concentration rows all samples were adjusted to the same final volume, typically 1.000 ml, with water to ensure the same final AuNR-concentration. During the reaction time the mixtures were agitated by a magnetic stirrer or a lab shaker. For studies of the ligand exchange the reaction mixtures were incubated in centrifugal tubes, glass vials or directly in cuvettes. Large batches were synthesized in glass bottles.Etching experiments
Stock solutions of KCN were 1.00 M in water, they were stored at −18 °C [KCN is hazardous. Handle with extreme care. All solutions should be stored in clearly labeled and tightly sealed containers. Dispose of unused material using methods appropriate for your workplace]. Because AuNR-solutions are typically acidic (pH ∼ 3) it is important to ensure that the pH after KCN addition is sufficiently high (>11) to avoid formation of hydrogen cyanide (HCN, pKa = 9.2). If necessary, this can be done e.g. by centrifugation of the AuNR and replacement of the supernatant by water to remove residual HCl from the AuNR synthesis and/or addition of base. KCN acts as a strong base and in our experiments KCN concentrations were sufficiently high to ensure a pH > 11. The etching reactions were started in a fumehood by pipetting the according volumes of KCNaq into the cuvette containing the AuNR solution. The cuvette was then tightly sealed with a lid and vigorously shaken once. During the etching reactions the cuvettes were not agitated and kept at room temperature. Absorbance spectra were recorded at different reaction times of the etching reaction.Chloroform extraction without centrifugation
AuNR@CTAB (20 ml, 3.0 × 10⁻² nM, batch 1) were mixed with PEGMUA solution (50 μl, 10 mM, c1(PEGMUA) = 25 μM) in a separation funnel. The solution was extracted fivefold with chloroform (20 ml for each extraction). In the first separation steps an emulsion or mixed phase formed. This can be avoided by removing more CTAB before the extraction, e.g. by centrifugation. After 2–3 extractions the phases separated nicely. The AuNR concentration (3.0 × 10⁻² nM) was not changed by the extraction.Chloroform extraction with centrifugation
AuNR@CTAB (10 or 20 ml, 2–3 × 10⁻² nM, batch 1) were reacted for t1 = 22 h with PEGMUA at the desired concentration. Then the mixtures were extracted fivefold with chloroform (10 ml for each extraction) using a separation funnel as described above. After extraction the solutions were purified by fourfold centrifugation (7000–9000g, 10–20 min) replacing the supernatants with water. The concentrations were then adjusted via the samples’ absorbance to 9.3 × 10⁻³ nM.Comparison of AuNR@PEGSH and AuNR@PEGMUA
AuNR (batch 1) were prepared as described for chloroform extraction with centrifugation. The AuNR were reacted with 50 μM PEG ligand before extraction (t1 = 22 h) and with different concentrations of PEG ligand after extraction for t2 = 2 h. For analysis AuNR@PEGSH were reacted with 5 mM KCN and AuNR@PEGMUA with 25 mM KCN and the etching reactions monitored as described.Centrifugation-based strategies for CTAB removal
Ethanol-assisted: after t1 = 22 h reaction with PEGMUA at the desired concentration (c1(PEGMUA) = 25 or 50 μM) the AuNR (batch 1) were washed by fourfold centrifugation (7000g, 10–20 min) replacing the supernatants by ethanol. After three or four washing steps the AuNR irreversibly adhered to the container walls (material: polypropylene). In a reproduction with different centrifuge tubes the purification was completed without significant losses, even though the material was the same. For subsequent etching experiments the concentrations were adjusted to 9.3 × 10⁻³ nM. Water-assisted: AuNR@CTAB (30 ml, 4 × 10⁻² nM, batch 2) were centrifuged (7000g, 15 min) two rounds replacing the supernatants by water. The AuNR-concentration was adjusted to 0.037 nM and the solution divided into two parts. One part of the solution was extracted fivefold with chloroform (10 ml for each extraction), the other part of the solution was not treated any further. Both solutions, extracted and not extracted were reacted with different concentrations of PEGMUA and subsequently analyzed via their reaction with cyanide.Chloroform extraction of AuNR@CTAB
AuNR@CTAB (10 ml, 3.8 × 10⁻² nM, batch 6) were extracted fivefold with chloroform (10 ml for each extraction). 1 ml of the aqueous phase containing the AuNR were then transferred into a cuvette and absorbance spectra recorded in 10 min intervals by running the spectrometer in cycle mode.Highly concentrated AuNR@PEGMUA and AuNR@PEGSH samples for ATR-FTIR-analysis
PEG-ligand (10 mg, 5 μmol) was dissolved in water (180 ml) and with 800 rpm stirring, AuNR@CTAB (20 ml, ∼2.2 × 10⁻¹ nM, batch 1) were added. After 24 h reaction the solutions were extracted fivefold with chloroform (100 ml for each extraction). In the first extraction, phase separation took 10–15 min and a mixed phase/emulsion remained. In the second extraction, the phase separation took some minutes and again some mixed phase/emulsion remained. In the following extractions, no emulsion remained and the phases separated quickly, within seconds. Overall, 50 ml solution of each batch was lost due to emulsion formation and 150 ml AuNR-solution with unchanged concentration remained. The 50 ml mixed phases/emulsions were stored at 7 °C and the phase separation slowly proceeded. Thus it was possible to recover more of the AuNR-solutions. These were not combined with the fully extracted solutions, however, because their CTAB concentrations were expected to differ. The extracted solutions were adjusted with water to a total volume of 200 ml and a total concentration of 50 μM PEG-ligand. After reaction for 16 h with stirring, strong adhesion to the reaction vessel walls (material: glass) and stirring bar (PTFE) was observed for AuNR@PEGSH but not for AuNR@PEGMUA. AuNR@PEGSH could be resuspended by sonication. The solutions were then concentrated to 1.0 ml by repeated centrifugation (7000g, 60 min for volumes: 40 ml per tube, 20 min for small volumes: 1.5 ml per tube). In all centrifugation steps strong adhesion and possibly aggregation of AuNR@PEGSH was observed, that could be partly reversed by ultrasound treatment after each centrifugation step. AuNR@PEGMUA were not problematic in this respect but were also treated with ultrasound after each centrifugation step to improve the purification. The concentrated samples were purified by two additional centrifugation steps, replacing supernatants by water. The overall dilution was at least 1![[thin space (1/6-em)]](https://www.rsc.org/images/entities/char_2009.gif) :320000. AuNR@PEGMUA were 2.2 × 10⁻² nM before extraction and 2.58 nM after concentration and purification. Because 50 ml were lost during the extraction and effectively 150 ml of the AuNR were concentrated, this corresponds to ∼20% loss of AuNR due to concentration and purification. The AuNR-concentration directly before concentration could not be determined by UV/Vis spectroscopy because residual chloroform from the extraction affected the absorbance. AuNR@PEGSH were 2.4 × 10⁻² nM before extraction and 8.4 × 10⁻¹ nM after concentration and purification. Accordingly, ∼80% of the AuNR were lost during concentration and purification. The concentrated and purified samples were analyzed by ATR-FTIR-spectroscopy.
:320000. AuNR@PEGMUA were 2.2 × 10⁻² nM before extraction and 2.58 nM after concentration and purification. Because 50 ml were lost during the extraction and effectively 150 ml of the AuNR were concentrated, this corresponds to ∼20% loss of AuNR due to concentration and purification. The AuNR-concentration directly before concentration could not be determined by UV/Vis spectroscopy because residual chloroform from the extraction affected the absorbance. AuNR@PEGSH were 2.4 × 10⁻² nM before extraction and 8.4 × 10⁻¹ nM after concentration and purification. Accordingly, ∼80% of the AuNR were lost during concentration and purification. The concentrated and purified samples were analyzed by ATR-FTIR-spectroscopy.
Highly concentrated AuNR@PEGMUA sample for NMR- and ATR-FTIR-analysis
AuNR@CTAB (160 ml, 3.9 × 10⁻¹ nM, batch 4) were centrifuged (7000g, 20 min) to reduce the CTAB concentration and the supernatants (∼150 ml) replaced by PEGMUA solution (27 μM). To determine the CTAB concentration of the starting material by quantitative NMR, the supernatants were collected. KCN (50 mg, 0.78 mmol) was added to the supernatants to dissolve residual AuNR@CTAB. After the solution had turned colorless, indicating complete dissolution of the residual AuNR, it was frozen and lyophilized. The residue was dissolved in CDCl3 (5.000 ml) and the solution filtrated with a PTFE syringe filter (0.22 μm pore size). A part of the filtrate (700 μl) and iodoform in CDCl3 (50 μl, 20.0 mg ml−1 → 1.0 mg, 2.5 μmol) were mixed in a NMR-tube for 1H-NMR analysis. A CTAB-concentration of 22 mM was found, based on this analysis.The reaction mixture (160 ml, AuNR@CTAB in the presence of 25 μM PEGMUA) was shaken for 2 days on a lab-shaker and then centrifuged (10000g, 40 min). The combined pellets containing the AuNR (∼12 ml) were filled up with water (to 20 ml). The supernatants containing unreacted PEGMUA (157 ml) were lyophilized without etching. The gold content was determined with GF-AAS to be 333 μg l−1 (c(Ag) = 51.6 μg l−1, 16% of c(Au)) and was therefore negligible, i.e. no AuNR had remained in the supernatants. The residue of the lyophilized supernatants was solved in CDCl3 and analyzed by 1H-NMR analysis as described, but without syringe filtration, that was not necessary for this and all subsequent samples. 1H-NMR analysis yielded 34–36 μM PEGMUA, 100–120 μM CTAB and 2.5–3.4 μM oleate in these supernatants. That the PEGMUA concentration was higher than theoretically expectable (max. ∼25 μM) points out the limited accuracy of the method (probably most of all because of the molar mass distribution of PEGMUA) but also suggests that not much PEGMUA had bound to the AuNR before extraction. The AuNR solution (20 ml) from the combined pellets was extracted fivefold with chloroform (10 ml for each extraction). Then, PEGMUA was added (160.0 mg, c2(PEGMUA) = 4 mM) and the solution was shaken for t2 = 2 h. After subsequent addition of water (20 ml), the reaction mixture was then centrifuged (10000g, 30 min) and concentrated to 5–6 ml. In the lyophilized supernatant 106–116 mg residue was obtained, that contained >97% PEGMUA (>85% thiol, <15% disulfide, based on 1H-NMR analysis as described previously36) corresponding to 2.6–2.9 mM of the 4 mM PEGMUA originally added after extraction. Accordingly, less than 90 μM CTAB was in this supernatant. The gold concentration was again negligible (c(Au) = 1844 μg l−1, c(Ag) = 39.6 μg l−1). For further purification, the concentrated AuNR@PEGMUA solution was centrifuged 4 more rounds (7000g, 30 min) replacing supernatants with water and with a minimum of 5 min sonication after each centrifugation. The dilution in each centrifugation was at least 1:25 and the overall dilution was at least 1:6 × 10⁶. The volume of the final concentrated and purified solution was adjusted to ∼4 ml. The AuNR-concentration was 16.7 nM based on UV/Vis spectroscopy and 16 nM based on GF-AAS (c(Au) = 4.8 × 10⁶ μg l−1, c(Ag) = 5.1 × 10⁴ μg l−1) assuming a cylindrical geometry with the parameters obtained by TEM-analysis.
NMR-analysis of concentrated AuNR@PEGMUA
Concentrated and purified AuNR (3.000 ml, 16 nM) were dissolved by adding KCN solution (1.000 ml, 1.00 M) followed by stirring overnight. The clear and colorless solution was then lyophilized and the residue dissolved in CDCl3 (1.000 ml). 700 μl thereof and iodoform in CDCl3 (50 μl, 20.0 mg ml−1) were mixed in a NMR-tube for 1H-NMR analysis. After complete evaporation of residual CDCl3 the residues that were not dissolved in CDCl3 were completely dissolved in D2O (2.000 ml). 700 μl thereof and acetonitrile (50 μl, 1 vol% in D2O) were mixed in a NMR-tube for 1H-NMR analysis. In the CDCl3 sample, 0.28 μmol PEGMUA were found and 0.175 μmol in the D2O sample. This corresponds to 0.4 μmol in the 1.000 ml CDCl3 and 0.5 μmol in the 2.000 ml D2O and to a total concentration of 300 μM PEGMUA in the 3.000 ml concentrated AuNR-solution.Results and discussion
First, we focus on the comparison of CTAB-ligand exchange by PEGMUA with and without assisting extraction with chloroform. To analyze the exchange, oxidative etching with cyanide is employed, utilizing the huge difference in stabilization of AuNR by CTAB and by PEGMUA. AuNR@CTAB are usually etched in less than a minute with 25 mM cyanide, whereas PEGMUA-coated AuNR, AuNR@PEGMUA, react for days and are still not completely dissolved by etching with this cyanide concentration.Oxidative cyanide etching enables studying the CTAB/PEGMUA ligand exchange
To analyze the ligand exchange without extraction, AuNR@CTAB were incubated with different concentrations of PEGMUA for a fixed reaction/incubation time t1. AuNR@CTAB were prepared following the protocol of Ye et al. using CTAB at a reduced concentration together with sodium oleate to yield AuNR@CTAB with 70–90 nm length and 20–30 nm diameter (Fig. 1).41 The AuNR@CTAB dispersion was diluted by a factor of 10 to AuNR concentrations in the range 5–30 pM. The CTAB-concentration in these samples was ∼2 mM. In general, variations of the CTAB concentration are due to the AuNR synthesis. Different sizes, aspect ratios and concentrations of the produced AuNR lead to varying amounts of adsorbed CTAB. Considering the strong impact of the CTAB concentration on ligand exchange kinetics14 this is hypothesized to be a reason for limited reproducibility of ligand exchange. In a first set of experiments, AuNR@CTAB reacted with different concentrations of PEGMUA for 22 hours and were subsequently exposed to 50 mM potassium cyanide, KCN. Fig. 2 shows the absorbance spectra of these samples at different times after KCN addition. Without PEGMUA addition (c = 0 μM) the AuNR are completely etched within minutes and the absorbance after 12 minutes is ∼0. The formation of Au-cyanide complexes ([Au(CN)2]−) is indicated by their spectral signature with maxima at ∼213, 230 and 240 nm.43 In contrast, hardly any etching is observed for AuNR reacted with 300 μM PEGMUA. Depending on the PEGMUA concentration, the longitudinal localized surface plasmon resonance band (LSPRB) broadens and redshifts during the etching reaction. | ||
| Fig. 1 Exemplary TEM measurement of AuNR and structures of PEG ligands used in this study. | ||
 | ||
| Fig. 2 Monitoring the oxidative etching of AuNR by UV/Vis-spectroscopy. AuNR were reacted 22 hours with different concentrations of PEGMUA as indicated. Then the samples were etched with 50 mM of KCN and absorbance spectra were recorded at different times during the etching reaction. 0 min corresponds to measurements directly after KCN addition. The absorbance at 450 nm (A450), reflecting the stability of the sample, can be plotted versus the reaction time (B) or versus the PEGMUA concentration (C) to analyze the data. Lines are a guide to the eye. | ||
For high PEGMUA concentrations (see e.g. 200 μM Fig. 2A) neither broadening nor strong shift was observed, but a gradual decrease of absorbance. These different optical responses during the etching reaction indicate different mechanisms of the etching processes. Similar to a simple model proposed earlier for spherical AuNP,36 two extreme cases are conceivable: a situation where all AuNR are etched simultaneously at a similar rate or a particle-by-particle etching. Here, any morphological changes of the AuNR can be expected to result in shifts and broadening of the longitudinal absorption,44,45 especially on the ensemble level, when these changes are irregular, leading to a broadened morphological distribution of the sample. Additionally, aggregation processes have to be considered, that can also lead to broadening of the absorbance band.46
Not only the ligand structure, but also the ligand coverage can be expected to affect the mechanism of the etching reaction. If no AuNR have a maximum coverage with PEGMUA, the etching rate will be in the same range for all AuNR in the sample. The rate will be comparably high because of the AuNRs’ incomplete coverage with stabilizing PEGMUA. Accordingly, their morphological changes will be reflected in the optical properties of the sample, i.e. by broadening and shifts of the LSPRB, as observed for the samples treated with PEGMUA at lower concentrations. In contrast, if all AuNR have maximum coverage, and therefore maximum stabilization, by PEGMUA, the etching rates will be much higher for AuNR that are already etched locally, because the etching produces “weak spots” in their ligand layer. In consequence, a particle-by-particle etching occurs and morphological changes do not dominate the optical properties of the samples, as indicated by the uniform gradual decrease of absorbance observed in case of the samples treated with PEGMUA at high concentrations. TEM-analyses support this interpretation (Fig. S1†).
The kinetics of the etching reactions can be compared by plotting the absorbances at 450 nm (A450, Fig. 2B)) as an indicator of the samples’ concentrations, which decrease during the etching reaction. This method is semiquantitative because the exact morphology and optical properties of the samples at a certain time point of the etching reaction are not known, but it still allows comparing the kinetics of the different samples reacting with KCN. The etching rate decreases with increasing PEGMUA concentration (Fig. 2B). For high PEGMUA excesses the reaction is not completed within the experiment duration. Another way to analyze the data is by plotting the absorbance (A450) versus the PEGMUA concentration used for stabilization of the AuNR (Fig. 2C). The resulting curves resemble an isotherm because the stability (reflected by A450) correlates with the PEGMUA coverage of the AuNR. The maximum absorbance shifts towards higher PEGMUA concentrations with increasing etching time. In these reactions no steady state is observed in the analyzed timeframe. The experiments demonstrate the high stabilization by PEGMUA that allows to utilize the reaction of coated AuNR with cyanide to study the ligand exchange. The stability of the AuNR, indicated by the absorbance at 450 nm, A450, in Fig. 2B and C, clearly correlates with the PEGMUA concentration.
Ligand-exchange is more efficient when assisted by chloroform extraction
Previous work suggests that chloroform extraction can efficiently remove CTAB from AuNR samples but the ligand exchange itself was not studied in detail.7,32,33 We were especially interested in comparing the ligand exchange assisted by extraction with chloroform to the ligand exchange without extraction. The extracted (extr) samples were mixed with 25 μM PEGMUA immediately before fivefold extraction with chloroform in order to avoid destabilization during the extraction. In preliminary experiments we observed that AuNR@CTAB aggregate completely within a few hours after chloroform extraction (Fig. S2†). This confirms that CTAB is efficiently removed, at least down to a concentration below the critical concentration necessary for stabilization of the AuNR. This critical concentration was identified by Lee et al. to be in the range 0.2–0.5 mM.14 After extraction, different amounts of PEGMUA were added, followed by incubation for 22 hours or 1 hour. Fig. 3 shows the resulting A450(c(PEGMUA))-curves for these samples after 300 minutes of etching with cyanide. They are compared to samples that were not extracted (no extr) but just reacted for the indicated times (22 or 65 hours) with PEGMUA as described above. The experiments with 22 h reaction time were repeated to assess their reproducibility (Fig. 3, extr/no extr 22 h and 22 h (2)). Three conclusions can be drawn: the reproducibility of the ligand exchange seems to be much better for the extracted samples, the amount of PEGMUA needed for maximum stabilization is much lower and the reaction time needed for maximum stabilization is much shorter. | ||
| Fig. 3 Comparison of the absorbances at 450 nm (A450) of different AuNR samples after 300 minutes reaction with 50 mM cyanide. All samples were prepared from the same batch of AuNR@CTAB (87 nm × 29 nm, batch 1) diluted to the same concentrations before reaction with different amounts of PEGMUA for different times as indicated. The reaction times for the extracted samples (extr, magenta) are the reaction times with PEGMUA after extraction with chloroform (immediately before chloroform extraction 25 μM PEGMUA were added for stabilization). The concentrations c(PEGMUA) for the extracted samples are the sum of concentrations added before and after extraction to allow for comparison with the samples that were not extracted. Lines are a guide to the eye. | ||
For the non-extracted samples the amount of PEGMUA for maximum stabilization is significantly lower when the AuNR@CTAB are reacted 65 hours compared to 22 hours reaction. We analyzed the long term stability of the PEGMUA ligand on AuNR by attenuated total reflection Fourier transform infrared spectroscopy (ATR-FTIR) and found no signs of hydrolysis in the time frame of 12 days (Fig. S3, ESI†). Thus, the changes in reactivity cannot be attributed to changes of the PEGMUA ligand itself, e.g. due to hydrolysis. This (compare samples reacted 22 hours with PEGMUA in Fig. 3) indicates that the ligand exchange is extremely slow and that overnight reaction is not sufficient for maximum exchange. All samples were prepared from the same batch of AuNR@CTAB with the same dilution. Based on the synthetic protocol we know that the maximum possible concentration of free CTAB in these samples was 3.7 mM. This underlines that even at low concentrations, CTAB strongly hinders the ligand exchange of AuNR, confirming the results of Lee et al.14 In contrast, no difference in c(PEGMUA) for maximum stabilization was observed for the extracted AuNR-samples even when they were reacted for just 1 hour. Thus, the ligand exchange is much faster when the samples are extracted. Interestingly, the stabilization of the extracted samples is even then significantly higher when no PEGMUA is added after extraction (first points at c(PEGMUA) = 25 μM in Fig. 3). The AuNR concentration c(AuNR) in these samples was ∼0.020 nM and based on a cylindrical model with geometrical parameters obtained by TEM analysis, the PEGMUA concentration necessary for maximum coverage of all AuNR can be estimated. Even a footprint of just 0.2 nm2 per PEGMUA molecule on the AuNR surface corresponding to a very high coverage, close to that of alkyl thiols on Au{111} surfaces47,48 would require less than 1 μM PEGMUA. In other words, the 25 μM PEGMUA added before chloroform extraction are at least 25 times the sufficient amount for maximum coverage of all AuNR. Keeping this in mind, the higher stability of the extracted samples with no PEGMUA added after extraction strongly indicates that some ligand exchange took place during the extraction procedure. This is possible because the ligand exchange is much faster and more efficient in the extracted samples.
Detailed study of the ligand exchange with assisting chloroform-extraction
To allow for direct comparison of extracted and non-extracted samples as described in the previous section, those samples were not purified by centrifugation, neither before, nor after extraction. The samples thus contained residual reagents from the AuNR-synthesis as silver nitrate (AgNO3), hydrochloric acid (HCl) and others. In another set of experiments, details of the ligand exchange assisted by extraction were studied. For these experiments, lower AuNR-concentrations (9.3 pM) and a lower cyanide concentration (25 mM) for the etching reactions were used and the samples were purified after extraction by centrifugation to minimize matrix effects. The etching kinetics of these samples cannot be quantitatively compared to those shown in Fig. 3, because the AuNR concentrations and the matrix and pH are different. For comparable sets of etching experiments it is important to ensure the same initial AuNR concentration and a comparable matrix and pH in all samples.36 Regarding the ligand exchange with extraction we focused on the following parameters: the concentration of PEGMUA before extraction c1(PEGMUA), the PEGMUA concentration after extraction c2(PEGMUA) and the reaction time after extraction t2. Detailed descriptions and discussion of all experiments are provided as ESI (pages 4–8, Fig. S4–S9, ESI†). Fig. 4 shows an exemplary set of experiments. A steady state is reached after 1290 minutes (21.5 h) etching time. Afterwards, the plots A450vs. c(PEGMUA) do not change significantly anymore in the higher concentration regime, even after a week (10080 minutes). The minimum PEGMUA concentration for maximum stabilization can be determined; in the experiments shown it was 65 μM (25 μM before extraction and 40 μM after extraction). We found that there is no benefit in using a large PEGMUA excess before extraction with chloroform because only small amounts will bind to the AuNR and unbound PEGMUA will be removed by the subsequent extraction. A reaction time after extraction, t2 = 30 minutes was already sufficient for high stabilization. With t2 = 2 hours the stabilization was just slightly better in some experiments. With reaction times t2 > 2 hours no further increase in stabilization was observed, suggesting once more a fast ligand exchange after extraction. Our experiments consistently demonstrate, that PEGMUA provides a very high degree of stabilization for AuNR. When AuNR are extracted with chloroform to remove as much CTAB as possible, the ligand exchange is more reproducible, much faster (∼1–2 hours vs. days), and about four times less ligand consuming.
 | ||
| Fig. 4 Comparison of the absorbances at 450 nm (A450) of AuNR samples after different times of reaction with 25 mM cyanide. The AuNR were reacted with 25 μM PEGMUA for 22 hours, extracted with chloroform and then again reacted with different PEGMUA concentrations c2(PEGMUA) for 2 hours. c(PEGMUA) is the sum of PEGMUA concentrations added before and after extraction (c1(PEGMUA) + c2(PEGMUA)). The numbers at the legend are the reaction times with cyanide in minutes. Outliers can result from aggregation/agglomeration, adhesion, sedimentation and turbidity. Lines are a guide to the eye. | ||
Alternative strategies to remove CTAB include centrifugation-based purification with water or ethanol.6–8,25,26 Repeated centrifugation with water involves the risk of irreversible aggregation and/or adhesion of the AuNR. Even if the AuNR were not destabilized during centrifugations, 2.5 times more PEGMUA was required in order to obtain a stability comparable to an extracted sample (Fig. S10, ESI†). Centrifugation-based purification with ethanol after 22 hours reaction with 25 μM or 50 μM PEGMUA was only occasionally successful; irreversible adhesion to vessel walls during the centrifugation steps occurred in some cases. However, if no adhesion occurred, a high stabilization, comparable to chloroform-extracted samples, was obtained (Fig. S11, ESI†), indicating efficient removal of CTAB. It can be concluded that several strategies can be used to remove CTAB during ligand exchange. However, extraction with chloroform is a mild procedure because it involves no centrifugation during CTAB removal. In our experiments it was the most reliable and efficient procedure to assist ligand exchange of AuNR@CTAB.
Comparison of PEGMUA and PEGSH
As the etching experiments indicated that a high PEGMUA coverage was achieved when the ligand exchange was assisted by chloroform-extraction, we tested if this is also possible with a typical PEG-ligand of the same length, PEGSH. Such ligands are commercially available and used in the vast majority of studies with PEGylated AuNR. The difference between PEGMUA and PEGSH is the C10 alkylene-spacer, that connects the Au-surface binding thiol group with the PEG-moiety via an ester group in the case of PEGMUA. In case of PEGSH, the poly(ethylene glycol)-chain is simply terminated by a thiol group. This changes the adsorption because attractive van der Waals (vdW) forces between the alkylene-units favor adsorption and dense packing,48,49 whereas PEG-interactions are repulsive in water,50,51 leading to a decreasing coverage of PEG-thiols on gold with increasing PEG-length.52 Additionally, PEGMUA and similar ligands form an inner hydrophobic layer when coated on nanoparticles, that provides an effective barrier for polar molecules.36,37 In the case of AuNR, the CTAB bilayer represents a somewhat similar barrier that has to be overcome for ligand exchange.11,15 It can be hypothesized that CTAB-removal, e.g. by chloroform-extraction, induces collapse of and defect sites within the CTAB bilayers on the AuNR,14 thereby assisting ligand exchange. To test this strategy for PEGSH we prepared AuNR@PEGSH samples accordingly. The stability of these samples against oxidative etching was much lower and just 5 mM of cyanide was used for the etching experiments. Fig. 5 shows the absorbance at 450 nm (A450) of AuNR@PEGSH in the presence of 5 mM cyanide in comparison to that of AuNR@PEGMUA, prepared with the same conditions, in the presence of 25 mM cyanide. All AuNR@PEGSH were completely etched within 2–3 hours with 5 mM cyanide. In contrast, at the fivefold cyanide concentration, AuNR@PEGMUA were significantly etched only if no PEGMUA was added after extraction (0 μM in Fig. 5) and even then, the sample was more stable than the AuNR@PEGSH samples. We tested longer reaction times t2 for AuNR@PEGSH up to 24 hours, but no effect on the stabilization was observed (Fig. S12, ESI†). Also, in terms of PEGSH addition after extraction, no trend was observed, i.e. higher PEGSH concentrations did not lead to higher stabilization (Fig. 5). This observation supports the idea that the structures of the according ligand layers are significantly different and that PEGMUA provides a better stabilization because of a higher grafting density and formation of an inner hydrophobic layer. A higher grafting density can be rationalized with the attractive vdW interactions discussed above. Another reason could be an improved penetration of the CTAB-layer by PEGMUA due to its amphiphilic character. This idea is illustrated in Scheme 1. | ||
| Fig. 5 Absorbance at 450 nm (A450) of AuNR@PEGSH (blue squares) in the presence of 5 mM cyanide and of AuNR@PEGMUA (magenta triangles) in the presence of 25 mM cyanide versus the reaction time. The concentrations indicated by the color code correspond to the additions of the corresponding PEG-ligand after extraction. The preparative conditions were the same for both sets of samples (t1 = 22 h reaction with c1 = 50 μM PEG-ligand before extraction and t2 = 2 h reaction after extraction). Lines are a guide to the eye. | ||
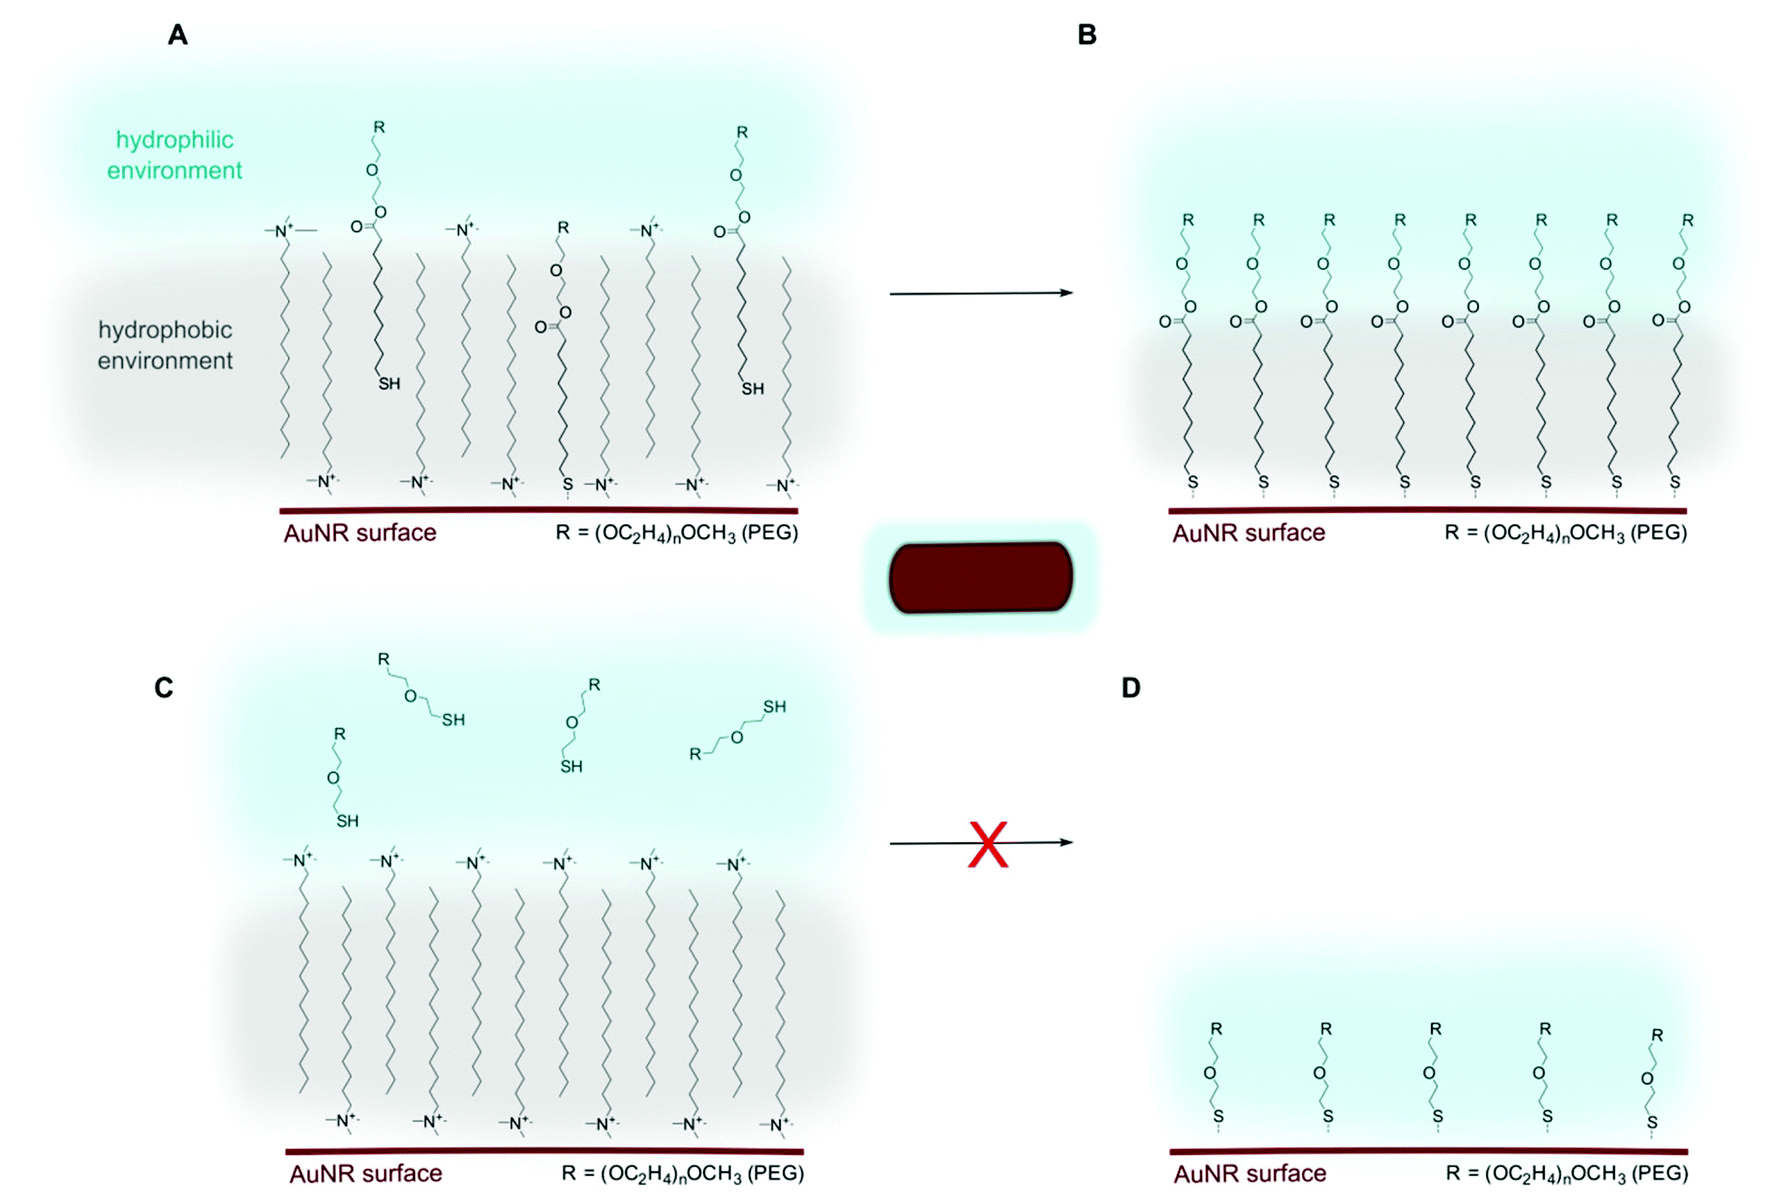 | ||
| Scheme 1 Ligand exchange of PEGMUA versus PEGSH in a simplified picture. Due to its amphiphilic character, PEGMUA can penetrate the hydrophobic CTAB-layer more readily (A) to successively form a ligand layer that is stabilized by similar cooperative effects, driven by the stronger binding of thiol-groups to Au. For PEGSH as a polar molecule it is unfavorable to penetrate the CTAB-layer (C) and consequently no, or less, ligand exchange takes place (D). This simplified model does not take into account residual CTAB and the higher complexity of the AuNRs’ surface chemistry including silver, bromide, oleate and reaction products remaining from their synthesis. | ||
According to this idea, the molecular structure of PEGMUA improves not only the shielding effect of the final ligand layer but is also favorable for the ligand exchange itself. Either the PEGSH ligand layer provides no comparable stabilization after formation, or the ligand exchange is less effective with PEGSH, or both.
Estimating the PEGMUA coverage
The better stabilization of AuNR against oxidative etching with PEGMUA compared to PEGSH could be exclusively due to hydrophobic effects and not to a higher grafting density. To explain then, that the hydrophobic CTAB bilayer does not provide comparable stabilization one might point out attractive electrostatic interactions (of cyanide ions and hexadecyltrimethylammonium groups in CTAB) or the assumed dynamic nature of the CTAB bilayer. Therefore we tried to assess the grafting density of PEGMUA in comparison to PEGSH when coated with the same conditions onto AuNR. This is especially relevant for biomedical applications of AuNR because a high PEG grafting density is correlated with a lower immunogenicity.31 The PEG coverage can be described with its Flory radius RF and the grafting distance D.50 In the “mushroom” regime with RF/D ≤ 1 the PEG-chains are in a relaxed conformation at low coverage, in the brush-regime with RF/D ≥ 1 the PEG-chains adopt a more stretched conformation due to intermolecular repulsive interactions.23,31,50,51 At very high coverage with RF/D ≥ 2.8 the PEG-coating enters the “dense-brush” regime that was found to be most favorable in terms of immune response and clearance.31 A dense PEG-brush on AuNR of dimensions used in this work requires at least several thousands of PEG-ligands per AuNR. In contrast, Hore et al. have recently presented small angle neutron scattering (SANS) data that indicate a coverage of just 6–10 PEGSH molecules (5 kDa) per AuNR using standard coating procedures.12 Thus, new strategies to achieve higher PEG grafting densities on AuNR are highly desirable.We prepared highly concentrated samples of AuNR@PEGSH and AuNR@PEGMUA to assess the number of PEG-molecules per AuNR by NMR and IR. About 80% of AuNR@PEGSH were lost during concentration due to irreversible adhesion to vessel walls and possibly aggregation, whereas in the case of AuNR@PEGMUA just ∼20% were lost (Fig. S13, ESI†). This observation underlines once more the better stabilization by PEGMUA compared to PEGSH. The final samples, that were concentrated and purified, were analyzed by ATR-FTIR. Resulting spectra are shown in Fig. 6. The PEG molecules can be identified by their characteristic ether-vibrations (C–O stretch) at ∼1060 cm−1. In this region no CTAB vibrations are present. The IR-spectra of AuNR@PEGMUA and AuNR@PEGSH (Fig. 6C) strongly indicate that substantially more PEGMUA is bound to the AuNR than PEGSH. The amount of PEGMUA in the concentrated sample AuNR@PEGMUA (c = 2.6 nM) was detectable by NMR but not sufficient for a quantitative analysis. Therefore, a higher amount of AuNR@PEGMUA was prepared, concentrated and purified. In every step of the procedure, supernatants were collected and lyophilized as detailed in the Experimental section. The gold and silver content was determined by elementary analysis and the PEGMUA, CTAB and oleate content was analyzed qualitatively and estimated by NMR. The amount of silver relative to gold in AuNR@PEGMUA samples decreased during the ligand exchange and purification from ∼16% after the first reaction with PEGMUA before extraction to 2% after extraction and second reaction with PEGMUA. In the final purified sample the relative amount of silver was ∼1%. This was confirmed by HR-STEM-EDX (high resolution-scanning transmission electron microscopy-energy dispersive X-ray spectroscopy) analysis that also confirmed that the silver is located at or near the AuNR surfaces (Fig. S14, S15 and Tables S1, S2, ESI†) in accordance with previous reports.53 Silver can be the cause for unwanted toxicity in biological and biomedical applications of AuNR and complicates the surface chemistry of the AuNR. It is therefore desirable to remove as much silver as possible.27 In the NMR analysis, CTAB could not be identified unambiguously in the final sample but matrix assisted laser desorption ionization-time of flight mass spectrometry (MALDI-TOF) analyses suggested that residual CTAB was present in all studied purified samples. A detailed discussion is provided as ESI (p. 13).†
 | ||
| Fig. 6 ATR-FTIR-analysis of AuNR-samples. Comparison of AuNR@CTAB (grey line) with pure CTAB (orange line) (A), comparison of highly concentrated and purified AuNR@PEGMUA (pink line) with pure PEGMUA (grey line) (B) and comparison of AuNR@CTAB (dark grey line), AuNR@PEGSH (blue line) and AuNR@PEGMUA (magenta line) (C). The PEGMUA spectrum is also shown (grey line) and offset for clarity. The vibration at ν ∼ 1700 cm−1 in A stems from oleate in the AuNR@CTAB sample. The CO2 vibration-related peaks were removed for most spectra and the backgrounds were accounted for with a second order polynomial and subtracted. Spectra were normalized at the asymmetric methylene vibrations (ν = 2918 cm−1). | ||
The NMR analyses during the ligand exchange and purification confirmed that more PEGMUA reacts with the AuNR after extraction than before. After purification by repeated centrifugation the AuNR@PEGMUA were etched with 250 mM cyanide to ensure their complete dissolution and then lyophilized. The residues were dissolved in CDCl3 and D2O for NMR-analysis. The NMR samples were calibrated with iodoform (in CDCl3) or acetonitril (in D2O), the NMR-spectra are shown in Fig. S16, ESI.† The analysis revealed that PEGMUA was hydrolyzed by the harsh etching conditions. Complementary MALDI-TOF analyses confirmed the presence of PEG and indicated that also partial oxidation of the PEG-chains might have had occurred during the etching. Quantifying the PEG content based on the NMR-data shown in Fig. S16† yielded a total PEG-concentration of ∼300 μM. The AuNR concentration was determined by graphite-furnace atomic absorption spectrometry (GF-AAS) to be 16 nM and confirmed by UV/Vis-based determination as described by Liz-Marzán's group.40 This estimation suggests that indeed a very dense PEG-layer was obtained on the AuNR with a PEGMUA-footprint of 0.30–0.35 nm2 corresponding to PEGMUA grafting densities of 2.9–3.3 nm−2. The ATR-FTIR spectrum of these highly concentrated AuNR@PEGMUA (not etched) also confirms the presence of large amounts PEGMUA (Fig. 6B). Because of the higher concentration of the AuNR, more spectral features of the ligand can be identified and correlate very well with the spectral signature of PEGMUA. Also, in contrast to the free ligand PEGMUA, no thiol vibration at 2559 cm−1 was observed. Even though the accuracy of the value for the grafting density is limited by the experimental conditions it can be concluded with high confidence that a footprint ≪1 nm2 and a PEG-layer in the dense brush regime was obtained. Thus, ∼1650 times more PEG-chains per nm2 are bound than in the study of Hore et al., where similar AuNR were used,12 and ∼60 times more than in the study of Xia et al., also using AuNR with similar dimensions.30 In these studies, longer PEG-chains were used (5 kDa in contrast to 2 kDa used herein), but this alone cannot explain the huge difference in bound PEG. With advanced PEGylation strategies higher grafting densities can probably be achieved, but were not quantitatively determined in all studies. In the work of Kinnear et al. the PEG-grafting density was estimated based on TGA experiments to be 0.89 PEG nm−2.25 TGA-based determination of the PEG-grafting density can be problematic because CTAB was also present in the ligand layer, but the estimation should be still valid because the molecular mass of CTAB is much smaller than that of the PEG-thiol (5 kDa) used in their study.
The strategy of using PEGMUA, a PEG ligand with an optimized molecular structure, is complementary to promising strategies reported so far. In future work it should be tested if the combination of advanced PEGylation strategies and PEGMUA can improve even further the results of the ligand exchange.
Conclusion
In conclusion, our experiments consistently demonstrate that the PEGylation of AuNR can be dramatically improved by tailoring the molecular structure of the PEG-ligand. The mechanical and chemical stabilization is much higher and higher grafting densities are achieved when PEGMUA is used instead of PEGSH of the same length.Because PEGMUA stabilizes AuNR against oxidative etching with cyanide very well, this etching reaction can be utilized as an analytical tool to study the ligand exchange. We observed that the ligand exchange is much faster and more reproducible, when CTAB is removed by chloroform extraction and that at least 50% less ligand is needed for maximum stabilization. Alternative strategies to reduce the amount of CTAB and assist the ligand exchange were less effective and less reliable. With extraction assisted ligand exchange, sufficiently high concentrations of AuNR@PEGMUA could be prepared and purified to allow quantitative NMR spectroscopy analysis. A grafting density in the order of 2.9–3.3 nm−2 was estimated for PEGMUA on AuNR, corresponding to a footprint of 0.30–0.35 nm2. In future studies it should be tested if quantitative CTAB and oleate removal is possible with advanced purification strategies. The toxicity of AuNR@PEGMUA has to be also addressed. For spherical AuNP coated with PEGMUA no toxicity was observed so far, neither in vitro37,39 nor in vivo.38 This raises the hope that PEGMUA will enable to synthesize highly concentrated AuNR with very low or no toxicity with potential applications in biological and medical imaging and photothermal therapy.
Acknowledgements
F. S., H. W. and H. L. acknowledge financial support from the German Research Foundation (DFG) via the Cluster of Excellence “Centre for Ultrafast Imaging” (CUI). The authors thank Dr Maria Riedner and her team for mass spectrometry measurements, Dr Thomas Hackl and his team for NMR-service, Dr Frank Meyberg and his team for GF-AAS measurements, Andreas Kornowski for HR-STEM-EDX analysis and Agnes Weimer, Maximilian Schwarz, Sebastian Graf and Konstantin Krutzke for assistance with preliminary experimental work while completing an advanced practical research placement as part of their degree program.Notes and references
- D. J. de Aberasturi, A. B. Serrano-Montes and L. M. Liz-Marzán, Adv. Opt. Mater., 2015, 3, 602–617 CrossRef.
- A. M. Alkilany, S. E. Lohse and C. J. Murphy, Acc. Chem. Res., 2013, 46, 650–661 CrossRef CAS PubMed.
- E. C. Dreaden, A. M. Alkilany, X. Huang, C. J. Murphy and M. A. El-Sayed, Chem. Soc. Rev., 2012, 41, 2740–2779 RSC.
- N. Khlebtsov and L. Dykman, Chem. Soc. Rev., 2011, 40, 1647–1671 RSC.
- C. J. Murphy, A. M. Gole, J. W. Stone, P. N. Sisco, A. M. Alkilany, E. C. Goldsmith and S. C. Baxter, Acc. Chem. Res., 2008, 41, 1721–1730 CrossRef CAS PubMed.
- L. Vigderman, B. P. Khanal and E. R. Zubarev, Adv. Mater., 2012, 24, 4811–4841 CrossRef CAS PubMed.
- A. S. D. S. Indrasekara, R. C. Wadams and L. Fabris, Part. Part. Syst. Char., 2014, 31, 819–838 CrossRef CAS.
- E. Locatelli, I. Monaco and M. Comes Franchini, RSC Adv., 2015, 5, 21681–21699 RSC.
- A. M. Alkilany, P. K. Nagaria, C. R. Hexel, T. J. Shaw, C. J. Murphy and M. D. Wyatt, Small, 2009, 5, 701–708 CrossRef CAS PubMed.
- A. M. Alkilany, R. L. Frey, J. L. Ferry and C. J. Murphy, Langmuir, 2008, 24, 10235–10239 CrossRef CAS PubMed.
- S. Gómez-Graña, F. Hubert, F. Testard, A. Guerrero-Martínez, I. Grillo, L. M. Liz-Marzán and O. Spalla, Langmuir, 2012, 28, 1453–1459 CrossRef PubMed.
- M. J. A. Hore, X. Ye, J. Ford, Y. Gao, J. Fei, Q. Wu, S. J. Rowan, R. J. Composto, C. B. Murray and B. Hammouda, Nano Lett., 2015, 15, 5730–5738 CrossRef CAS PubMed.
- H. Katz-Boon, M. Walsh, C. Dwyer, P. Mulvaney, A. M. Funston and J. Etheridge, Nano Lett., 2015, 15, 1635–1641 CrossRef CAS PubMed.
- S. Lee, L. J. E. Anderson, C. M. Payne and J. H. Hafner, Langmuir, 2011, 27, 14748–14756 CrossRef CAS PubMed.
- B. Nikoobakht and M. A. El-Sayed, Langmuir, 2001, 17, 6368–6374 CrossRef CAS.
- N. Almora-Barrios, G. Novell-Leruth, P. Whiting, L. M. Liz-Marzán and N. López, Nano Lett., 2014, 14, 871–875 CrossRef CAS PubMed.
- M. Grzelczak, J. Pérez-Juste, P. Mulvaney and L. M. Liz-Marzán, Chem. Soc. Rev., 2008, 37, 1783–1791 RSC.
- C. Grabinski, N. Schaeublin, A. Wijaya, H. D'Couto, S. H. Baxamusa, K. Hamad-Schifferli and S. M. Hussain, ACS Nano, 2011, 5, 2870–2879 CrossRef CAS PubMed.
- N. Khlebtsov and L. Dykman, Chem. Soc. Rev., 2011, 40, 1647–1671 RSC.
- R. G. Rayavarapu, W. Petersen, L. Hartsuiker, P. Chin, H. Janssen, F. W. B. van Leeuwen, C. Otto, S. Manohar and T. G. van Leeuwen, Nanotechnology, 2010, 21, 145101 CrossRef PubMed.
- L. Wang, X. Jiang, Y. Ji, R. Bai, Y. Zhao, X. Wu and C. Chen, Nanoscale, 2013, 5, 8384–8391 RSC.
- T. Niidome, M. Yamagata, Y. Okamoto, Y. Akiyama, H. Takahashi, T. Kawano, Y. Katayama and Y. Niidome, J. Controlled Release, 2006, 114, 343–347 CrossRef CAS PubMed.
- J. V. Jokerst, T. Lobovkina, R. N. Zare and S. S. Gambhir, Nanomedicine, 2011, 6, 715–728 CrossRef CAS PubMed.
- A. S. Karakoti, S. Das, S. Thevuthasan and S. Seal, Angew. Chem., Int. Ed., 2011, 50, 1980–1994 CrossRef CAS PubMed.
- C. Kinnear, H. Dietsch, M. J. D. Clift, C. Endes, B. Rothen-Rutishauser and A. Petri-Fink, Angew. Chem., Int. Ed., 2013, 52, 1934–1938 CrossRef CAS PubMed.
- H. Liao and J. H. Hafner, Chem. Mater., 2005, 17, 4636–4641 CrossRef CAS.
- K. Liu, Y. Zheng, X. Lu, T. Thai, N. A. Lee, U. Bach and J. J. Gooding, Langmuir, 2015, 31, 4973–4980 CrossRef CAS PubMed.
- A. Wijaya and K. Hamad-Schifferli, Langmuir, 2008, 24, 9966–9969 CrossRef CAS PubMed.
- Z. Zhang and M. Lin, RSC Adv., 2014, 4, 17760–17767 RSC.
- X. Xia, M. Yang, Y. Wang, Y. Zheng, Q. Li, J. Chen and Y. Xia, ACS Nano, 2012, 6, 512–522 CrossRef CAS PubMed.
- Q. Yang, S. W. Jones, C. L. Parker, W. C. Zamboni, J. E. Bear and S. K. Lai, Mol. Pharm., 2014, 11, 1250–1258 CrossRef CAS PubMed.
- H. Takahashi, Y. Niidome, T. Niidome, K. Kaneko, H. Kawasaki and S. Yamada, Langmuir, 2006, 22, 2–5 CrossRef CAS PubMed.
- C. Yu, L. Varghese and J. Irudayaraj, Langmuir, 2007, 23, 9114–9119 CrossRef CAS PubMed.
- L. Vigderman, P. Manna and E. R. Zubarev, Angew. Chem., Int. Ed., 2012, 51, 636–641 CrossRef CAS PubMed.
- I. García, A. Sánchez-Iglesias, M. Henriksen-Lacey, M. Grzelczak, S. Penadés and L. M. Liz-Marzán, J. Am. Chem. Soc., 2015, 137, 3686–3692 CrossRef PubMed.
- F. Schulz, T. Vossmeyer, N. G. Bastús and H. Weller, Langmuir, 2013, 29, 9897–9908 CrossRef CAS PubMed.
- T. A. Larson, P. P. Joshi and K. Sokolov, ACS Nano, 2012, 6, 9182–9190 CrossRef CAS PubMed.
- F. Papastefanaki, I. Jakovcevski, N. Poulia, N. Djogo, F. Schulz, T. Martinovic, D. Ciric, G. Loers, T. Vossmeyer, H. Weller, M. Schachner and R. Matsas, Mol. Ther., 2015, 23, 993–1002 CrossRef CAS PubMed.
- F. Schulz, D. Lutz, N. Rusche, N. G. Bastus, M. Stieben, M. Holtig, F. Gruner, H. Weller, M. Schachner, T. Vossmeyer and G. Loers, Nanoscale, 2013, 5, 10605–10617 RSC.
- L. Scarabelli, A. Sánchez-Iglesias, J. Pérez-Juste and L. M. Liz-Marzán, J. Phys. Chem. Lett., 2015, 6, 4270–4279 CrossRef CAS PubMed.
- X. Ye, C. Zheng, J. Chen, Y. Gao and C. B. Murray, Nano Lett., 2013, 13, 765–771 CrossRef CAS PubMed.
- M. Thiry, K. Boldt, M. S. Nikolic, F. Schulz, M. Ijeh, A. Panicker, T. Vossmeyer and H. Weller, ACS Nano, 2011, 5, 4965–4973 CrossRef CAS PubMed.
- B. C. Mei, E. Oh, K. Susumu, D. Farrell, T. J. Mountziaris and H. Mattoussi, Langmuir, 2009, 25, 10604–10611 CrossRef CAS PubMed.
- S. Link and M. A. El-Sayed, Int. Rev. Phys. Chem., 2000, 19, 409–453 CrossRef CAS.
- H. Yuan, K. P. F. Janssen, T. Franklin, G. Lu, L. Su, X. Gu, H. Uji-i, M. B. J. Roeffaers and J. Hofkens, RSC Adv., 2015, 5, 6829–6833 RSC.
- S. K. Ghosh and T. Pal, Chem. Rev., 2007, 107, 4797–4862 CrossRef CAS PubMed.
- P. Harder, M. Grunze, R. Dahint, G. M. Whitesides and P. E. Laibinis, J. Phys. Chem. B, 1998, 102, 426–436 CrossRef CAS.
- J. C. Love, L. A. Estroff, J. K. Kriebel, R. G. Nuzzo and G. M. Whitesides, Chem. Rev., 2005, 105, 1103–1170 CrossRef CAS PubMed.
- D. J. Lavrich, S. M. Wetterer, S. L. Bernasek and G. Scoles, J. Phys. Chem. B, 1998, 102, 3456–3465 CrossRef CAS.
- H. Lee, A. H. de Vries, S.-J. Marrink and R. W. Pastor, J. Phys. Chem. B, 2009, 113, 13186–13194 CrossRef CAS PubMed.
- R. R. Netz and D. Andelman, Phys. Rep., 2003, 380, 1–95 CrossRef CAS.
- K. Rahme, L. Chen, R. G. Hobbs, M. A. Morris, C. O'Driscoll and J. D. Holmes, R. Soc. Chem. Adv., 2013, 3, 6085–6094 CAS.
- S. R. Jackson, J. R. McBride, S. J. Rosenthal and D. W. Wright, J. Am. Chem. Soc., 2014, 136, 5261–5263 CrossRef CAS PubMed.
Footnote |
| † Electronic supplementary information (ESI) available: TEM and STEM-EDX analyses of AuNR, ATR-FTIR spectra of AuNR and ligands, UV/vis-spectroscopy based experiments addressing the ligand exchange and the stability of PEGylated AuNR, discussion of residual CTAB, NMR-spectra of etched PEGylated AuNR. See DOI: 10.1039/c6nr00607h |
| This journal is © The Royal Society of Chemistry 2016 |