 Open Access Article
Creative Commons Attribution 3.0 Unported Licence
Relative edge energy in the stability of transition metal nanoclusters of different motifs†
X. J.
Zhao
a,
X. L.
Xue
a,
Z. X.
Guo
b and
S. F.
Li
*a
aInternational Laboratory for Quantum Functional Materials of Henan, School of Physics and Engineering, Zhengzhou University, Zhengzhou, Henan 450001, China. E-mail: sflizzu@zzu.edu.cn
bDepartment of Chemistry, University College London, London WC1H 0AJ, UK
First published on 3rd May 2016
Abstract
When a structure is reduced to a nanometer scale, the proportion of the lowly-coordinated edge atoms increases significantly, which can play a crucial role in determining both their geometric and electronic properties, as demonstrated by the recently established generalized Wulff construction principle [S. F. Li, et al., Phys. Rev. Lett., 2013, 111, 115501]. Consequently, it is of great interest to clarify quantitatively the role of the edge atoms that dominate the motifs of these nanostructures. In principle, establishing an effective method valid for determining the absolute value of the surface energy and particularly the edge energy for a given nanostructure is expected to resolve such a problem. However, hitherto, it is difficult to obtain the absolute edge energy of transition metal clusters, particularly when their sizes approach the nanometer regime. In this paper, taking Ru nanoclusters as a prototypical example, our first-principles calculations introduce the concept of relative edge energy (REE), reflecting the net edge atom effect over the surface (facet) atom effect, which is fairly powerful to quasi-quantitatively estimate the critical size at which the crossover occurs between different configurations of a given motif, such as from an icosahedron to an fcc nanocrystal. By contrast, the bulk effect should be re-considered to rationalize the power of the REE in predicting the relative stability of larger nanostructures between different motifs, such as fcc-like and hcp-like nanocrystals.
Introduction
For a given elemental bulk crystal, the surfaces with different indices usually display contrasting electronic, magnetic, catalytic, optical, and mechanical properties, due to the symmetry breaking and the resulting different local surface structures and electronic states.1,2 Correspondingly, the physical and chemical properties of some low-dimensional systems, such as nanoclusters or nanoparticles, are often very different from their bulk counterparts.3–6 On the one hand, this difference is due to the large surface-to-volume ratio of a given nanocluster with the lowly-coordinated surface atoms exhibiting high activities and distinct properties; on the other hand, it is due to the quantum size effect which is endowed with many practical applications.7,8 Among these nanoclusters or nanoparticles, transition metal (TM) systems have gained particular attention because of their exotic catalysis potential in contrast to their bulk phases.9–14 For example, gold is well known as a noble metal due to its highly inert properties; however, gold nanoclusters possess intriguing catalytic activities,11,12 partially due to their surface structures and quantum size effect, as mentioned before. Another example is Ru; Ru nanoclusters were reported to show enhanced chemical activity toward H2O splitting relative to their bulk counterpart, Ru(0001) surface.13,14Here, we emphasize that with further reduction of the cluster size, the atoms on the edges constructed by the intersection of the adjacent mini-facets become increasingly important in determining the physical and chemical properties of a given polyhedral cluster.15–20 On the one hand, the fraction of the edge atoms considerably increases, on the other hand, the coordination numbers of the edge atoms are further reduced; both result in d-type dangling bonds and extra chemical activities, compared with the facet atoms.21,22 Recently, we identified that the classic Wulff construction principle (CWCP) should be generalized to emphasize the edge atom effect to identify both the geometric structure and the magic number of TM nanoclusters,21,22 as also strongly supported by experiments.23 Edge atoms have also been found to play a critically important role in catalysis.19,20,24,25 For example, N2 dissociation on the Ru(0001) surface is totally dominated by the step edges where the measured adsorption rate is at least nine orders of magnitude higher than that on the terraces at 500 K.24 For water-gas-shift catalysis, it is identified that those metallic corner atoms located on the intersection of adjacent step edges of gold clusters act as the dominant active components.26 In addition, in Jaramillo's work,27 it is shown that the electrocatalytic activity measurements for hydrogen evolution correlate linearly with the number of edge sites of MoS2 particles.
Consequently, it is of great interest to identify quantitatively or quasi-quantitatively the role of edge atoms in the configuration and hence the properties of a given TM nanostructure. In principle, establishing an effective method of determining the accurate value of the edge energy for a given nanostructure is expected to resolve such a problem. However, up to date, it is still intractable to quantitatively obtain the absolute edge energies of a given nanostructure in the framework of first-principles calculations, though the surface properties and surface energies28–31 of various crystals have been extensively studied and can be accurately determined. Only limited work has been done to estimate quantitatively the edge energy of nanoclusters. For example, by using an empirical potential and continuum approach,32 simulations reveal negligible edge energy for some noble TM nanoclusters. In this paper, first of all, choosing a Ru55 cluster as a prototypical example, we identify that the previously proposed continuum method32 is inadequate for calculating the edge energy of a given TM particle, when the size approaches the nanometer regime, due to the discontinuity of the energy density originating from the localized d-type dangling bonds on the edges. Thus, we establish a concept of REE reflecting the net edge atom effect over the surface (facet) atom to estimate the critical size at which a crossover occurs between different configurations of a given motif (such as fcc-like). Furthermore, to rationalize the predictive power of the REE in determining the stabilities of different larger nanocluster motifs, such as fcc-like relative to hcp-like nanocrystals, the bulk effect of the nanocluster core should also be invoked.
Methods
The calculations were carried out in the framework of density functional theory33 within the spin-polarized generalized gradient approximation (GGA)34 as implemented in the VASP code.35 The interaction of the valence electrons with the ionic core is described with the projector augmented wave (PAW)36 method. The atomic positions of a cluster are fully optimized in a big simple cubic supercell, to ensure that the cluster–cluster distance between the nearest neighboring periodic images is larger than 13 Å and the coupling between the clusters of neighboring images is negligible. The convergence criterion of the electronic loop is adopted up to 10−5 eV and the force convergence less than 0.01 eV per Å per atom. In our calculations, similar to our previous investigations,21,22 we have made necessary routine numerical checks on the reliability of the calculation methods, including the supercell size, the energy cutoff, the accuracy of the detailed electron–ion interaction potential and exchange–correlation functional, etc. To obtain the ground state configurations of the TM clusters, we have considered many initial candidate configurations manually constructed or computationally generated via high-temperature first-principles molecular dynamics simulations. We have also carried out selective checks on the optimized structures using the particle swarm optimization (CALYPSO) code.37,38Results and discussion
Examination of the continuum approach in estimating the edge energy
In this subsection, we first briefly introduce the continuum approach proposed by Hamilton32 in estimating the edge energy for a polyhedral cluster. In this method, the shape of a given polyhedral cluster, such as an icosahedron (Ih), perceived widely as the most stable structural candidate based on the CWCP, is represented by intersecting flat surfaces forming straight edges consisting of N atoms, as presented in the inserted geometric model in Fig. 1. Given this assumption, the total energies of polyhedral cluster series, whose stacking form is independent on the edge length, can be written in the form:| ETotal = Al3 + Bl2 + Cl + D | (1) |
| (n − 1)d ≤ l ≤ nd | (2) |
 | (3) |
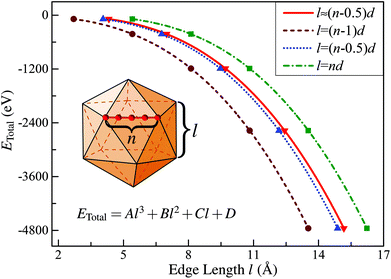 | ||
| Fig. 1 Calculated total energy of Ih-RuN clusters (N = 13, 55, 147, 309, 561) as a function of the edge length for four different definitions of l. The curve labeled “l ≈ (n − 0.5)d” corresponds to the value obtained using eqn (3) in the text. | ||
One can get that l ≈ (n − 0.5)d.
Then, taking RuN clusters (N = 13, 55, 147…) as typical examples, we demonstrate that although the edge length can be precisely defined as introduced, this continuum approach is still not applicable for estimating the edge energy of nanoclusters in the framework of first-principles calculations. To address this point, we first calculated the total energies (ETotal) of a series of Ih-RuN clusters with N = 13, 55, 147, 309, 561, then we plot the ETotal as a function of l, as represented by the curve labeled “l ≈ (n − 0.5)d” in Fig. 1. According to the continuum approach, by fitting the calculated data of ETotal as expressed in eqn (1) and Fig. 1, one can get the bulk, surface, edge, and the vertex (corner) energies, which relate directly to the coefficients A, B, C and D, respectively, as shown in Table 1. Unfortunately, though we can obtain a negative value for the coefficient A and positive values for both B and C, the last term D has a totally wrong sign: D = −4.529 eV! For further comparison, we have also considered other three choices for the definition of the edge length l, namely, (n − 1)d, (n − 0.5)d, and nd, and plotted the ETotal curves as a function of l with these new definitions. It is found that all these three new definitions result in similar values for the coefficient A to the case with precisely defined edge length, however, none of those can consistently yield reasonable signs for all the four coefficients, A, B, C, and D. Thus we can conclude that the previously established continuum approach is invalid to determine correctly the edge energy of a given polyhedral TM cluster, at least in the nanometer size range investigated.
| A | B | C | D | |
|---|---|---|---|---|
| ≈(n − 0.5)d | −1.454 | 1.209 | 3.094 | −4.529 |
| =(n − 1)d | −1.522 | −4.917 | −5.904 | −3.983 |
| =(n − 0.5)d | −1.522 | 1.261 | −0.957 | −1.227 |
| =nd | −1.522 | 7.439 | −12.728 | 6.146 |
We now discuss in more detail the underlying mechanism why the continuum approach is insufficient to estimate the edge energy of the present RuN nanoclusters. In principle, the continuum theory stresses the gradual quantitative transitions of a variation without abrupt changes or discontinuities. Therefore, in Hamilton's continuum approach32 of calculating the edge energy, the energy density is essentially supposed to be close to a constant within the whole “cluster domain” enveloped by the dividing surface, because the empirical potential intrinsically cannot provide such important information reflecting the abrupt changes in the electronic structures on different local sites, such as on the edges as compared to the inner sites or facet sites. Particularly, on the edge sites, the atoms are more lowly-coordinated than those of the inner or the facet atoms, therefore the edge atoms possess significantly different bonding features and stabilities as compared to the latter.
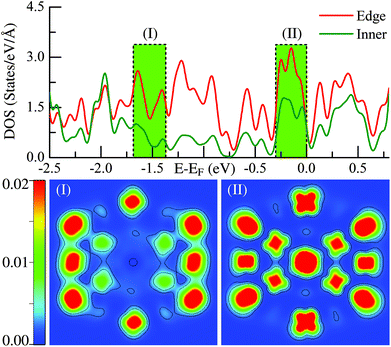
The above statements are further supported by the detailed local electronic structure analysis. As a typical example, the electronic charge density (see the lower panel) projected onto the high-symmetry plane bisecting the Ih-Ru55 cluster in two representative energy windows (see the upper panel) are presented in Fig. 2. Significantly, on the edge sites of the Ih-Ru55, the electronic charge density shows strong features of directional d-type dangling bonds (Fig. 2(II)) around the Fermi level, particularly compared to the charge density in the similar energy window far below the Fermi level, see Fig. 2(I). Such high electronic density of states of the edge atoms by the Fermi level (Fig. 2) results in considerable energy increases (see also ref. 21) and contrast edge properties, which cannot be accounted for by a continuum approach, and thus is the main reason why the above continuum approach is invalid to estimate the edge energy.
Relative edge energy
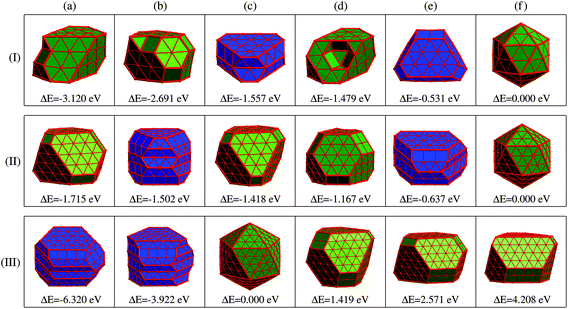
Given the identified issues above, we aim to propose a new concept of REE based on the analysis of the energetics of the optimized low-energy structures obtained by substantial DFT simulations, as will be discussed later.Panel (I) of Fig. 3 displays six representative low-energy Ru55 structures optimized from various initial configurations (some of these configurations were also reported previously in ref. 21). These structures can be grouped into three types of motif, fcc-like (structures (a), (b), and (d)), Ih (f), and the others hcp-like ((c) and (e)) configurations. Due to their similar geometries, we present the fcc-like and Ih structures in the same color, and show the hcp-like by differently colored polyhedra, respectively. The three low-symmetry structures in Fig. 3(I-a), (-b) and (-d) are found to be much lower in energy than the high-symmetry Ih (see structure (f)), by 3.120, 2.691, and 1.479 eV, respectively. As reported in our previous paper,21 these three stable structures can be optimized from an fcc crystal fragment (FCCCF). For more details on the geometric structures, thermal dynamic and kinetic stabilities, see ESI, S1.†
To assess the importance of the edge atom effect in determining the relative stability of the above structures within a given motif, we qualitatively separate the total energy of a given polyhedral cluster of size N into three terms:
| ETotal = EBulk + ESurf + EEdge | (4) |
We can now estimate ESurf by the total surface area times the energy per unit area, and EEdge by the total edge length times the energy per unit length. Additionally, the total surface area and total edge length of these four representative structures can be expressed as NSurf × δ and NEdge × λ, respectively. Here, NSurf and NEdge denote the total numbers of triangularly shaped mini-facets defined by the three adjacent atoms on the surfaces and the total numbers of the atomic bonds defined on the edges,21 respectively. Correspondingly, the average area δ per triangularly shaped mini-facet and the average length λ per atomic bond on the edges can be taken as constants due to their negligible fluctuation (within ∼2%) between different structures. First, as indicated in Fig. 4(b), each of the three more stable FCCCF structures in panel (I) of Fig. 3 possess a larger total surface area (NSurf) than the Ih structure. Furthermore, the Ih structure contains 20 fcc(111) mini-facets, while the mini-facets on the three new cluster structures are either also fcc(111)-like, or are bcc(100)-like with higher energy per unit area, showing that each new structure corresponds to a higher ESurf than the Ih structure.
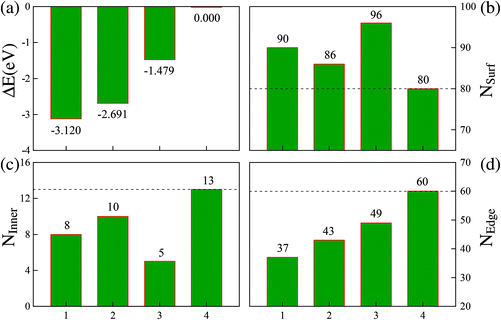 | ||
| Fig. 4 Relative energies and atomic arrangements of four Ru55 low energy structures with configurations 1, 2, 3, and 4 corresponding to the structures shown in Fig. 3(I-a), (-b), (-d), and (-f), respectively. The relative energies are measured from that of the Ih structure, given by ΔE = E(TMN) − E(TMN(Ih)). | ||
Based on these analyses, we must attribute the overall energy reductions associated with the three FCCCF structures to the dramatic reductions in the third term, EEdge. Indeed, as shown in Fig. 4(d), we find that each of the three FCCCF structures has a significantly reduced total edge length (NEdge) as compared to the Ih structure. We also observe a close correspondence between the total energies shown in Fig. 4(a) and the total edge lengths in Fig. 4(d), while such a correspondence is absent between Fig. 4(a) and (b) or (c), confirming that the edge atom effect is the dominant factor in determining both the energetic stability and the geometric structure of these nanoclusters.21
Because we have convincingly identified that the total energy differences (ΔE) of these structures are dominated by the edge atom effects, the observation of the close correspondence between the variation of the quantitative values of the total energies and the difference of the total edge length (ΔL) of these structures provides us with a good opportunity to estimate the average edge energy. Namely, the average edge energy per unit length (Eedge) can be semi-quantitatively obtained in the lowest boundary approximation as ΔE/ΔL. For example, taking the Ih structure as a reference, the Eedge of the FCCCF nanocluster series can be specifically defined as:
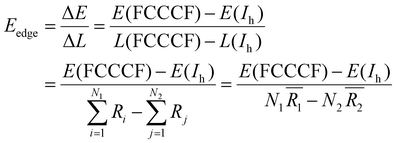 | (5) |
 (i = 1, 2) represents the total number (average bond length) of the nearest neighboring bonds on the edges, and the subscript index 1 (2) denotes the FCCCF (Ih) structure, respectively. Here, we must emphasize that according to such a definition, the actual value of the edge energy is underestimated since part of the edge energy has been balanced by the surface energy increase, therefore, we should endow a concept of relative (or net) edge energy to ΔE/ΔL. As discussed, on the edges, the d-type dangling bonds result in high DOS by the Fermi level and hence lead to extra instability. Therefore, the smaller the REE, the more stable the cluster, which endows the REE as a good descriptor to analyze the relative stabilities of different structures. Furthermore, to reduce the random choice of ΔE/ΔL, the relative energies (ΔE) of ten low-energy FCCCF structures and their corresponding edge length difference (ΔL) are statistically shown in Fig. 5(a). Correspondingly, based on a linear fitting, one can see that the minimum value of average edge energy per unit length is close to the slope of the fitting line, ∼50 meV Å−1, which is significantly larger than the value of 12.2 meV Å−1 obtained by the continuum approach32 in the framework of empirical potential calculations performed using the LAMMPS code.39
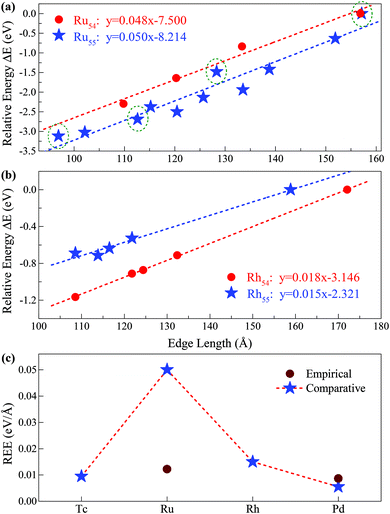 | ||
| Fig. 5 Relative edge energy (REE). The least square fitting of the REEs of (a) ten (three) fcc-like configurations and the Ih cluster as a function of the total edge length for Ru55 (Ru54) clusters. The olive circled pentacles correspond to the low-energy structures of Ru55 presented in Fig. 3(I-a), (-b), (-d) and (-f), and other low-energy isomers of Ru55 and Ru54 are provided in ESI, S1 and S2,† respectively; (b) four fcc-like configurations and the Ih cluster as a function of the total edge length for Rh54 and Rh55 clusters. (c) Comparison between the REEs obtained by the present comparative method based on first-principles calculations and that by the empirical potential approach for Ru and other prototypical TM elements. | ||
Note that Ih is a highly strained structure with a volumetric strain contribution to the energy that is not taken into account in −Ne0. This strain energy is mainly due to the strong compression of the central part of the structure.40–42 To check this strain effect in the validity of the proposed approach in calculating the REE, we perform additional calculations on the Ih-Ru54 nanocluster, obtained by the removal of the central atom from the respective Ih-Ru55. Correspondingly, the Ru54 nanoclusters are now used to estimate the REE with the elimination of the contribution of the strain effect. As presented in Fig. 5(a), for both Ru54 and Ru55, by comparing with other representative low-lying FCCCF isomers, we can obtain a clear linear relationship between the relative energy and the total edge length, reassuring again the validity of the present comparative approach to calculate the REE. Specifically, for Ru54, the values of the REE per unit length is estimated to be around 48 meV Å−1 (Fig. 5(a)), which is slightly smaller than that of 50 meV Å−1 obtained for Ru55 without considering the strain effect. This is as expected, as the release of the volumetric strain in the structural reference (Ih-Ru54) increases the energy contribution from the bulk and hence reduces the REE of other structures.
The validity of the present approach in other TM systems
Here, we emphasize that the comparative method established here is also applicable to other TM nanoclusters. Taking other elements of Tc, Rh, and Pd nearby Ru in the periodic table as examples, we also calculated their average REE obtained by the present approach. As shown in Fig. 5(b), using the same method as introduced for Ru54 and Ru55, we can readily obtain the REE of Rh54 and Rh55, i.e., 18 and 15 meV Å−1, respectively. Similarly, we have also obtained the REE for Tc55 (9 meV Å−1) and Pd55 (5 meV Å−1) as summarized in Fig. 5(c). From this figure, it is noted that clusters consisting of elements in the middle of the periodic table (such as Ru) possess larger average edge energy, which is due to a relatively large number of effective d dangling bonds, compared with both the earlier and the later cases. Correspondingly, we predict that both the earliest and the latest TM elements in the periodic table possess the smallest edge energy, compared with the central ones, such as Ru. The main reason is that the edge atom has no unsaturated d bond – as there is only one d electron per atom for the earliest elements, e.g. in an Ih-Y55 cluster; and the d orbitals are far below the Fermi levels and fully occupied for the later elements, e.g. in an Ih-Ag55 cluster.21 Note again that the average edge energy per unit length obtained by this comparative approach is based on the lowest boundary approximation. Therefore, more accurately, the edge energy should be even higher than the lowest boundary values presented in Fig. 5. Correspondingly, we also state that although the previously established continuum approach32 is principally insufficient to determine the edge energy for TM nanostructures with strong directional bonds on the edges, the edge energy obtained by such an approach should be close to the values of the REEs obtained by the present approach with the lowest boundary approximation for both the earliest and the latest TM nanoclusters which possess a negligible number of d-type dangling bonds on the edges.Size effect on the REE
With the successful estimation of the REE of a given nanocluster motif, we now focus on the size effect on the established REE. As discussed above, the REE obtained by the comparative approach is based on the lowest boundary estimation on the balancing part of the surface energy. Particularly, with the increase of cluster size N, the ratio of the edge atoms relative to the total atom number N definitely decreases, more specifically, from 76% through 49% to 33% for Ru55 through Ru147 to Ru309 in the close-shelled Ih series, respectively. Note again that, the relative edge energies are based on comparing the energy difference between configurations within a given structural motif, such as an fcc-like one, therefore, the configuration difference in the core of these nanostructures can be neglected. According to this analysis, the relative edge energy balanced by the surface effect would decrease to zero (and then become negative) when the cluster size N increases up to a critical number because of the dramatically increased number of surface or facet atoms, though in reality the absolute value of the edge energy may gradually converge to a given constant when the cluster sizes increase continuously. Consequently, the critical size beyond which the structure stability transition occurs in FCCCF structures dominated by the GWCP and the Ih by the CWCP can be estimated: when the relative edge energy is close to zero.To examine this argument further, we perform substantial additional first-principles calculations on the energetics of larger clusters, namely Ru147 and Ru309 nanoclusters; for the detailed geometric structures, see ESI, S3.† Similarly, as shown in Fig. 6(a), by linear fitting of the data of ΔE/ΔL, we can estimate that the minimum value of the average relative edge energy per unit length is close to 27 meV Å−1, which is already reduced to about half of that calculated from Ru55, mainly due to the reduction of the ratio of the edge atoms relative to the surface or facet atoms. Here, we note again that the strain effect is also further checked for the Ru146 cluster series in Fig. 6(a) by using the same method as previously discussed for the case of Ru54.
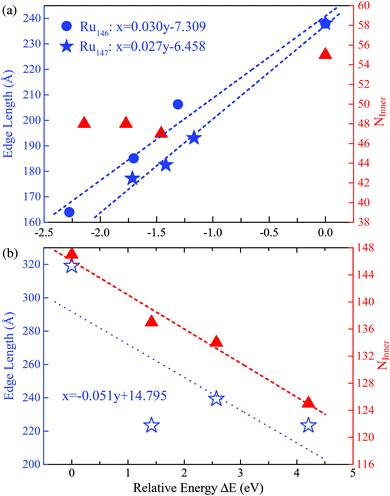 | ||
| Fig. 6 The least squares fitting of the relative energies as a function of the total edge length of (a) three FCCCF and the Ih cluster for both Ru146 and Ru147 cluster series; (b) three FCCCF configurations and the Ih-Ru309 clusters. For both Ru147 and Ru309, the numbers of inner atoms in clusters (NInner) represented by the triangles (in red) versus relative energy are also shown. The geometry configurations of Ru147 and Ru309 are shown in Fig. 3(II) and (III), respectively. | ||
Next, we further investigate the most stable geometric candidates for an even larger Ru309 cluster. In panel (III) of Fig. 3, the six lowest energy structures are presented, including two HCPCF, Ih, and three FCCCF configurations. Interestingly, the HCPCF motif now is much more stable than the FCCCF structures. In addition, for Ru309, the highly symmetric Mackey Ih (Fig. 3(III-c)) is more stable than the FCCCF configurations preferred by relatively smaller nanoclusters of Ru55 and Ru147 based on GWCP. Particularly, the most stable FCCCF eight-layered structure presented in Fig. 3(III-d) is 1.419 eV less stable, and the seven-layered configurations in (e) and (f) possess a much higher energy, by 2.571 and 4.208 eV, respectively. On the other hand, the HCPCF motif possesses much lower energy than the FCCCF one. For example, structure (a) and (b) are 6.320 and 3.922 eV lower in energy than the highly symmetric Ih configuration as shown in (c). Taking these FCCCF configurations again as a typical example, we demonstrate that the relative edge energy obtained by fitting the data of ΔE/ΔL in our comparative approach is now negative, −51 meV Å−1. The contrasting signs of the relative edge energies of Ru147 and Ru309 within the fcc-like motif indicate a structural change of the Ru nanoclusters between size 147 and 309, as directly supported by the calculated stability reversion between FCCCF and HCPCF.
Note that to make the above size effect on the REE convincingly statistically valid, we also considered another two sizes for RuN nanoclusters, i.e., N = 101 and 231. At these two sizes, highly symmetric Ih configurations cannot be formed, however, other low-energy perfect polyhedrons can be obtained, as detailed in the ESI, S4 and S5.† In these two cases, the obtained REEs are 37 meV Å−1 for Ru101 and −36 meV Å−1 for Ru231, respectively, which locate almost exactly in the fitted linear relationship obtained by RuN with N = 54, 55, 146, 147 and 309.
Relative edge energy in stability inversion between FCCCF and Ih stacking forms
Motivated by the above results and discussion, we can now quasi-quantitatively estimate the critical size (Nc) at which the crossover occurs between different stacking forms of the fcc-like RuN nanocluster motif. Namely, the Nc for FCCCF configurations and Ih can be obtained by identifying the zero point of the REE via extrapolating or interpolating the relative edge energies of some RuN nanoclusters with representative sizes, such as N = 54, 55, 101, 146, 147, 231, and 309. As shown in Fig. 7, the Nc for the change-over between the FCCCF configuration dominated by the GWCP and the Ih configuration based on CWCP is around Nc ≈ 190. Note that due to the approximation and somewhat random uncertainties in selecting the data of ΔE/ΔL, the accurate critical size Nc may also lie in a size window around 190. However, the highly consistent results between theoretical prediction and DFT calculations confirm convincingly that the introduction of the concept of REE can quantitatively or quasi-quantitatively identify the accurate size regime wherein the edge atom effect is critically important in determining the stacking sequence of the nanoclusters.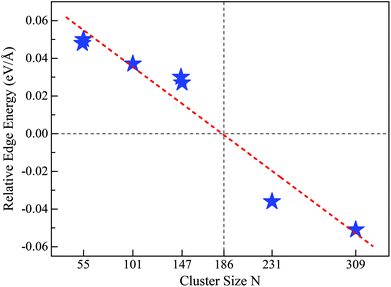 | ||
| Fig. 7 REE as a function of nanocluster size N. The REEs are obtained by the fitting method as shown in Fig. 5(a) for Ru54 and Ru55, Fig. 6 for Ru146, Ru147, and Ru309, Fig. S4† for Ru101 and Fig. S5† for Ru231, respectively. | ||
Here, we note again that the evolution of the sign of the relative edge energy in Fig. 7 is due to two factors: on the one hand, due to the gradually reduced edge atom effect because of the reduced ratio of the edge atom to the atoms on the facets and core; on the other hand, due to the structural changes in the cluster cores of different FCCCF configurations, as implied by the different number of inner atoms shown in Fig. 6(b); for more detailed discussion, see ESI, S6.†
Bulk effect vs. edge atom effect in different larger nanocluster motifs
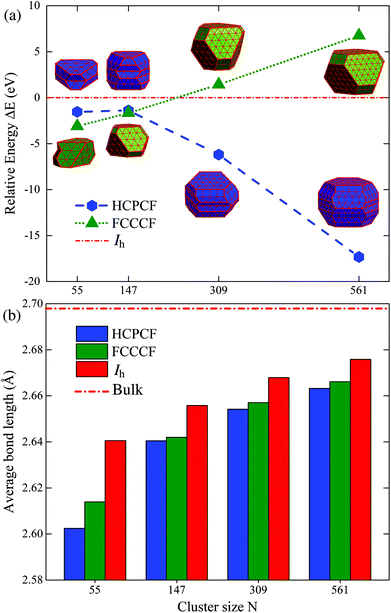
We examine the synergistic and competitive effect of the bulk, surface and edge atom effects in determining the most stable structural motif for a given nanocluster with a relatively large size. Definitely, to correctly predict the geometric configuration of a given nanocluster, particularly when its size is already large enough to form a nanocrystal, the bulk effect in eqn (4) will dominate the stability of different motifs, and qualitatively, the importance of the bulk, surface, and edge atom effects can be identified to be in the following order: bulk > surface > edge. More specifically, taking Ru once again as a typical example, we compare the relative stabilities of the fcc-like and hcp-like Ru nanocrystals. With a similar procedure, we obtained many low energy structures of hcp-like Ru nanoclusters with configurations like hcp crystal fragments (HCPCF). In Fig. 8(a), we compare the total energies of these nanoclusters (with size N = 55, 147, 309, and 561) between three stacking motifs, i.e., Ih, FCCCF and HCPCF. Significantly, the bulk effect in the core of Ru nanoclusters consisting of several hundred atoms already plays a critical role in determining their stability. More specifically, with the size increase, FCCCF structures become more and more unstable as compared to the close-packed Ih configuration, by contrast, the HCPCF motifs exhibit dramatically stable feature as compared to both Ih and FCCCF ones, due to the bulk effect of the hcp Ru crystal. Particularly, in these HCPCF nanocrystals, the nearest neighboring bond length between Ru atoms is smaller than those calculated in the FCCCF and Ih configurations, Fig. 8(b), reflecting an enhanced s–d hybridization and binding energy in HCPCF.21,43,44 Finally, we note again that overall the shorter the total edge length (the smaller the number of the edge atoms) of these HCPCF isomers, the lower the total energy, confirming the above analysis on the relative importance of the bulk and edge atom effects.21,45Conclusions
In summary, taking RuN nanoclusters as typical examples, the present first-principles investigations establish an effective method by the introduction of the concept of REE to identify the edge atom effect in determining the relative stability of different stacking motifs. In contrast to the absolute value of the edge energy, which is difficult to calculate in the present framework of DFT calculations, conceptually, we define the REE as the effect of edge atoms relative to the surface or facet atoms. Then, we can definitely assess the critical size for stability changes between FCCCF and Ih configurations by identifying the “zero point” of the REE of a given nanocluster. However, with the nanocluster sizes increasing to consist of several hundred atoms, the bulk effect in the cluster core must be invoked to rationalize the importance of the edge atom effect.Overall, we have provided further quantitatively/semi-quantitative analysis of relative edge atom effects on the structures and stabilities of nanoclusters of transition metals. Such analyses are of great significance for nanocatalyst design and for the discovery of effective nanostructures in chemical/photochemical catalysis, nanomagnetism, electronic/photonic clusters, quantum dots and related subject areas.
Acknowledgements
We thank Prof. Zhenyu Zhang and Prof. Y. F. Gao for helpful discussions. SFL is supported in part by the NSF of China (11074223 and 11034006), and ZXG by the UK EPSRC (no. EP/K021192/1).References
- J. M. McHale, A. Auroux, A. J. Perrotta and A. Navrotsky, Science, 1997, 277, 788–791 CrossRef CAS.
- J. Knall, J. B. Pethica, J. D. Todd and J. H. Wilson, Phys. Rev. Lett., 1991, 66, 1733–1736 CrossRef CAS PubMed.
- W. P. Halperin, Rev. Mod. Phys., 1986, 58, 533–606 CrossRef CAS.
- D. I. Gittins, D. Bethell, D. J. Schiffrin and R. J. Nichols, Nature, 2000, 408, 67–69 CrossRef CAS PubMed.
- A. A. Herzing, C. J. Kiely, A. F. Carley, P. Landon and G. J. Hutchings, Science, 2008, 321, 1331–1335 CrossRef CAS PubMed.
- H.-G. Boyen, G. Kastle, F. Weigl, B. Koslowski, C. Dietrich, P. Ziemann, J. P. Spatz, S. Riethmuler, C. Hartmann, M. Moller, G. Schmid, M. G. Garnier and P. Oelhafen, Science, 2002, 297, 1533–1536 CrossRef CAS PubMed.
- N. D. Lang and W. Kohn, Phys. Rev. B: Solid State, 1973, 7, 3541–3550 CrossRef CAS.
- N. D. Lang and W. Kohn, Phys. Rev. B: Solid State, 1970, 1, 4555–4568 CrossRef.
- N. Sakamoto, H. Ohtsuka, T. Ikeda, K. Maeda, D. Lu, M. Kanehara, K. Teramura, T. Teranishi and K. Domen, Nanoscale, 2009, 1, 106–109 RSC.
- X. Xie and W. Shen, Nanoscale, 2009, 1, 50–60 RSC.
- M. Cortie and E. Van der Lingen, Materials Forum, 2002, pp. 1–14 Search PubMed.
- R. Jin, Nanoscale, 2015, 7, 1549–1565 RSC.
- P. J. Feibelman, Science, 2002, 295, 99–102 CrossRef CAS PubMed.
- A. Michaelides, A. Alavi and D. A. King, J. Am. Chem. Soc., 2003, 125, 2746–2755 CrossRef CAS PubMed.
- G. A. Somorjai and Y. Li, Proc. Natl. Acad. Sci. U. S. A., 2011, 108, 917–924 CrossRef CAS PubMed.
- J. A. Rodriguez, S. Ma, P. Liu, J. Hrbek, J. Evans and M. Peez, Science, 2007, 318, 1757–1760 CrossRef CAS PubMed.
- J. P. Greeley, Science, 2012, 336, 810–811 CrossRef PubMed.
- H. Zhang, T. Watanabe, M. Okumura, M. Haruta and N. Toshima, Nat. Mater., 2012, 11, 49–52 CrossRef PubMed.
- H. G. Yang, C. H. Sun, S. Z. Qiao, J. Zou, G. Liu, S. C. Smith, H. M. Cheng and G. Q. Lu, Nature, 2008, 453, 638–641 CrossRef CAS PubMed.
- G. A. Somorjai and D. W. Blakely, Nature, 1975, 258, 580–583 CrossRef CAS.
- S. F. Li, X. J. Zhao, X. S. Xu, Y. F. Gao and Z. Zhang, Phys. Rev. Lett., 2013, 111, 115501 CrossRef CAS PubMed.
- X. J. Zhao, X. L. Xue, Z. X. Guo, Y. Jia, S. F. Li, Z. Zhang and Y. F. Gao, J. Chem. Phys., 2015, 143, 174302 CrossRef CAS PubMed.
- T. Rapps, R. Ahlrichs, E. Waldt, M. M. Kappes and D. Schooss, Angew. Chem., Int. Ed., 2013, 52, 6102–6105 CrossRef CAS PubMed.
- S. Dahl, A. Logadottir, R. C. Egeberg, J. H. Larsen, I. Chorkendorff, E. Tornqvist and J. K. Noskov, Phys. Rev. Lett., 1999, 83, 1814–1817 CrossRef.
- M. T. M. Koper, Nanoscale, 2011, 3, 2054–2073 RSC.
- W. D. Williams, M. Shekhar, W.-S. Lee, V. Kispersky, W. N. Delgass, F. H. Ribeiro, S. M. Kim, E. A. Stach, J. T. Miller and L. F. Allard, J. Am. Chem. Soc., 2010, 132, 14018–14020 CrossRef CAS PubMed.
- T. F. Jaramillo, K. P. Jorgensen, J. Bonde, J. H. Nielsen, S. Horch and I. Chorkendorff, Science, 2007, 317, 100–102 CrossRef CAS PubMed.
- L. Vitos, A. V. Ruban, H. L. Skriver and J. Kollar, Surf. Sci., 1998, 411, 186–202 CrossRef CAS.
- M. Alden, H. L. Skriver, S. Mirbt and B. Johansson, Phys. Rev. Lett., 1992, 69, 2296–2298 CrossRef CAS PubMed.
- M. Methfessel, D. Hennig and M. Scheffler, Phys. Rev. B: Condens. Matter, 1992, 46, 4816–4829 CrossRef CAS.
- H. L. Skriver and N. M. Rosengaard, Phys. Rev. B: Condens. Matter, 1991, 43, 9538–9549 CrossRef.
- J. C. Hamilton, Phys. Rev. B: Condens. Matter, 2006, 73, 125447 CrossRef.
- P. Hohenberg and W. Kohn, Phys. Rev., 1964, 136, B864–B871 CrossRef.
- J. P. Perdew, J. A. Chevary, S. H. Vosko, K. A. Jackson, M. R. Pederson, D. J. Singh and C. Fiolhais, Phys. Rev. B: Condens. Matter, 1992, 46, 6671–6687 CrossRef CAS.
- G. Kresse and J. Hafner, Phys. Rev. B: Condens. Matter, 1994, 49, 14251–14269 CrossRef CAS.
- P. E. Blochl, Phys. Rev. B: Condens. Matter, 1994, 50, 17953–17979 CrossRef.
- Y. Wang, J. Lv, L. Zhu and Y. Ma, Phys. Rev. B: Condens. Matter, 2010, 82, 094116 CrossRef.
- Y. Wang, J. Lv, L. Zhu and Y. Ma, Comput. Phys. Commun., 2012, 183, 2063 CrossRef CAS.
- S. Plimpton, J. Comput. Phys., 1995, 117, 1–19 CrossRef CAS.
- K. Laasonen, E. Panizon, D. Bochicchio and R. Ferrando, J. Phys. Chem. C, 2013, 117, 26405–26413 CAS.
- E. Panizon, D. Bochicchio, G. Rossi and R. Ferrando, Chem. Mater., 2014, 26, 3354–3356 CrossRef CAS.
- F. Baletto, C. Mottet and R. Ferrando, Phys. Rev. B: Condens. Matter, 2001, 63, 155408 CrossRef.
- C. M. Chang and M. Y. Chou, Phys. Rev. Lett., 2004, 93, 133401 CrossRef CAS PubMed.
- S. F. Li, H. Li, X. Xue, Y. Jia, Z. X. Guo, Z. Zhang and X. G. Gong, Phys. Rev. B: Condens. Matter, 2010, 82, 035443 CrossRef.
- L. D. Marks and L. Peng, J. Phys.: Condens. Matter, 2016, 28, 053001 CrossRef CAS PubMed.
Footnote |
| † Electronic supplementary information (ESI) available: Detailed geometric structures of Ru54, Ru55, Ru101, Ru147 and Ru231 cluster series; REEs of Ru101 and Ru231 cluster series; evolution of the sign of the REE when cluster size increases. See DOI: 10.1039/C6NR00486E |
| This journal is © The Royal Society of Chemistry 2016 |

