DOI:
10.1039/C5NR06509G
(Paper)
Nanoscale, 2016,
8, 365-377
Morphology evolution of single-crystalline hematite nanocrystals: magnetically recoverable nanocatalysts for enhanced facet-driven photoredox activity†
Received
21st September 2015
, Accepted 16th November 2015
First published on 16th November 2015
Abstract
We have developed a new green chemical approach for the shape-controlled synthesis of single-crystalline hematite nanocrystals in aqueous medium. FESEM, HRTEM and SAED techniques were used to determine the morphology and crystallographic orientations of each nanocrystal and its exposed facets. PXRD and HRTEM techniques revealed that the nanocrystals are single crystalline in nature; twins and stacking faults were not detected in these nanocrystals. The structural, vibrational, and electronic spectra of these nanocrystals were highly dependent on their shape. Different shaped hematite nanocrystals with distinct crystallographic planes have been synthesized under similar reaction conditions, which can be desired as a model for the purpose of properties comparison with the nanocrystals prepared under different reaction conditions. Here we investigated the photocatalytic performance of these different shaped-nanocrystals for methyl orange degradation in the presence of white light (λ > 420 nm). In this study, we found that the density of surface Fe3+ ions in particular facets was the key factor for the photocatalytic activity and was higher on the bitruncated-dodecahedron shape nanocrystals by coexposed {104}, {100} and {001} facets, attributing to higher catalytic activity. The catalytic activity of different exposed facet nanocrystals were as follows: {104} + {100} + {001} (bitruncated-dodecahedron) > {101} + {001} (bitruncated-octahedron) > {001} + {110} (nanorods) > {012} (nanocuboid) which provided the direct evidence of exposed facet-driven photocatalytic activity. The nanocrystals were easily recoverable using an external magnet and reused at least six times without significant loss of its catalytic activity.
Introduction
Crystal growth engineering has attracted the attention of many researchers conducting studies on solid-state materials chemistry. Crystalline nanocrystals, having a particular shape and exposed facets, possess excellent physical and chemical properties; this is attributed to the different electronic and atomic arrangements in the exposed facets.1–4 The shape of nanocrystals depends on the crystallographic structure of a particle surface, which also governs its distinct properties, such as reactivity, selectivity, adsorption capacity, electrical conductivity, and optical properties.5–7 Several researchers have made intensive efforts to design and control the morphological architecture of nanocrystals, because they exhibit a unique size- and shape-dependent phenomena. However, using a chemical method, it is quite difficult to adjust the particular shape of nanocrystals.8,9 In most advanced studies of crystal growth engineering, researchers have tried to vary the surface crystallographic orientation of Ag, Au, Pd, and Pt-based noble-metal nanostructures.10–17 On the other hand, it is even more difficult and challenging to carry out surface engineering of metal–oxides.18 Among different metal oxides, hematite (α-Fe2O3) is thermodynamically very stable under ambient conditions. Hematite has received extensive attention of researchers as it can be used in diverse applications, including catalysis,19,20 magnetic devices,21,22 environmental protection,23 gas sensors,24 drug delivery,25 pigments and paints, Li ion batteries,26,27 water splitting28,29etc. It has low band gap energy (Eg = 2.2 eV). Moreover, it is a cheap metal oxide that is non-toxic and environmentally friendly. Furthermore, it also has relatively good stability and is magnetically recoverable. Owing to these attractive features, hematite is widely used in diverse applications.30–32 In the past few decades, researchers have developed many synthetic strategies, such as the hydrothermal process, sol–gel process, and thermal decomposition method that could be used to prepare 1D, 2D and 3D hematite materials.30,33–36 Recent studies have reported that hematite particles, having the shape of a polyhedron, possess outstanding properties as they have different high-index exposed facets. In 2010, Sun and co-workers36 synthesized a dodecahedral shaped nanocrystal which was enclosed by twelve (101) crystal planes, and an octadecahedral shaped nanocrystal enclosed by twelve (101) and six (111) planes. Compared to the hematite particles reported in previous studies, these dodecahedral and octadecahedral particles had a much stronger magnetic character.
They also possessed different magnetic properties. Yin et al.33 have also reported about the peculiar magnetic properties of tetrakaidecahedral and oblique parallelepiped hematite nanocrystals with exposed high index facets. Liu et al.37 reported quasi-cubic hematite nanocrystals enclosed by (012), (10−2) and (1−12) facets and hexagonal bipyramidal hematite nanocrystals enclosed by (012) facets showing shape- and surface-dependent magnetic properties. In 2012, Zhou et al.38 carried out visible-light-induced RhB degradation on hematite particles: the process was strongly dependent on the architecture of nanocrystals, while the order of reactivity of the exposed facets followed the sequence: {001}{110} faceted nanorod > {012} faceted nanocube > {001} faceted nanoplate. Zhao et al.39 have reported that rhombohedral hematite crystals have {0001} and {10−10} exposed facets, but truncated dodecahedron-crystals are predominantly characterized by {10−12} exposed facets. The photocatalytic performance of the truncated dodecahedron crystals was superior to that of the rhombohedral crystals. This discrepancy in the photocatalytic behaviour of crystals is because of the surface density of Fe ions on particular facets. Recently, Ouyang et al.40 have synthesized the following kinds of nanocrystals: hexagonal bipyramids with {113} facets, pseudocubes with {012} facets, and nanoplates with {001} facets. In these nanocrystals, the ease of catalytic oxidation with CO followed the following sequence of facets: {012} > {113} > {001}. The bipyramidal hematite-{113} nanocrystals exhibited the best performance in acetone sensing, followed by pseudocubic hematite-{012} and plate hematite-{001}/{012}. The same facet-dependent sensing order {113} > {012} > {001} was found while analysing the three samples with methanol sensing. So there has been increasing interest recently in the preparation of polyhedral hematite single crystals with exposed different facets to find their exceptional properties. Recently Lin et al.41 have synthesized hexagonal bipyramidal hematite nanocrystals by adding F− anions and they reported that there are two surfaces that are most stable facets in the hematite crystals: {113} facets that are easily adsorbed with F− ions, and the {104} facets that are stabilized by OH−. It is still a challenge to synthesize different shaped single crystalline hematite using an environmentally friendly process under similar reaction conditions. In this context, we have synthesized different shaped hematite nanocrystals, with low energy exposed facets {001} and high energy exposed facets {101} in the same chemical synthesis method. It is noted that the morphology of crystals and exposed facets is governed by temperature. We have synthesized nanocrystals of different morphologies by simply tuning the reaction temperature. This is because the growth of nanocrystals is related to the surface energy of the growth plane. We successfully synthesized nanocrystals with the different shape and exposed facets: {001}, {110}, {012}, {100}, {104} and {101}. The nanocrystals exhibit high photocatalytic activity when subjected to dye degradation in the presence of white light. A significant portion of dyes gets wasted during the dying processes, and the effluents are released into water streams. Dye molecules are hazardous as they cause various health problems and serious environmental problems all over the world. So, researchers are of the view that dye molecules must be mineralized in aqueous solutions using sunlight with the photocatalyst.
Experimental section
Materials
All the chemicals used in this study were of ACS grade, so they were not subjected to further purification. Sodium salicylate (SS, Sigma Aldrich 99%), ferric nitrate nonahydrate (Fe(NO3)3·9H2O, Sigma Aldrich 98%), and sodium hydroxide (NaOH, Sigma Aldrich 97%) were purchased from Sigma Aldrich. In this study, we carried out all the chemical reactions in deionised water.
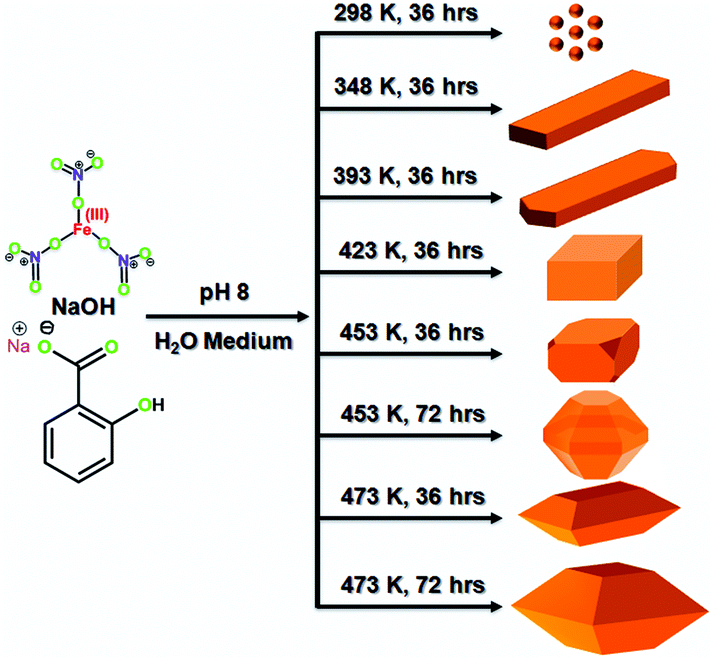
Synthesis procedure of nanocrystals with different morphologies
We synthesized nanocrystals of different shapes using the hydrothermal synthesis method. This experimental method of synthesis was carried out at different temperatures, and the duration of the process was varied accordingly. However, the remaining factors were constant while synthesizing different nanocrystals. In this synthesis process, 10 mmol of sodium salicylate and 12.5 mmol of NaOH were mixed with 20 mL of water. Then, 10 mmol of Fe(NO3)3·9H2O was dissolved in 5.0 g of water, and this solution was slowly added to the reaction solution. We added 2 M NaOH solution slowly to the reaction solution until its pH was adjusted to 8. The resultant mixture was stirred for 3 h. Then, this reaction mixture was transferred into a Teflon-lined stainless steel autoclave and hydrothermally treated at requisite temperature for a fixed duration of time. Scheme 1 and Table S1† provide a detailed summary of the synthesized material, hydrothermal temperature, and time required for the completion of synthesis. The resulting dark red coloured solid was separated by centrifugation. Then, this solid was washed several times with water and ethanol. This synthesized material was dried at room temperature under vacuum. Furthermore, the material was extracted with an acid–ethanol solution to remove the salicylate moiety from the material. The FTIR analysis (Fig. S1†) confirmed that salicylates were removed from the materials. This material was used in photocatalysis.
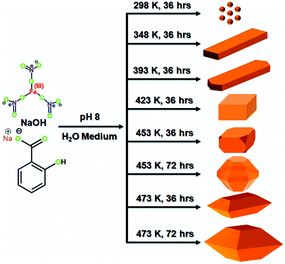 |
| | Scheme 1 Synthetic route of shaped-nanocrystals via the hydrothermal synthesis method. | |
Photocatalytic test
The photocatalytic activity of hematite nanocrystals was determined by performing the degradation of methyl orange dye in the presence of white light (λ > 420 nm). 1000 ml of 0.02 mM solution was prepared. Prior to measurement, 50 mL of 0.02 mM solution was mixed with 10 mg of hematite nanocrystals in a round bottom flask of 100 ml capacity. Before photo-irradiation, the catalyst was added to the reactant solution and then it was stirred vigorously for 30 min in the dark. Thus, we established the adsorption–desorption equilibrium. Then, 0.5 mL of H2O2 (30 wt%) solution was added as an additive to the reactant solution. The reactant solution was irradiated with white light using a solar simulator of a 150 W power xenon lamp (Newport Corporation) with 420 nm cut off filter and stirred magnetically to maintain the homogeneity of the suspension. However, at regular intervals of time (20 min), 1 mL of the reactant solution was withdrawn and centrifuged to remove the catalyst from the suspension. After the completion of the reaction, the magnetic catalyst was recovered by using an external magnet and the solution was decanted. The nanocatalyst was washed thoroughly with water and ethanol. The dye concentration in the solution phase was calculated from the absorbance values, which were measured using a UV 2401PC UV-visible spectrophotometer. The intermediate products of methyl orange degradation were identified by using a liquid chromatograph-mass spectrometer (Agilent Model 1100 LCMS ion trap with C18 Column and negative ion mode, ESI). 10 μL of the aliquot was injected for analysis and acetonitrile–water mixture (30![[thin space (1/6-em)]](https://www.rsc.org/images/entities/char_2009.gif) :70) was used as an eluent with the column temperature at 298 K and 1 mL min−1 flow rate.
:70) was used as an eluent with the column temperature at 298 K and 1 mL min−1 flow rate.
Recyclability of the photocatalyst
We examined whether hematite could be reused as a nanocatalyst in the reaction involving the degradation of methyl orange dye by white light. After the completion of the reaction, the magnetic catalyst was recovered by an external magnet and the solution was decanted. The nanocatalyst was washed thoroughly with water and ethanol. For activating this catalyst for the next reaction, it was dried at 348 K for 4 h under vacuum. Thus, this nanocatalyst was recycled and used in subsequent experiments. The recycling reactions were performed six times under identical conditions.
Characterization
The size, shape, morphology, band gap, and structural features of goethite and hematite nanocrystals are investigated using different characterization techniques. Powder X-ray diffraction patterns of the samples were recorded on a Bruker D-8 Advance diffractometer; this instrument was operated at a voltage of 40 kV and a current of 40 mA using Cu Kα (λ = 0.15406 nm) radiation. Raman spectra were recorded using a Bruker Senterra Raman microscope. In this process, the samples were excited at room temperature by subjecting them to a laser beam of 532 nm; the samples were exposed to this excitation laser beam for 30 s at 1 mW power. TEM images and HRTEM and SAED patterns were recorded with a JEOL JEM-2100F TEM that was operated at 200 kV. A JEOL JEM-7600F field-emission scanning electron microscope (FE SEM) was used for conducting morphology analysis. Nitrogen sorption isotherms were obtained at 77 K using an ASAP 2000 surface area analyzer (Micromeritics Instrument Corporation, Georgia, USA). Prior to the measurement, the samples were degassed at 423 K for 3 h. UV-visible diffuse reflectance spectra were recorded on a UV 2401PC UV-visible spectrophotometer (Shimadzu Corporation, Kyoto, Japan) using an integrated sphere attachment. BaSO4 was used as the background standard in the spectrophotometric analysis. The photocatalysis was conducted by illuminating with white light produced from a solar simulator of a 150 W power xenon lamp (one Sun) (Newport Corp., USA; Model 69907). The intermediates of methyl orange degradation were monitored by liquid chromatograph-mass spectrometer (Agilent Model 1100).
Results and discussion
Structural and vibrational information from PXRD and Raman analysis
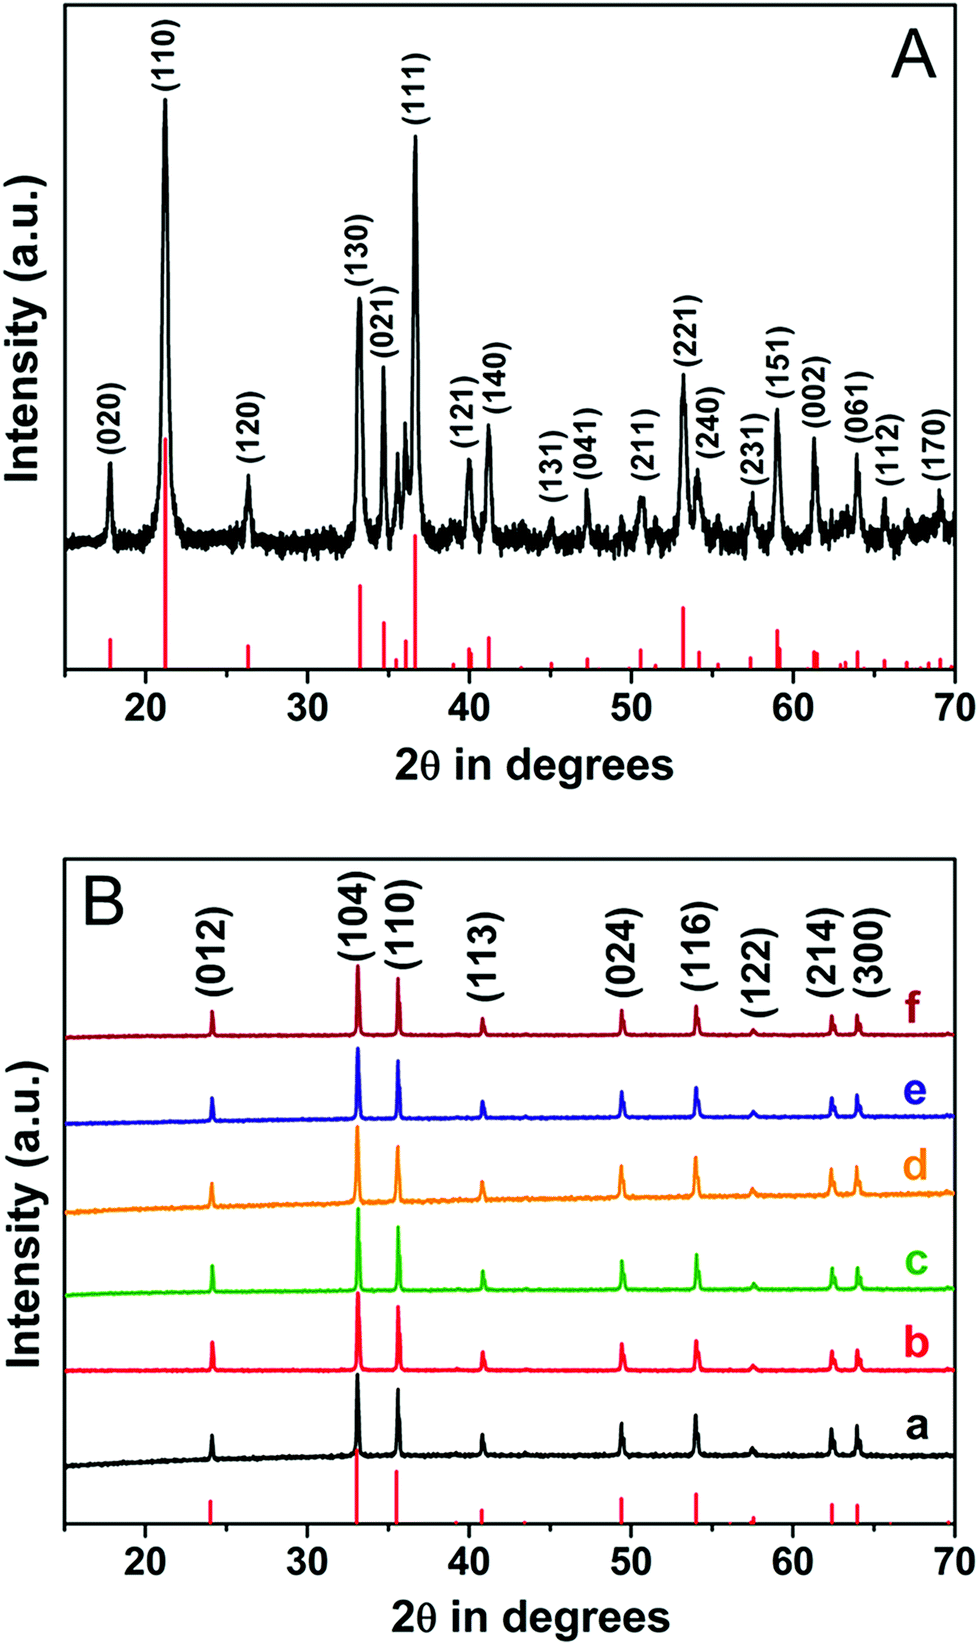
Powder X-ray diffraction (PXRD) analysis was used to determine the structural features, crystallinity, and purity of nanocrystals synthesized in this study. The nanocrystals were synthesized by the hydrothermal synthesis method. This method was performed at different temperatures using iron nitrate nonahydrate as the precursor. Sodium salicylate was used as the capping agent, while sodium hydroxide was used as the bridging ligand and deionised water was used as the solvent. The reaction procedure had to be carried out for different durations to synthesize different nanocrystals. The reaction details are shown in Scheme 1 and Table S1.† Fig. S2† shows the PXRD analysis that the nanocrystals (S25-NP) were synthesized at 298 K by performing the reaction for 36 h. S25-NP nanocrystals were semi-crystalline in nature. S75-NR nanocrystals were synthesized at 348 K by carrying out the reaction for 36 h. S75-NR nanocrystals are highly crystalline in nature (Fig. 1A).
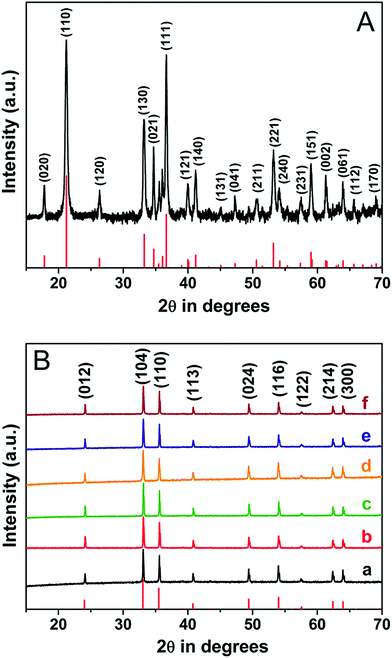 |
| | Fig. 1 (A) Wide-angle XRD pattern of the goethite nanorods (S75-NR). All the peaks are indexed to the goethite phase (α-FeOOH). (B) Wide-angle XRD pattern of the highly crystalline hematite nanocrystals. (a) Nanorods (b) nanocuboids, (c) irregular shape nanocrystals, (d) bitruncated-dodecahedron, (e) bitruncated-elongated octahedron and (f) bitruncated-octahedron nanocrystals. All the peaks are indexed to the hematite phase (α-Fe2O3). | |
This indicates that crystal growth was favoured at high temperature, and highly crystalline nanocrystals were obtained at higher temperatures. The 2θ diffraction positions of these nanocrystals (S25-NP and S75-NR) correspond to the goethite (α-FeOOH) phase (JCPDS PDF number 01-081-0463)42,43 in both the samples. All the peaks matched with a pure orthorhombic crystal system having a Pbnm space group and lattice parameters: a = 0.461, b = 0.995 and c = 0.302 nm. When the hydrothermal temperature was increased beyond 423 K, we obtained highly crystalline nanocrystals (Fig. 1B), and the 2θ diffraction positions matched with the hematite (α-Fe2O3) phase (JCPDS PDF number 01-084-0308).33,44 All the peaks correspond to a rhombohedral crystal system, having an R![[3 with combining macron]](https://www.rsc.org/images/entities/char_0033_0304.gif) c space group and lattice parameters: a = 0.501 and c = 1.367 nm. These PXRD analyses indicate that iron hydroxide nanocrystals are produced at low temperature. At higher temperatures, the iron hydroxides get transformed into iron oxides. No peaks of impurity were observed in this experimental study, because we obtained single crystalline materials of high purity. In hematite nanocrystals, the relative peak intensity of different growth planes increased with an increase in the temperature and reaction duration of hematite syntheses. The details of the relative peak intensity are given in Table S2.† From the analysis, we found that the relative peak intensity of the (110) planes is higher for hematite nanocrystals which have the shape of nanorods. The relative peak intensity of the (110) planes increases as the I(012)/I(110) and I(104)/I(110) ratio decreases. In nanocrystals of nanocuboid shape, the relative peak intensity of (012) planes increases with an increase in the I(012)/I(104) ratio. In the bitruncated dodecahedron nanocrystals, the relative peak intensity of (104) planes was found to increase with an increase in the I(104)/I(110) ratio and a decrease in the I(012)/I(104) ratio. The relative peak intensity of (012) and (110) planes was found to increase in the bitruncated-elongated octahedron and bitruncated octahedron nanocrystals.
c space group and lattice parameters: a = 0.501 and c = 1.367 nm. These PXRD analyses indicate that iron hydroxide nanocrystals are produced at low temperature. At higher temperatures, the iron hydroxides get transformed into iron oxides. No peaks of impurity were observed in this experimental study, because we obtained single crystalline materials of high purity. In hematite nanocrystals, the relative peak intensity of different growth planes increased with an increase in the temperature and reaction duration of hematite syntheses. The details of the relative peak intensity are given in Table S2.† From the analysis, we found that the relative peak intensity of the (110) planes is higher for hematite nanocrystals which have the shape of nanorods. The relative peak intensity of the (110) planes increases as the I(012)/I(110) and I(104)/I(110) ratio decreases. In nanocrystals of nanocuboid shape, the relative peak intensity of (012) planes increases with an increase in the I(012)/I(104) ratio. In the bitruncated dodecahedron nanocrystals, the relative peak intensity of (104) planes was found to increase with an increase in the I(104)/I(110) ratio and a decrease in the I(012)/I(104) ratio. The relative peak intensity of (012) and (110) planes was found to increase in the bitruncated-elongated octahedron and bitruncated octahedron nanocrystals.
Furthermore, Raman spectroscopy measurements were carried out to determine how the chemical environment of different morphologies changed in the presence of light. It is a well-known fact that different facets of nanocrystals have different chemical environments, which immensely influence the properties of nanocrystals.45Fig. 2 displays the Raman spectra of different hematite nanocrystals having different shapes. The frequencies of Raman bands observed at 222.3, 244.0, 288.9, 405.5, 497.0, and 662.0 cm−1 were assigned to A1g(1), Eg(1), Eg(2), Eg(3), A1g(2), and Eg(4) vibration modes, respectively.46 One broad peak that appeared at 1310 cm−1 was attributed to a two-magnon scattering mode.47,48 In particular, all the observed Raman peaks were attributed to hematite. No other peaks were detected in the Raman spectra, indicating that this simple method could only synthesize hematite. Moreover, the synthesized hematite did not contain impurities, such as iron hydroxides, iron oxides and/or oxyhydroxides. Interestingly, the relative intensity between Eg and A1g peaks was found to be different for different shapes of nanocrystals (see Table S3†). The Eg and A1g ratio was highest for the nanorod, but lowest for nanocuboids. Thus, the Raman spectroscopy measurements confirm the XRD results, indicating that the nanocrystals were of pure hematite. The corresponding changes in relative intensity peaks were attributed to the different morphologies of these nanocrystals.
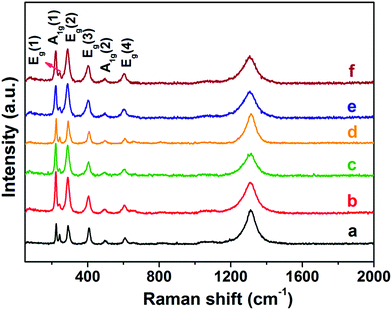 |
| | Fig. 2 Raman spectra of different-shaped hematite nanocrystals. (a) Nanorods, (b) nanocuboids, (c) irregular shape nanocrystals, (d) bitruncated-dodecahedron, (e) bitruncated-elongated octahedron, (f) bitruncated-octahedron nanocrystals. | |
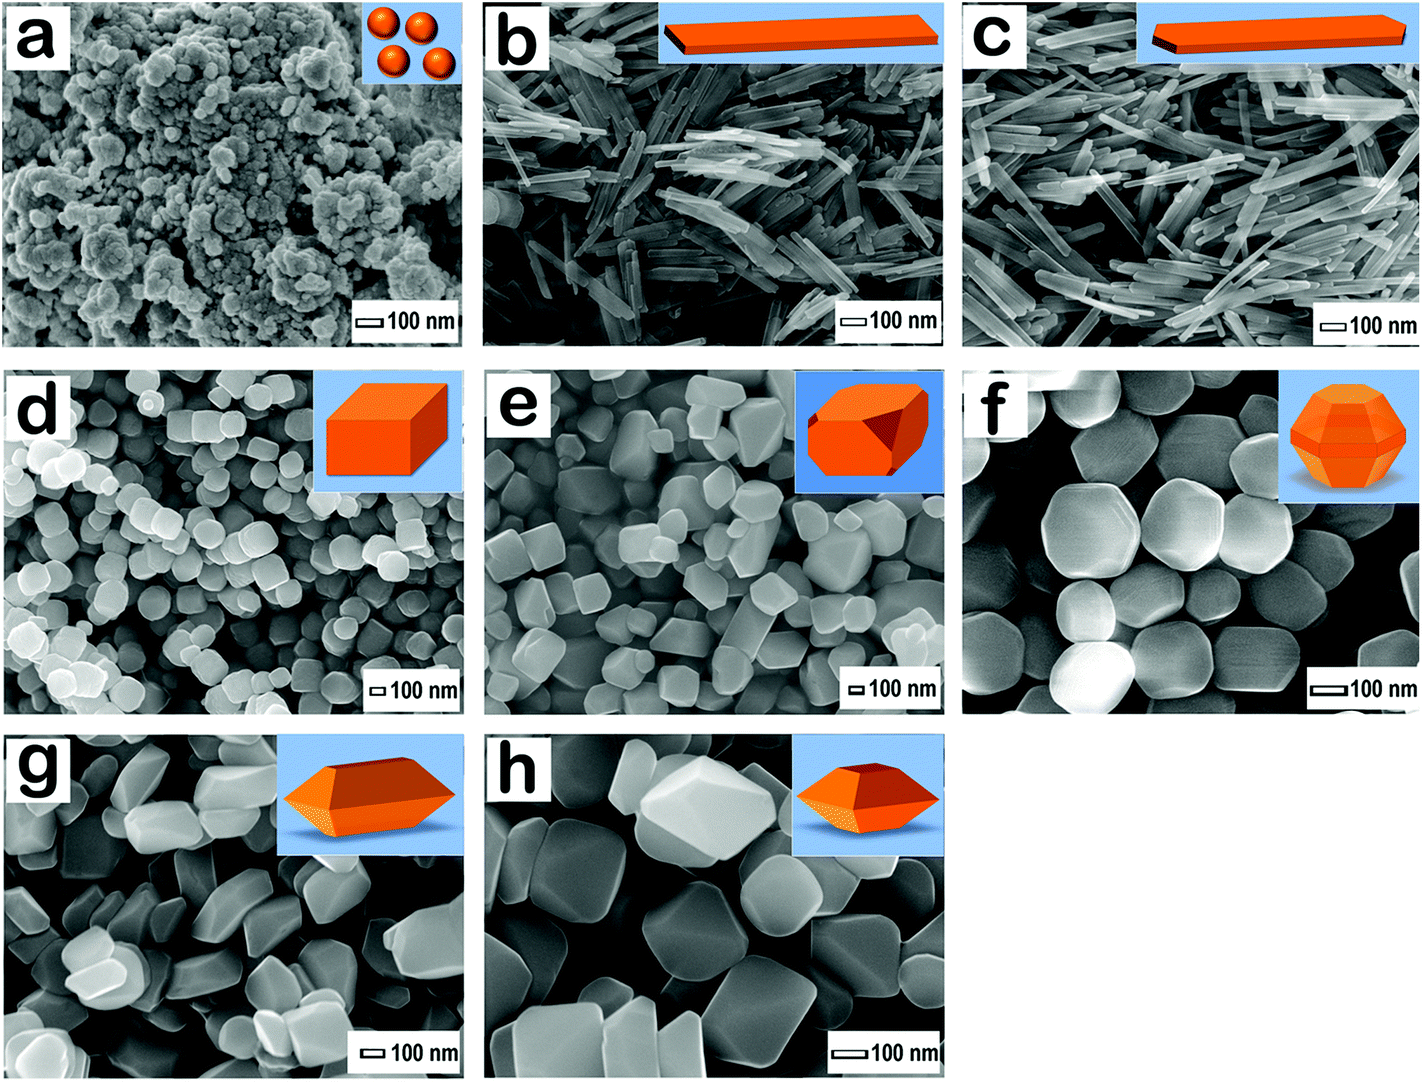
Surface morphology analysis by FE SEM
Fig. 3 displays the high resolution field-emission scanning electron microscope (FE-SEM) images, and the schematic drawings of the corresponding goethite and hematite nanocrystals. We found that the surface morphology and the size of goethite and hematite nanocrystals were uniform throughout the product for a particular reaction. Furthermore, the size of nanocrystals increased and the shape also changed when we increased the hydrothermal temperature and the duration of these syntheses reactions. We found that variation in synthesis temperature brought about morphological changes in the nanocrystals. The nanocrystals synthesized by this method had sharp edges. Moreover, we could clearly see the faces of all the nanocrystals. Fig. 3a displays the small-sized goethite nanoparticles, which were obtained at room temperature by carrying out the hydrolysis of iron nitrate. Furthermore, by increasing the synthesis temperature, we obtained goethite nanorods with 6 faces, 8 vertices, and 12 edges (Fig. 3b). The average length, width, and height of these nanorods are ca. 150, 25, and 12 nm, respectively. By performing hydrothermal synthesis at 393 K, we obtained hematite nanorods with 8 faces, 12 vertices, and 18 edges (Fig. 3c). By performing hydrothermal synthesis at 423 K, we obtained nanocuboids with 6 faces, 8 vertices, and 12 edges (Fig. 3d). Fig. 3e shows an FE-SEM image of hematite nanocrystals having an irregular shape. The size of these nanocrystals was in the range 200–300 nm diagonally; these irregular shaped nanocrystals were obtained at 453 K by performing the hydrothermal reaction for 36 h. But, when we carried out the hydrothermal synthesis for 72 h at the same reaction temperature, nanocrystals of bitruncated dodecahedron (Fig. 3f) shape were obtained; they had 20 faces, 24 vertices, and 42 edges. Fig. 3g and h illustrate that nanocrystals, having the shape of a bitruncated-elongated octahedron and a bitruncated-octahedron, had 10 faces, 12 vertices, and 20 edges; these types of nanocrystals were obtained by carrying out the hydrothermal reaction at 473 K temperature; the size difference was attributed to increasing the duration of the hydrothermal reaction from 36 h to 72 h. In this study, all the three-dimensional nanocrystals comply with Euler's formula,49 which links the numbers the vertices (V), faces (F), and edges (E) of a polyhedron as V + F − E = 2. Therefore, the synthesized nanocrystals with a definite shape are geometrically stable. Table 2 summarizes the length, width, height, and number of faces, vertices, edges, and % of dominant facets of hematite nanocrystals.
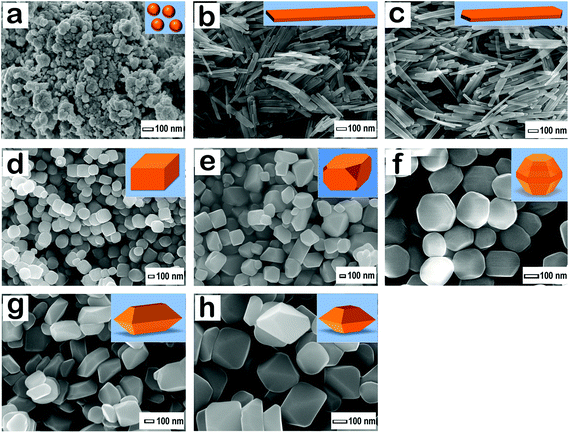 |
| | Fig. 3 High resolution FE-SEM images of goethite and hematite nanocrystals. (a) Goethite nanoparticles, (b) goethite nanorods, (c) hematite nanorods, (d) hematite nanocuboids, (e) hematite irregular-shaped nanocrystals, (f) hematite bitruncated-dodecahedron, (g) hematite bitruncated-elongated octahedron, (h) hematite bitruncated-octahedron. | |
Table 1 Physical and chemical properties of hematite (α-Fe2O3) nanocrystals obtained under different condition of syntheses. % of dominant exposed facets are also reported
| Sample |
Morphology |
Length (nm) |
Width (nm) |
Height (nm) |
No of face (F), vertex (V) and edge (E) |
% of Dominant facets |
| S120-NR |
Nanorod |
430 ± 50 |
33 ± 2.4 |
16 ± 1.3 |
F-8, V-12, E-18 |
74.2%{001} + 25.8%{110} |
| S150-NC |
Nanocuboid |
240 ± 35 |
205 ± 35 |
95 ± 10 |
F-6, V-8, E-12 |
100%{012} |
| S180-BTD |
Bitruncated-dodecahedron |
325 ± 50 |
240 ± 25 |
220 ± 10 |
F-20, V-24, E-42 |
27%{001} + 50.4%{104} + 22.6%{100} |
| S200-BTEO |
Bitruncated-elongated octahedron |
300 ± 50 |
150 ± 35 |
150 ± 30 |
F-10, V-12, E-20 |
3.5%{001} + 96.5%{101} |
| S200-BTO |
Bitruncated-octahedron |
340 ± 50 |
250 ± 20 |
160 ± 10 |
F-10, V-12, E-20 |
5.2%{001} + 94.8%{101} |
Table 2 Band gap energy and BET surface area of various hematite nanocrystals acting as photocatalysts in the degradation of MO; the photo-degradation rate and photocatalyst activity and apparent quantum efficiency (AQE)
| Catalyst |
Band gap (eV) |
BET surface area (m2 g−1) |
Rate (μmol h−1) |
Activity (μmol h−1 g−1) |
AQE (×106) |
| Nanorod |
2.05 |
9.0 |
4.700 |
470.00 |
1.984 |
| Nanocuboid |
1.99 |
7.5 |
3.390 |
339.00 |
1.431 |
| Bitruncated-dodecahedron |
2.08 |
6.5 |
6.336 |
633.66 |
2.675 |
| Bitruncated-elongated octahedron |
2.01 |
7.0 |
5.943 |
594.33 |
2.509 |
| Bitruncated-octahedron |
2.06 |
15.1 |
6.098 |
609.84 |
2.574 |
Nanostructure and exposed facet analysis by HR TEM
High resolution transmission electron microcopy (HR TEM) was used to investigate the shape, size, crystal growth direction, and different surfaces of exposed facets of the nanocrystals. Fig. S3† shows the TEM image of goethite nanoparticles synthesized at room temperature. We found that through the specimen, the particles had a uniform size of 4–5 nm. The different morphologies of nanocrystals, which were obtained by the hydrothermal synthesis method, were examined using high-resolution transmission electron microscopy (HRTEM) and selected area electron diffraction (SAED) techniques.
Goethite nanorod
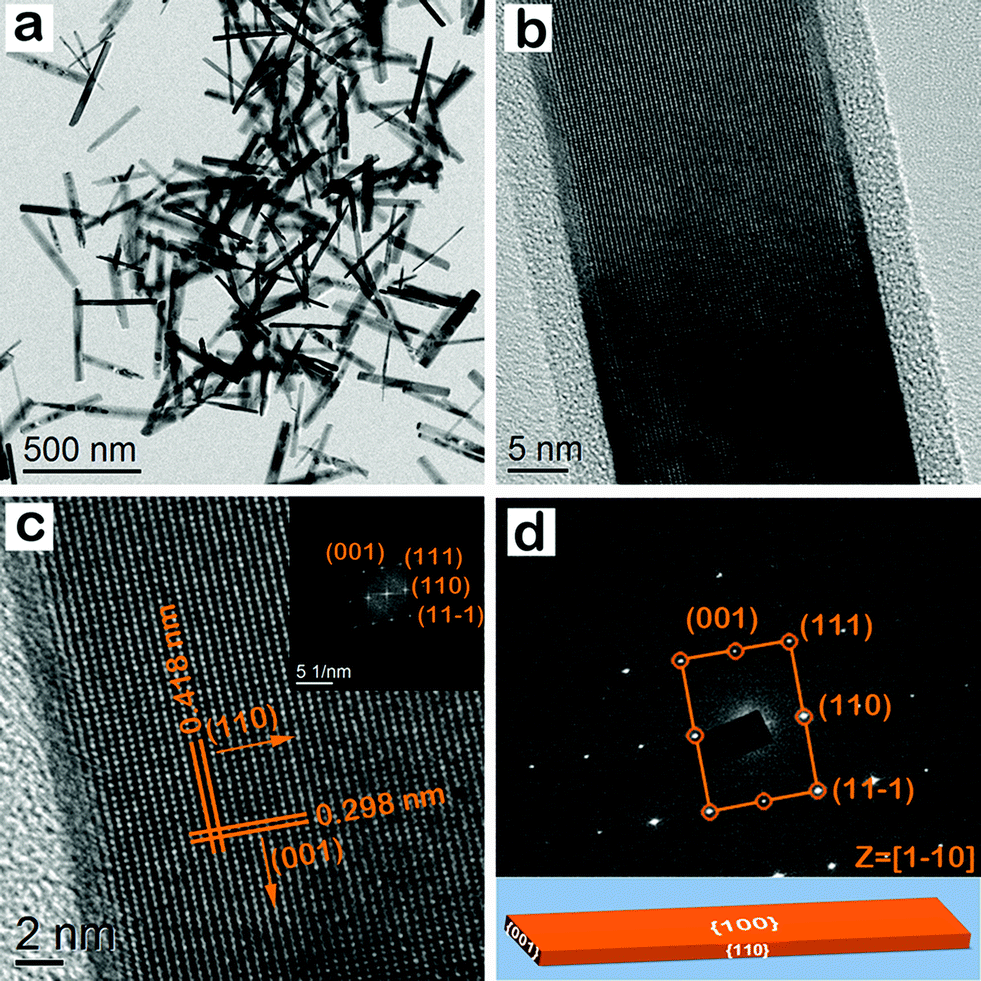
Fig. 4a shows the TEM image of goethite nanocrystals synthesized at 348 K for 36 h. These nanocrystals have the shape of a nanorod. Nanorods of uniform size are seen throughout the specimen. Furthermore, different crystalline planes of individual nanorods are also clearly seen in Fig. 4b. A closer view of the image in Fig. 4b is obtained from the left hand side, and different classes of lattice fringes are resolved in Fig. 4c. The lattice spacing in the nanorod is 0.418 and 0.298 nm, corresponding to the (110) and (001) lattice planes of the goethite crystal phase, respectively. The interfacial angle between (110) and (001) lattice planes is 90°, while the corresponding FFT pattern (inset of Fig. 4c) is composed of (001), (111), (110), and (11−1) lattice spots. As shown in Fig. 4d, the selected-area electron diffraction (SAED) pattern displayed (001), (111), (110), and (11−1) lattice spots along the [1−10] zone axis.50 This indicates that the nanocrystals have well-defined diffraction spots for the goethite crystals. The analysis shows that the top surface of the particle has the {100} facet. After analyzing HRTEM and SAED images, we infer that goethite nanocrystals are single crystalline in nature. They have the shape of nanorods and are enclosed by two {100}, two {110}, and two {001} exposed facets. So, the enclosing lattice planes are (100), (−100), (110), (1−10), (001), and (00−1). Fig. 4d is a representative geometrical model of the goethite nanocrystals, having the shape of nanorods.
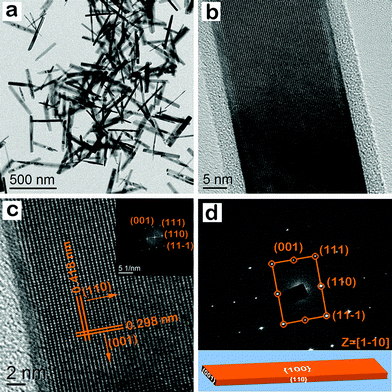 |
| | Fig. 4 (a) TEM image of goethite nanocrystals having the shape of nanorods. (b) HRTEM image of a single nanorod. (c) HRTEM image of a single nanorod having a lattice plane with (110) and (001) indices, and the corresponding FFT pattern indexing (001), (111), (110), and (11−1) lattice spots. (d) SAED pattern of the nanorod having lattice spots with (001), (111), (110) and (11−1) indices. The measured angle between (001) and (110) lattice planes is 90°. (d) shows the geometrical model of a goethite nanocrystal with exposed facets; this nanocrystal has the shape of a nanorod. | |
Hematite nanorod
Fig. 5a shows the TEM image of hematite nanocrystals, having the shape of nanorods. These nanocrystals were synthesized at 393 K for 36 h. Nanorods of uniform size are seen throughout the specimen. Fig. 5a displays an individual nanorod head that clarifies its exposed facets. Fig. 5b clearly displays an individual nanorod with (110) lattice fringes; the corresponding FFT pattern is shown in the inset of Fig. 5b. Fig. 5c shows a highly magnified image of the individual nanorod, and the three classes of lattice fringes are resolved. The lattice spacing of the nanorod is 0.25 nm, which corresponds to (110) and its equivalent lattice planes in a hematite crystal. The interfacial angle between them is found to be 60°, and the corresponding FFT pattern (inset of Fig. 5c) is associated with (110), (−120), and (−210) lattice spots. Fig. 5d shows the SAED pattern displaying (110), (−120), and (−210) lattice spots along the [001] zone axis.51 This indicates that the nanocrystals have well-defined diffraction spots in hematite crystals. Based on our analysis, we infer that the top surface of the particle is the {001} facet. Based on the analysis of HRTEM and SAED images, we infer that hematite nanocrystals are single crystalline in nature; these nanocrystals have the shape of nanorods and are enclosed by two {001}, two {110}, two {120} and two {210} exposed facets. So, the enclosing planes are (001), (00−1), (110), (−1−10), (−120), (1−20), (−210), and (2−10) in the hematite nanocrystal. Fig. 5 is a representative geometrical model of the hematite nanocrystals with exposed facets; these nanocrystals have the shape of nanorods.
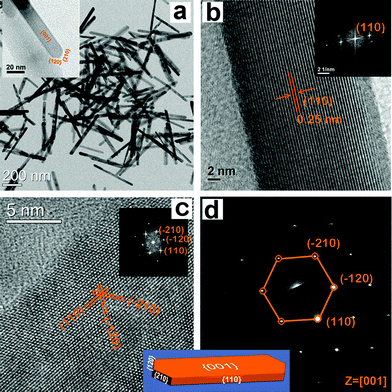 |
| | Fig. 5 (a) TEM image of hematite nanocrystals, having the shape of nanorods (b) HRTEM image of a single nanorod, having a lattice plane with (110) indices; the corresponding FFT pattern had a lattice spot with (110) indices. (c) A highly magnified HRTEM image of a single nanorod, having lattice planes with (110), (−120), and (−210) indices; the corresponding FFT pattern has lattice spots with (110), (−120), and (−210) indices, (d) SAED pattern of the nanorod, having lattice spot with (110), (−120), and (−210) indices. The measured angle between (102) and (−120) lattice planes is 60°. Inset of shows a geometrical model of hematite nanocrystals with exposed facets; these nanocrystals have the shape of nanorods. | |
Hematite nanocuboid
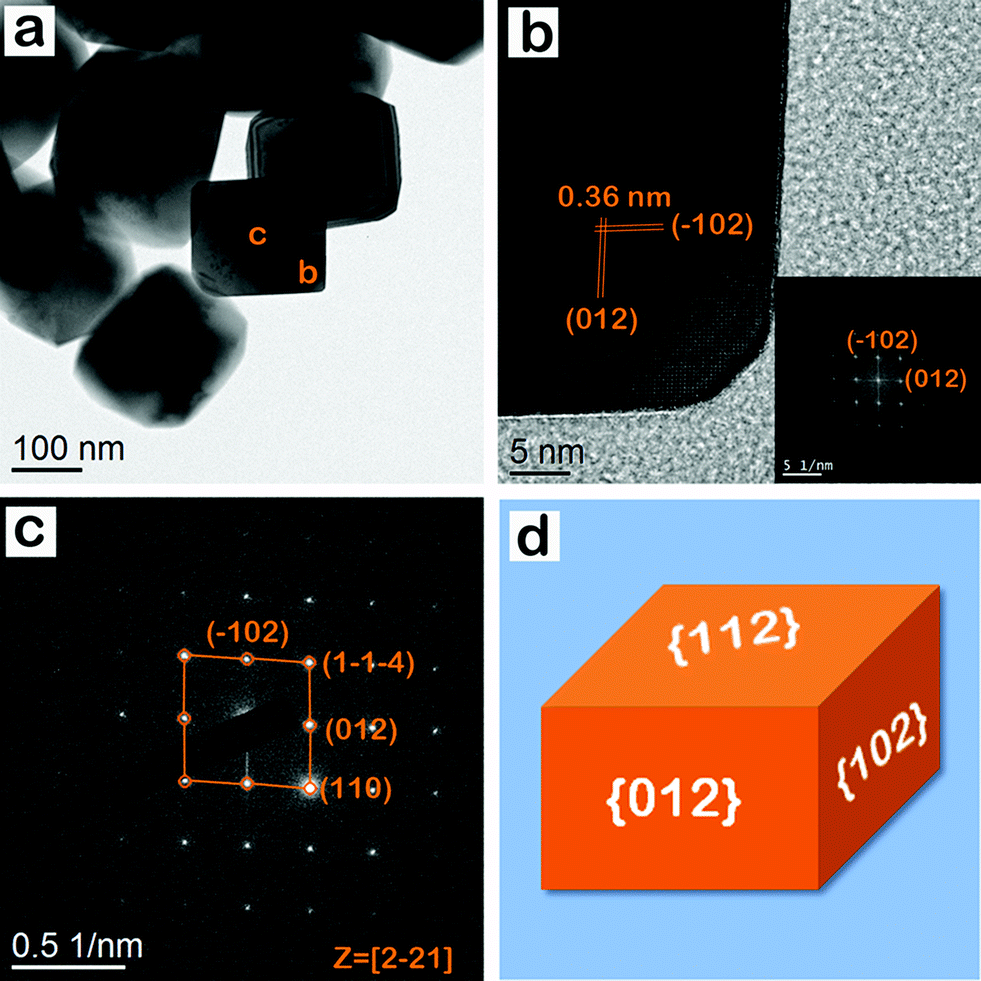
Fig. 6a shows the TEM image of hematite nanocrystals, having the shape of nanocuboids. These nanocrystals were synthesized at 423 K for 36 h. Nanocuboids of uniform size are seen throughout the specimen. HRTEM images are shown in Fig. 6b. The lattice spacing is 0.36 nm in both the cases, corresponding to the (012) and its equivalent lattice planes in hematite crystals. The interfacial angle between (012) and (−102) planes is 94°. Fig. 6c shows a SAED pattern, which is obtained from the region marked ‘c’ of Fig. 6a. The diffraction spots are attributed to (110), (012), (1−1−4) and (−102) lattice spots along the [2−21] zone axis.52 The analysis shows that the top surface of the particle is the {112} facet. The sharp diffraction spots in the SAED pattern reveal the single crystalline nature of the hematite nanocrystals, having the shape of nanocuboids. These nanocrystals are enclosed by two {012}, two {102}, and two {112} exposed facets. So, the enclosing planes are (012), (0−1−2), (−102), (10−2), (1−12), and (−11−2). Fig. 6d shows a representative geometrical model of the hematite nanocrystal with exposed facets; these nanocrystals are nanocuboid in shape.
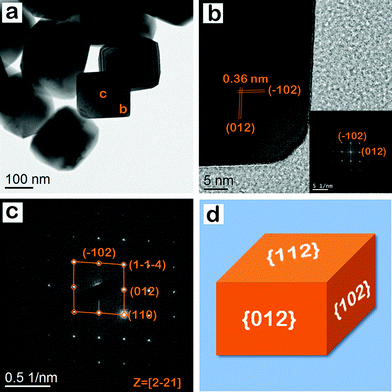 |
| | Fig. 6 (a) TEM image of hematite nanocrystal, having the shape of nanocuboids (b) HRTEM image and the corresponding FFT pattern (inset) have lattice spots with (−102) and (012) indices. (c) SAED pattern with lattice spots having (110), (012), (1−1−4) and (−102) indices. The measured angle between (−102) and (012) is 94°. (d) Geometrical model of hematite nanocrystal with exposed facets; these nanocrystals are nanocuboid in shape. | |
Hematite bitruncated-dodecahedron
Fig. 7a shows the representative TEM image of hematite nanocrystals and its geometrical model (inset of Fig. 7a). These nanocrystals have the shape of a bitruncated dodecahedron. Fig. 7b and its inset show the HR TEM image and the corresponding SAED pattern, which is obtained from the region marked as b in Fig. 7a. In Fig. 7b, the lattice spacing is 0.25 nm, which corresponds to (110) and its equivalent lattice planes in a hematite crystal. The interfacial angle between them is 60°. In the SAED pattern, the diffraction spot is attributed to (110), (−120), and (−210) lattice spots along the [001] zone axis.51 The analysis suggests that the top surface of the particle is the {001} facet. Fig. 7c shows another orientation of the hematite nanocrystals and its geometrical model (inset of Fig. 7c). These nanocrystals have the shape of a bitruncated-dodecahedron. Fig. 7d and its inset show the HR TEM image and the corresponding SAED pattern, which is obtained from the region marked d in Fig. 7c. The lattice spacing is 0.36, 0.27, and 0.23 nm, corresponding to the (012), (0−14), and (006) lattice planes in a hematite crystal. The interfacial angle between (012) and (0−14) is 85°. In the SAED pattern, the diffraction spot is attributed to (012), (006), (0−14), and (0−22) lattice spots along the [100] zone axis.40,53 The analysis suggests that the side surface of the particle is the {104} facet. The sharp diffraction spots in both SAED patterns reveal the single crystalline nature of hematite nanocrystals, having the shape of a bitruncated-dodecahedron. These nanocrystals are enclosed by two {001}, twelve {104}, and six {100} exposed facets. So, the enclosing planes are (001), (00−1), (104), (0−14), (−114), (10−4), (01−4), (−1−14), (−104), (0−14), (−11−4), (−10−4), (0−1−4), (11−4), (100), (−100), (1−10), (−110), (0−10), and (010). The inset of Fig. 7d shows a representative geometrical model of the hematite nanocrystal with exposed facets; these nanocrystals have the shape of a bitruncated-dodecahedron.
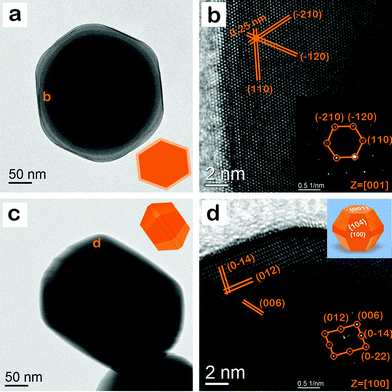 |
| | Fig. 7 (a) TEM image of hematite nanocrystals, having the shape of a bitruncated dodecahedron. The TEM image is a geometrical model of these nanocrystals (top view). (b) HRTEM image and the corresponding SAED pattern (inset), which is the area marked ‘b’ in (a). The SAED pattern displays lattice spots with (110), (−120), and (−210) indices. The measured angle between them is 60°. (c) The geometrical model (side view) of TEM image of the nanocrystal in another orientation. (d) HRTEM image and the corresponding SAED pattern (inset) in the area marked ‘d’ in (c); this SAED pattern has lattice spots with (012), (006), (0−14), and (0−22) indices. The measured angle between (012) and (0−14) is 85°. The inset of (d) shows the geometrical model of the hematite nanocrystal with exposed facets; these nanocrystals have the shape of a bitruncated dodecahedron. | |
Hematite bitruncated-octahedron
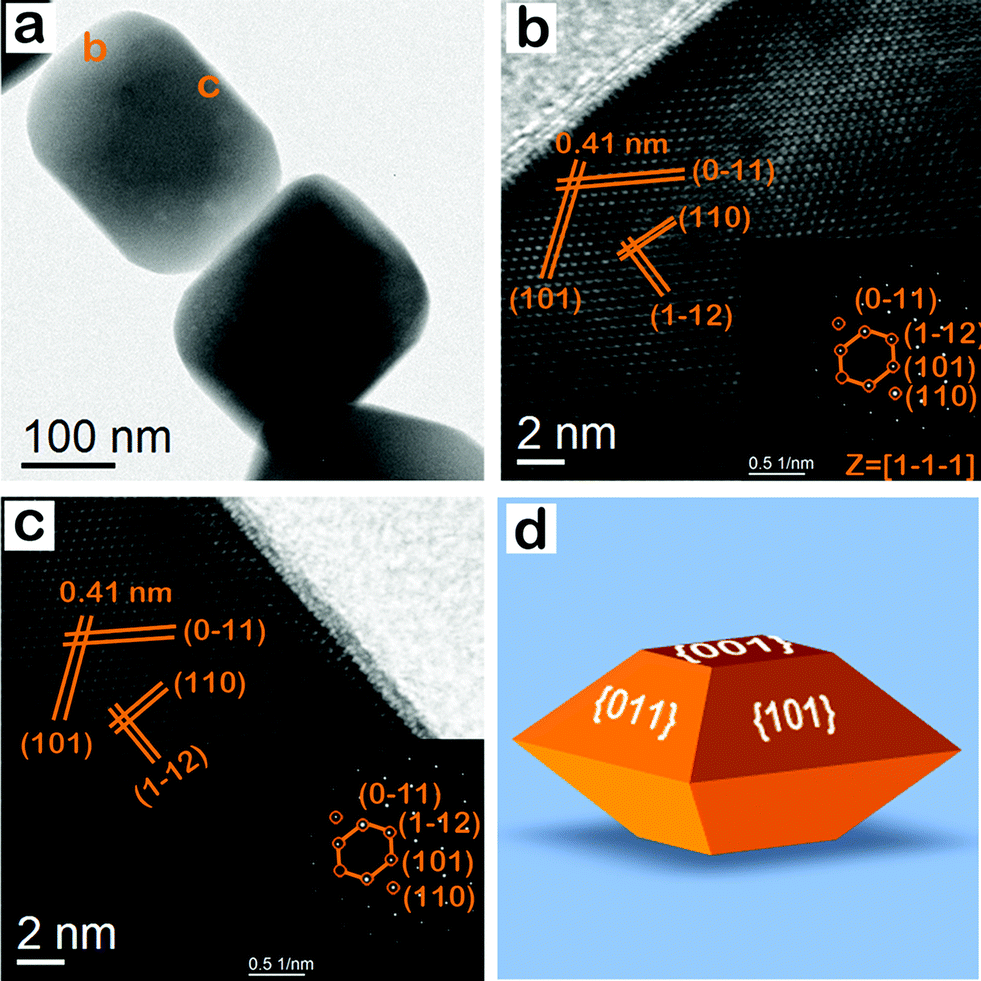
Fig. 8 and S4† display the representative TEM image of different hematite nanocrystals, having the shape of an octahedron. Fig. 8b and its inset show the HR TEM image and the corresponding SAED pattern, which is obtained from the region marked ‘b’ in Fig. 8a. In Fig. 8b, four sets of lattice fringes are clearly observed. The lattice spacing is 0.41, 0.41, 0.36, and 0.25 nm, corresponding to the (101), (0−11), (1−12), and (110) lattice planes of hematite crystals. In the SAED pattern, the diffraction spot is attributed to (110), (101), (1−12), and (0−11) lattice spot along the [1−1−1] zone axis.36 The analysis shows that the marked surface ‘b’ of the particle is the {101} facet. Fig. 8c shows HR TEM image and the corresponding SAED pattern of another surface of the nanocrystals, having the shape of a bitruncated octahedron. The HRTEM image and the corresponding SAED pattern analysis showed that the surface is equivalent to the {101} facet. The sharp diffraction spots in both SAED patterns revealed the single crystalline nature of the nanocrystals, having the shape of a bitruncated octahedron. These nanocrystals are enclosed by two {001} and eight {101} exposed facets. So, the enclosing lattice planes are (001), (00−1), (101), (011), (−101), (0−11), (10−1), (01−1), (0−1−1), and (−10−1). Fig. 8d shows a representative geometrical model of a hematite nanocrystal with exposed facets; this nanocrystal has the shape of a bitruncated octahedron.
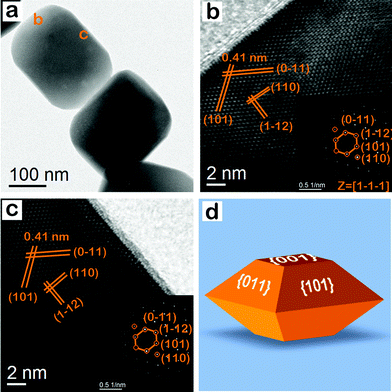 |
| | Fig. 8 (a) TEM image of hematite nanocrystal, having the shape of a bitruncated-octahedron. (b) HRTEM image and the corresponding SAED pattern (inset), which is obtained from the area marked ‘b’ in (a); this SAED pattern shows lattice spots with (110), (101) (1−12) and (0−11) indices. (c) HRTEM image and the corresponding SAED pattern (inset), which is obtained from the area marked ‘c’ in (a); this SAED pattern shows lattice spots with (110), (101), (1−12), and (0−11) indices. The angle between (101) and (0−11) lattice spots is 110°, while the angle between (101) and (1−12) is 55° in both diffraction patterns. (d) Geometrical model of a hematite nanocrystal with exposed facets; this nanocrystal has the shape of a bitruncated octahedra. | |
Growth mechanism of single-crystals
We could understand how temperature affected the growth of crystals in this syntheses method. In this study, we varied only the temperature and duration of reaction for synthesizing nanocrystals of different shapes. But, other parameters, such as template and Fe3+ concentration, pH, volume of the reaction mixture, solution medium, etc. were kept constant. The growth of crystals is a complicated process, which is highly dependent on the surface energy and atomic arrangements of the crystal's facets. Different facets grow at different rates during the growth of a crystal. Typically, low-energy facets have slower growth rates than high-energy facets. Overall, the final crystal shape is governed by the slow-growing facets and the shapes of energy minima.4,8 A crystal's growth is also highly related to temperature, since the Gibb's free energy of formation depends on the temperature of the critical nucleus.54 In this study, we obtained nanocrystals with different crystal facets by tuning the reaction temperature (SEM and TEM analysis). In these syntheses, iron nitrate nonahydrate was used as a precursor, and sodium salicylate was used as the capping agent. Furthermore, sodium hydroxide was used as the bridging ligand, while water was used as the solvent. Sodium salicylate is widely used to control the morphology and nanostructure of metal oxides.55–57 The hydroxide anion (bridging agent) facilitates the formation of the Fe–O–Fe skeleton, while the salicylate moiety of the capping agent inhibits the formation of the Fe–O–Fe skeleton. This is because there is a covalent interaction between the salicylate anions and positively charged Fe3+ centers. In this synthesis method, the capping agent, bridging agents, and solvents are chosen to not only control the shape, facets, and size of nanocrystals but also to ensure that the nanocrystals have a narrow distribution. At room temperature (298 K), iron nitrate is hydrolyzed in a basic medium (pH = 8) in the presence of salicylate, which acts as a capping agent. The overall reaction is obtained by combining chemical equations (1) and (2). Thus, goethite nanocrystals are produced.| | | Fe(NO3)3 + 6H2O = Fe(H2O)6(NO3)3 | (1) |
| | | Fe(H2O)6(NO3)3 + 3NaOH = α-FeOOH + 3NaNO3 + 7H2O | (2) |
| | | 2α-FeOOH = α-Fe2O3 + H2O | (3) |
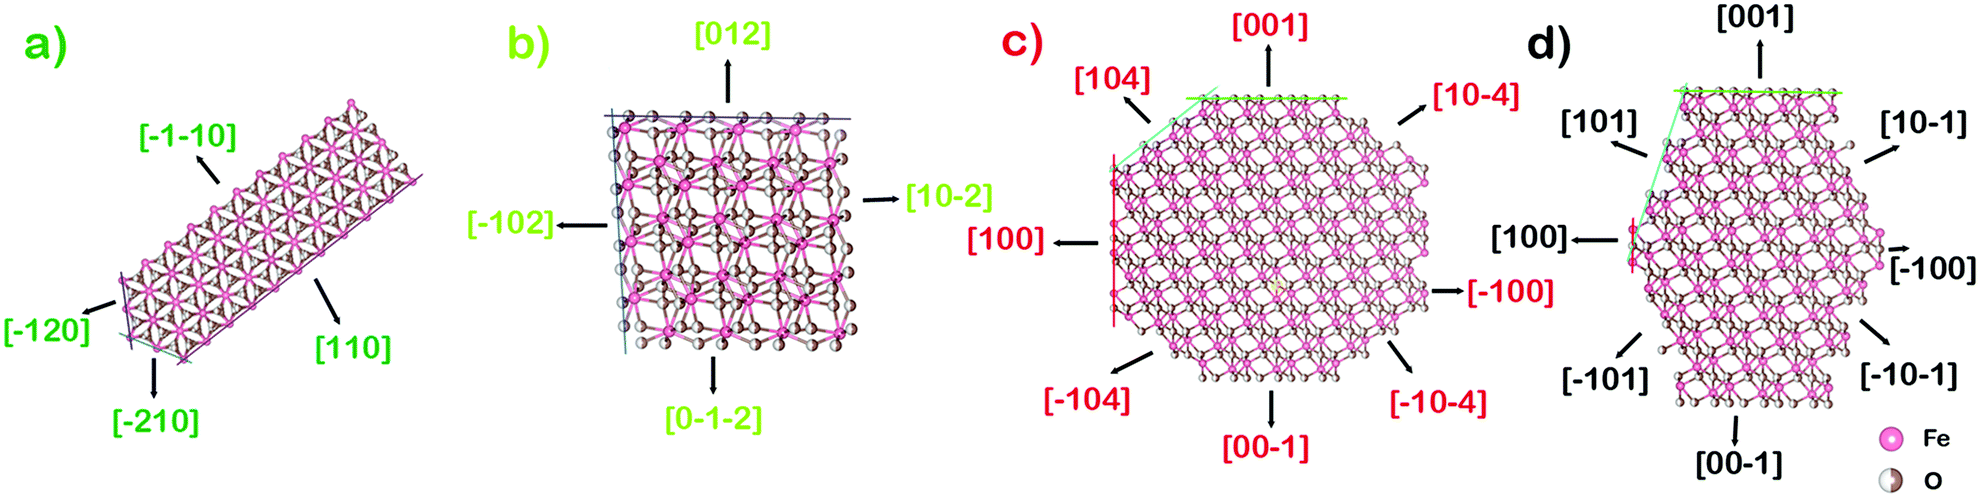
When these nanoparticles are subjected to hydrothermal treatment at 348 K, goethite nanorods are obtained, which are enclosed by the following exposed facets: two {100}, two {110}, and two {001}. In this case, crystal growth takes place along {100}, {110}, and {001} surfaces, but maximum growth takes place along the [001] direction. This means that the salicylate moiety controls the growth of (100) and (110) surfaces but growth is allowed in the z-direction due to weak interactions between (001) and salicylate. This is confirmed by the obtained HRTEM images (Fig. 4). The formation of goethite nanorods is thermodynamically favored because it facilitates the growth of high energy surfaces. The surface energy of goethite crystal follows the following lattice order: γ{110} < γ{101} < γ{111}, < γ{001} < γ{100}, while the surface energy of these facets are 1.18, 1.26, 1.33, 1.68, and 1.92 J m−2, respectively.58 By further increasing the hydrothermal temperature of these nanoparticles to 393 K, goethite nanoparticles are converted to hematite nanorods in the reaction represented by chemical equation (3). Scheme 2a shows the crystal growth of these nanorods in the [001] project direction. In these nanorods, the following exposed facets two {001}, two {110}, two {120}, and two {210} are enclosed by 74.2% {001} + 25.8% {110}. However, maximum growth takes place along the [300], [110] and its equivalent direction, while the maximum exposed surface is {001}. The {001} surface has the lowest energy of 1.66 J m−2, so it is the most stable surface in these hematite nanorods. According to the theoretical density functional theory, the calculated relaxed surface energy of hematite crystal follows the order: γ{001} < γ{012} < γ{110} < γ{100} < γ{101} < γ{111}, while the surface energy of these facets are 1.66, 1.92, 1.97, 2.19, 2.29, and 2.33 J m−2, respectively.59 When we further increased the synthesis temperature to 423 K, hematite nanocuboids were formed with a 100% exposed facet {012}. Scheme 2b shows the crystal growth of these nanocuboids in the [2−21] project direction. At this temperature, only the {012} facet and its equivalent surface grew to get exposed. Furthermore, at a reaction duration of 36 h, we increased the synthesis temperature to 453 K and obtained nanocrystals of irregular shape. When the same temperature was maintained for a duration of 72 h, we obtained hematite nanocrystals, having the shape of bitruncated dodecahedron. In these nanocrystals, a greater number of high energy surfaces were exposed. Thus, the following exposed facets two {001}, twelve {104}, and six {100} were enclosed with 27% {001} + 50.4% {104} + 22.6% {100} facets. As shown in Scheme 2c, the growth of the particle takes place along the [001] and [100] direction, exposing the {104} surface to a maximum extent. PXRD analysis showed that the relative intensity of the (104) plane was the highest. But, the (100) plane also had comparatively higher surface energy. By increasing the synthesis temperature to 473 K, higher surface energy (101) planes are exposed on hematite nanocrystals growing along the [001] and [100] direction (shown in Scheme 2d). These nanocrystals have the shapes of a bitruncated-elongated octahedron and a bitruncated-octahedron (S200-BTEO and S200-BTO). Furthermore, these nanocrystals are enclosed by the highly exposed {101} surface. Thus, although all the primary parameters were kept fixed, the reaction temperature and duration were varied to control the morphology and exposed facets of the nanocrystals. The analysis shows that planes of comparatively low surface energy get exposed when the synthesis temperature is low, whereas planes with higher surface energy get exposed when the synthesis temperature is high. Thus, temperature is the key parameter that controls the morphology of nanocrystals.
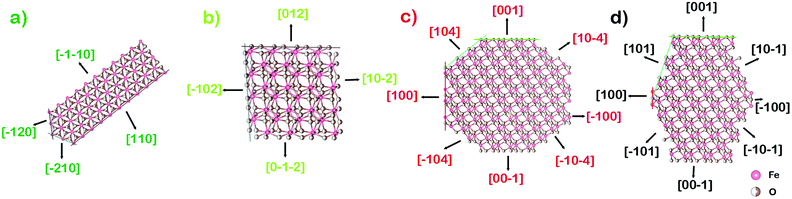 |
| | Scheme 2 Crystal structure of hematite having different indices and their growth direction project along: (a) [001], (b) [2−21], (c) [010] and (d) [010] direction. | |
The crystal structures of hematite explain the growth of a (a) nanorod (b) nanocuboid (c) truncated-dodecahedron and (d) truncated-octahedron.
Photocatalysis
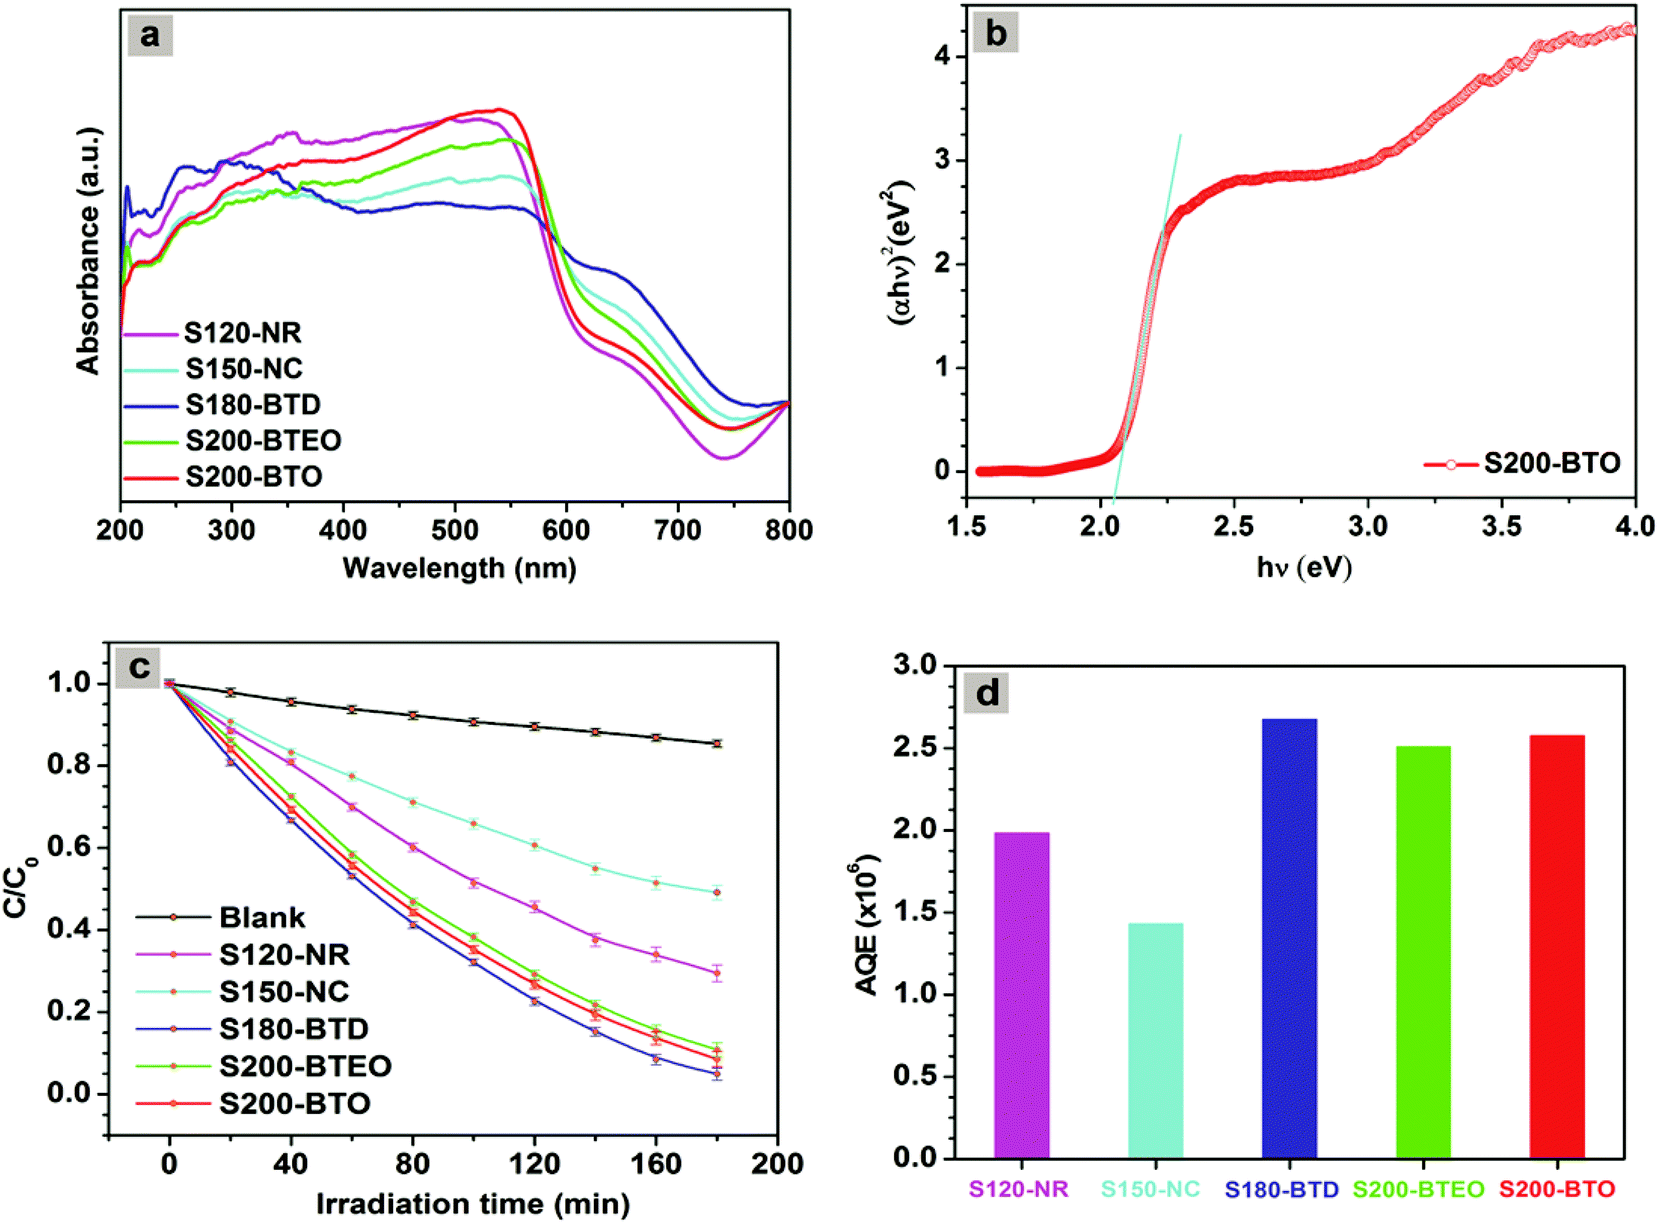
The photocatalytic reactivity of the nanocatalyst is determined by its surface area, electronic, and atomic structure. The BET N2 sorption method is used to measure the surface area of the hematite nanocrystals having different shapes.60,61 As seen in Table 2, the surface area of all nanocrystals is almost similar, regardless of their shape. The electronic structures of hematite nanocrystals were determined by UV-visible diffuse reflectance spectroscopy. Fig. 9a shows the absorption spectra of hematite nanocrystals. All the nanocrystals have shown absorption bands around 540–575 nm,19 having band gap energies of 2.05, 1.99, 2.08, 2.01, and 2.06 eV for the hematite nanorod (S120-NR), nanocuboid (S150-NC), bitruncated-dodecahedron (S180-BTD), bitruncated-elongated octahedron (S200-BTEO), and bitruncated-octahedron (S200-BTO), respectively. Fig. 9b shows the band gap energy profile of nanocrystals having the shape of a bitruncated octahedron. Based on the analysis, we infer that the valence band and conduction band structures of these materials are identical. Moreover, the band gap energy of these nanocrystals lies in the visible region of the electromagnetic spectrum. We investigated the photocatalytic reactivity of hematite nanocrystals having different shapes by irradiating methyl orange (MO) with white light (λ > 420 nm) in the presence of H2O2 (additive). Thus, methyl orange underwent degradation due to the photocatalytic reactivity of hematite crystals. The photocatalytic reaction was carried out using 0.02 mM methyl orange solution. Fig. 9c shows the decomposition rate of MO solution as a function. In Fig. 9c, C and C0 represent the concentration of MO after and before irradiation. Fig. S5† shows the corresponding UV-visible spectra obtained using nanocrystals of different shapes. As shown in Fig. S5a,† MO solution underwent negligible photodegradation in the presence of light when catalysts and H2O2 were not added to the solution. In 180 min, only 12% of the MO molecules underwent degradation. But, after the addition of hematite nanocrystals, the photodegradation rates increased rapidly. This indicates that hematite nanocrystals produced a highly reactive hydroxyl radical, promoting the photodegradation of MO in the presence of H2O2 and white light. In the photodegradation reaction, hydroxyl radicals catalyse the reduction of Fe3+ ions to Fe2+ ions through the photo Fenton reaction mechanism.37| | | Fe3+ + Dye* → Fe2+ + Dye+˙ | (5) |
| | | Fe2+ + H2O2 → Fe3+ + ˙OH + OH− | (6) |
| | | Dye+˙ (or Dye) + ˙OH → CO2 + H2O | (7) |
 |
| | Fig. 9 (a) UV–visible diffused reflectance spectra of hematite nanocrystals with indexing sample name. (b) The band gap energy of nanocrystals, having the shape of bitruncated-octahedron (S200-BTO). (c) The photodegradation rate of MO dye using various types of hematite nanocrystals as photocatalyst. Reaction conditions: 50 ml MO of concentration 0.02 mM, catalyst 10 mg, 0.5 mL of H2O2 (30 wt%) solution, initial pH 6.2, solar simulator with a 150 W xenon-lamp (cut-off filter 420 nm) with an average light intensity of 92.33 mW cm−2. (d) The apparent quantum efficiency of corresponding S120-NR, S150-NC, S180-BTD, S200-BTEO, and S200-BTO shaped photocatalysts. | |
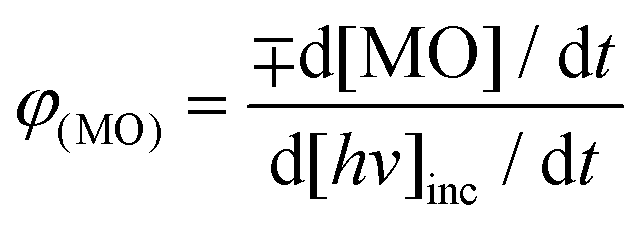
Following this mechanism of MO degradation over hematite nanocrystals, major degradation intermediates were identified by LC-MS and are summarized in Table S4† and confirmed by ESI-MS (Fig. S6 and S7†). MO degradation takes place through N-demethylation and then the destruction of the azo bond. The proposed mechanism of MO degradation is shown in Fig. S8.† A number of intermediates were identified by liquid chromatography (retention time 1.79 min, m/z 304 denoted compound A; retention time 1.38 min, m/z 290 denoted compound B; and retention time 1.06 min, m/z 97.1 denoted compound C). The performance of photocatalysts depends on so many parameters especially catalyst loading, the total optical power of light impinging on the sample and the substrate concentration.62 From Fig. 9C, we see that hematite nanocrystals, having the shapes of a nanorod, nanocuboid, bitruncated-dodecahedron, bitruncated-elongated octahedron, and bitruncated-octahedron, show 70.2, 51.8, 96.5, 89.2 and 91.4% MO degradation efficiency, respectively. For comparing the photocatalytic activity of these shaped materials, the apparent quantum efficiency (AQE)62–64 was calculated using the formula given below:
where d[MO]/d
t is the rate of change of the concentration of the MO and d[
hv]
inc/d
t is the total optical power impinging on the sample. Here AQE does not take into account the fraction of light absorbed by the hematite photocatalyst. The rate of change of MO was measured from the reaction mixture. White light (
λ > 420 nm) was illuminated on the 45.2 cm
2 reaction area at 92.33 mW cm
−2 light intensity and 4.027 × 10
17 cm
−2 s
−1 photon flux. The measured AQE are listed in
Table 2 and plotted in
Fig. 9d for a nanorod, nanocuboid, bitruncated-dodecahedron, bitruncated-elongated octahedron, and bitruncated-octahedron, and these shaped nanocrystals show different degradation efficiency, and the AQE were 1.984 × 10
−6, 1.431 × 10
−6, 2.675 × 10
−6, 2.509 × 10
−6, 2.574 × 10
−6 respectively. As nanocrystals of different shapes have different exposed facets, they show different catalytic activity.
Table 1 displays the exposed percentages of nanocrystals having different shapes and exposed facets. In this table, the exposed surfaces of nanorods have 74.2%{001} + 25.8% {110}, nanocuboids have 100% {012}, bitruncated-dodecahedron have 27% {001} + 50.4% {104} + 22.6% {100}, bitruncated-elongated octahedron have 3.5% {001} + 96.5% {101} and bitruncated-octahedron have 5.2% {001} + 94.8% {101} exposed surfaces. The atomic arrangements of these surfaces are different in nanocrystals of different shapes. While catalyzing the degradation of MO dye, the exposed Fe
3+ is the main active centre. Sun and coworkers
36 have reported that different atomic planes have different Fe
3+ density due to their atomic arrangements. The density of exposed Fe
3+ on (012), (001), (110), (104), and (100) planes was 0.0733, 0.0911, 0.100, 0.103, and 0.1158 [Å
−2], respectively. So, with a high density of 50.4% {104} + 22.6% {100} planes, hematite nanocrystals having the shape of a bitruncated-dodecahedron showed maximum photocatalytic activity. In contrast, with a low density of 100% {012}, nanocuboid nanocrystals had lowest photocatalytic activity among all the nanocrystals. Thus, the photocatalytic activity of different nanocrystals was in the following order: {104} + {100} + {001} (bitruncated-dodecahedron) > {101} + {001} (bitruncated-octahedron) > {001} + {110} (nanorods) > {012} (nanocuboid). In the photocatalytic reaction, after the completion of the reaction, the catalyst was recovered by using an external magnet (Fig. S9
†) and washed thoroughly with water and ethanol. We also examined the reusability of hematite nanocrystals. According to the results shown in Fig. S10,
† the catalyst has very high recycling efficiency as it could be used in six consecutive cycles.
Conclusion
In conclusion, we have developed a very simple and an environmentally friendly method of synthesizing goethite and hematite nanocrystals having different shapes. The temperature controls the growth and shape of nanocrystals. Nanocrystals of different morphologies could be obtained by tuning the reaction temperature, while the growth of nanocrystals was related to the surface energy of the growing plane. Depending on the surface energy and temperature of the reaction, nanocrystals of different shapes exposed the following different facets: {001}, {110}, {100}, {012}, {104} and {101}. The synthesis process shows that we can control the size, shape, and facets of the nanocrystals simply by tuning the reaction temperature. The size of nanocrystals increases when the hydrothermal temperature and duration of the reaction are increased. At higher temperatures, we could obtain complex polyhedron nanocrystals. All the three dimensions of these complex nanocrystals were stable as per Euler's Formula. Hematite nanocrystals showed high photocatalytic activity that stimulated MO degradation in the presence of white light. The nanocrystals with a bitruncated-dodecahedron shape had high Fe3+ density on surfaces {100} + {104}. So, these nanocrystals were found to have highest catalytic activity among all the hematite nanocrystals. Nanocuboid nanocrystals had the lowest catalytic activity with low Fe3+ density on the surface {012}. In addition to the removal of pollutants, these newly synthesized hematite nanocrystal can find possible applications in hydrogen generation through water splitting and in Li ion batteries.
Acknowledgements
SKK thanks the senior research fellows working at Council of Scientific and Industrial Research (CSIR), New Delhi. AB wishes to thank the Department of Science and Technology (DST), New Delhi for providing instrument facilities through Nano Mission Initiative, DST-SERB, DST-UKIERI project grants. DK received grant from the National Research Foundation of Korea, which is funded by the Korean Government (MEST) (NRF-2009-0093033, NRF-2010-0027955 and NRF-2012R1A2A1A05026313).
Notes and references
- C. T. Campbell and J. Sauer, Chem. Rev., 2013, 113, 3859–3862 CrossRef CAS PubMed.
- N. Tian, Z.-Y. Zhou, S.-G. Sun, Y. Ding and Z. L. Wang, Science, 2007, 316, 732–735 CrossRef CAS PubMed.
- A. Erlebach, H.-D. Kurland, J. Grabow, F. A. Müller and M. Sierka, Nanoscale, 2015, 7, 2960–2969 RSC.
- Z.-Y. Zhou, N. Tian, J.-T. Li, I. Broadwell and S.-G. Sun, Chem. Soc. Rev., 2011, 40, 4167–4185 RSC.
- J. F. Weaver, Chem. Rev., 2013, 113, 4164–4215 CrossRef CAS PubMed.
- C. I. Cheng, Y.-P. Chang and Y.-H. Chu, Chem. Soc. Rev., 2012, 41, 1947–1971 RSC.
- X. Lang, W. Hao, W. R. Leow, S. Li, J. Zhao and X. Chen, Chem. Sci., 2015, 6, 5000–5005 RSC.
- Q. Kuang, X. Wang, Z. Jiang, Z. Xie and L. Zheng, Acc. Chem. Res., 2014, 47, 308–318 CrossRef CAS PubMed.
- L. Manna, D. J. Milliron, A. Meisel, E. C. Scher and A. P. Alivisatos, Nat. Mater, 2003, 2, 382–385 CrossRef CAS PubMed.
- J. Gong, Chem. Rev., 2012, 112, 2987–3054 CrossRef CAS PubMed.
- E. C. Dreaden, A. M. Alkilany, X. Huang, C. J. Murphy and M. A. El-Sayed, Chem. Soc. Rev., 2012, 41, 2740–2779 RSC.
- M. H. Huang and C.-Y. Chiu, J. Mater. Chem. A, 2013, 1, 8081–8092 CAS.
- Z. Quan, Y. Wang and J. Fang, Acc. Chem. Res., 2013, 46, 191–202 CrossRef CAS PubMed.
- M. H. Huang, S. Rej and S.-C. Hsu, Chem. Commun., 2014, 50, 1634–1644 RSC.
- W. Zang, G. Li, L. Wangab and X. Zhang, Catal. Sci. Technol., 2015, 5, 2532–2553 CAS.
- S. Rej, H.-J. Wang, M.-X. Huang, S.-C. Hsu, C.-S. Tan, F.-C. Lin, J.-S. Huang and M. H. Huang, Nanoscale, 2015, 7, 11135–11141 RSC.
- L. Polavarapu, S. Mourdikoudis, I. Pastoriza-Santos and J. Pérez-Juste, CrystEngComm, 2015, 17, 3727–3762 RSC.
- A. K. Patra, A. Dutta and A. Bhaumik, J. Phys. Chem. C, 2014, 118, 16703–16709 CAS.
- A. K. Patra, A. Dutta and A. Bhaumik, ACS Appl. Mater. Interfaces, 2012, 4, 5022–5028 CAS.
- X. Mou, X. Wei, Y. Li and W. Shen, CrystEngComm, 2012, 14, 5107–5120 RSC.
- L. B. Wang, L. X. Song, Z. Dang, J. Chen, J. Yang and J. Zeng, CrystEngComm, 2012, 14, 3355–3358 RSC.
- M. Cao, T. Liu, S. Gao, G. Sun, X. Wu, C. Hu and Z. L. Wang, Angew. Chem., Int. Ed., 2005, 44, 4197–4201 CrossRef CAS PubMed.
- Z.-H. Ruan, J.-H. Wu, J.-F. Huang, Z.-T. Lin, Y.-F. Li, Y.-L. Liu, P.-Y. Cao, Y.-P. Fang, J. Xie and G.-B. Jiang, J. Mater. Chem. A, 2015, 3, 4595–4603 CAS.
- L. Sun, X. Han, K. Liu, S. Yin, Q. Chen, Q. Kuang, X. Han, Z. Xie and C. Wang, Nanoscale, 2015, 7, 9416–9420 RSC.
- M. Mahmoudi, A. S. Milani and P. Stroeve, Int. J. Biomed. Nanosci. Nanotechnol., 2010, 1, 164–201 CrossRef CAS.
- F. Zheng, M. He, Y. Yang and Q. Chen, Nanoscale, 2015, 7, 3410–3417 RSC.
- J. S. Cho, Y. J. Hong, J.-H. Lee and Y. C. Kang, Nanoscale, 2015, 7, 8361–8367 RSC.
- X. Qi, G. She, X. Huang, T. Zhang, H. Wang, L. Mu and W. Shi, Nanoscale, 2014, 6, 3182–3189 RSC.
- M. Wang, M. Pyeon, Y. Gönüllü, A. Kaouk, S. Shen, L. Guo and S. Mathur, Nanoscale, 2015, 7, 10094–10100 RSC.
- D. A. Wheeler, G. Wang, Y. Ling, Y. Li and J. Z. Zhang, Energy Environ. Sci., 2012, 5, 6682–6702 CAS.
- X. Mou, X. Wei, Y. Li and W. Shen, CrystEngComm, 2012, 14, 5107–5120 RSC.
- S. Xie, H. Jia, F. Lu, N. Sun, J. Yu, S. Liu and L. Zheng, CrystEngComm, 2015, 17, 1210–1218 RSC.
- J. Yin, Z. Yu, F. Gao, J. Wang, H. Pang and Q. Lu, Angew. Chem., Int. Ed., 2010, 49, 6328–6332 CrossRef CAS PubMed.
- X. Wang, J. Wang, Z. Cui, S. Wang and M. Cao, RSC Adv., 2014, 4, 34387–34394 RSC.
- L. Chen, X. Yang, J. Chen, J. Liu, H. Wu, H. Zhan, C. Liang and M. Wu, Inorg. Chem., 2010, 49, 8411–8420 CrossRef CAS PubMed.
- B. Lv, Z. Liu, H. Tian, Y. Xu, D. Wu and Y. Sun, Adv. Funct. Mater., 2010, 20, 3987–3996 CrossRef CAS.
- R. Liu, Y. Jiang, H. Fan, Q. Lu, W. Du and F. Gao, Chem. – Eur. J., 2012, 18, 8957–8963 CrossRef CAS PubMed.
- X. Zhou, J. Lan, G. Liu, K. Deng, Y. Yang, G. Nie, J. Yu and L. Zhi, Angew. Chem., Int. Ed., 2012, 51, 178–182 CrossRef CAS PubMed.
- Y. Zhao, F. Pan, H. Li, T. Niu, G. Xu and W. Chen, J. Mater. Chem. A, 2013, 1, 7242–7246 CAS.
- J. Ouyang, J. Pei, Q. Kuang, Z. Xie and L. Zheng, ACS Appl. Mater. Interfaces, 2014, 6, 12505–12514 CAS.
- M. Lin, L. Tng, T. Lim, M. Choo, J. Zhang, H. Tan and S. Bai, J. Phys. Chem. C, 2014, 118, 10903–10910 CAS.
- L. Leon-Reina, J. M. Compana, Á. G. De la Torre, R. Moreno, L. E. Ochando and M. A. G. Aranda, Powder Diff., 2011, 26, 48–52 CrossRef CAS.
- B. Wang, H. Wu, L. Yu, R. Xu, T.-T. Lim and X. W. Lou, Adv. Mater., 2012, 24, 1111–1116 CrossRef CAS PubMed.
- A. K. Patra, A. Dutta and A. Bhaumik, Chem. – Eur. J., 2013, 19, 12388–12395 CrossRef CAS.
- L. Wang and L. Gao, J. Phys. Chem. C, 2009, 113, 15914–15920 CAS.
- P. Basnet, G. K. Larsen, R. P. Jadeja, Y.-C. Hung and Y. Zhao, ACS Appl. Mater. Interfaces, 2013, 5, 2085–2095 CAS.
- D. L. A. de Faria, S. Venâncio Silva and M. T. de Oliveira, J. Raman Spectrosc., 1997, 28, 873–878 CrossRef CAS.
- K. F. McCarty, Solid State Commun., 1988, 68, 799–802 CrossRef CAS.
- H. Cao, X. Qian, C. Wang, X. Ma, J. Yin and Z. Zhu, J. Am. Chem. Soc., 2005, 127, 16024–16025 CrossRef CAS PubMed.
- P. Ou, G. Xu, Z. Ren, X. Hou and G. Han, Mater. Lett., 2008, 62, 914–917 CrossRef CAS.
- J. Kang, Q. Kuang, Z.-X. Xie and L.-S. Zheng, J. Phys. Chem. C, 2011, 115, 7874–7879 CAS.
- S. He, G.-S. Wang, J.-W. Wang, Y.-Z. Wei, Y. Wu, L. Guo and M.-S. Cao, ChemPlusChem, 2013, 78, 875–883 CrossRef CAS.
- X. Li, W. Wei, S. Wang, L. Kuai and B. Geng, Nanoscale, 2011, 3, 718–724 RSC.
-
P. Cubillas and M. W. Anderson, Synthesis Mechanism: Crystal Growth and Nucleation, in Zeolites and Catalysis, Wiley-VCH Verlag GmbH & Co. KGaA, 2010, pp. 1–55 Search PubMed.
- A. K. Patra, S. K. Kundu, D. Kim and A. Bhaumik, ChemCatChem, 2015, 7, 791–798 CrossRef CAS.
- V. Kumari, A. K. Patra and A. Bhaumik, RSC Adv., 2014, 4, 13626–13634 RSC.
- A. K. Patra, A. Dutta and A. Bhaumik, J. Hazard. Mater., 2012, 201–202, 170–177 CrossRef CAS PubMed.
- N. H. de Leeuw and T. G. Cooper, Geochim. Cosmochim. Acta, 2007, 71, 1655–1673 CrossRef CAS.
- N. Dzade, A. Roldan and N. A. de Leeuw, Minerals, 2014, 4, 89–115 CrossRef CAS.
- A. K. Patra, A. Dutta and A. Bhaumik, J. Solid State Chem., 2014, 215, 135–142 CrossRef CAS.
- N. Pal, E.-B. Cho, D. Kim and M. Jaroniec, J. Phys. Chem. C, 2014, 118, 15892–15901 CAS.
- J. M. Buriak, P. V. Kamat and K. S. Schanze, ACS Appl. Mater. Interfaces, 2014, 6, 11815–11816 CAS.
- M. R. Hoffmann, S. T. Martin, W. Choi and D. W. Bahnemannt, Chem. Rev., 1995, 95, 69–96 CrossRef CAS.
- K. Lee, D. A. Ruddy, G. Dukovic and N. R. Neale, J. Mater. Chem. A, 2015, 3, 8115–8122 CAS.
Footnote |
| † Electronic supplementary information (ESI) available. See DOI: 10.1039/c5nr06509g |
|
| This journal is © The Royal Society of Chemistry 2016 |
Click here to see how this site uses Cookies. View our privacy policy here.