 Open Access Article
Creative Commons Attribution 3.0 Unported Licence
Hierarchical thermoelectrics: crystal grain boundaries as scalable phonon scatterers
Daniele
Selli
abc,
Salah Eddine
Boulfelfel
d,
Philipp
Schapotschnikow
ef,
Davide
Donadio
bg and
Stefano
Leoni
*ah
aCardiff University, School of Chemistry, Park Place, CF10 3AT, Cardiff, UK
bMax Planck Institute for Polymer Research, Ackermannweg 10, 55128, Mainz, Germany
cTechnische Universität Dresden, Institut für Theoretische Chemie, 01062 Dresden, Germany
dGeorgia Institute of Technology, School of Chemical & Biomolecular Engineering, Atlanta, GA 30332-0100, USA
eProcess and Energy Laboratory, Delft University of Technology, Delft, 2628 CA, The Netherlands
fBrains for Hire, Valpichlerstr. 86, 80686 Munich, Germany
gDepartment of Chemistry, University of California Davis, One Shields Ave., Davis, CA 95616, USA
hUniversity of Berne, Department of Chemistry and Biochemistry, Freiestrasse 3, 3012 Bern, Switzerland. E-mail: leonis@cf.ac.uk
First published on 15th January 2016
Abstract
Thermoelectric materials are strategically valuable for sustainable development, as they allow for the generation of electrical energy from wasted heat. In recent years several strategies have demonstrated some efficiency in improving thermoelectric properties. Dopants affect carrier concentration, while thermal conductivity can be influenced by alloying and nanostructuring. Features at the nanoscale positively contribute to scattering phonons, however those with long mean free paths remain difficult to alter. Here we use the concept of hierarchical nano-grains to demonstrate thermal conductivity reduction in rocksalt lead chalcogenides. We demonstrate that grains can be obtained by taking advantage of the reconstructions along the phase transition path that connects the rocksalt structure to its high-pressure form. Since grain features naturally change as a function of size, they impact thermal conductivity over different length scales. To understand this effect we use a combination of advanced molecular dynamics techniques to engineer grains and to evaluate thermal conductivity in PbSe. By affecting grain morphologies only, i.e. at constant chemistry, two distinct effects emerge: the lattice thermal conductivity is significantly lowered with respect to the perfect crystal, and its temperature dependence is markedly suppressed. This is due to an increased scattering of low-frequency phonons by grain boundaries over different size scales. Along this line we propose a viable process to produce hierarchical thermoelectric materials by applying pressure via a mechanical load or a shockwave as a novel paradigm for material design.
Introduction
Thermoelectrics are materials of top priority for waste heat conversion into valuable energy.1–5 The family of narrow gap semiconducting lead chalcogenides PbX (X = S, Se, Te) with a rocksalt crystal structure is attracting considerable attention for energy conversion applications.6,7 The efficiency of a material in thermoelectric conversion is related to and limited by its dimensionless figure of merit ZT = σS2T/κ. In this expression, σ is the electrical conductivity, S is the Seebeck coefficient, T is the absolute temperature, and κ = κe + κl accounts for the total thermal conductivity, which is the sum of an electronic (e) and a lattice (l) contribution. An improved figure of merit is achieved, for example, by introducing dopants. The introduction of Na for instance affects carrier concentration and at the same time lowers lattice thermal conductivity via the formation of Na-rich nano-precipitates8 and Na doped polycrystalline PbSe.9 Other approaches based on spinodal decomposition, nucleation and growth have been successfully used to prepare materials with very low lattice thermal conductivity,10 which are not solid solutions but heterogeneous at the nanoscale. The critical issue therein is the controlled production of coherent nanoscale precipitates for more efficient phonon scattering.11 While in general it represents a powerful paradigm for better thermoelectric compounds, nanostructuring can affect only portions of the phonon spectrum, i.e. roughly those modes with mean free paths with similar length scales as the nanostructures. In diamond, silicon and SiGe alloys, the relevant mean free paths for heat carriers extend over at least three orders of magnitude.12–17 Therein, nanograins can act as phonon scatterers. In PbSe this distribution is narrower and implies shorter mean free paths, up to 100 nm, according to first-principles calculations.18 Therefore a different approach to structuring this material is required, if the whole range of main heat carriers has to be affected: one in which nanostructuring represents only one scale of an otherwise hierarchical distribution of lengths. Material engineering at the meso-scale is emerging as a more efficient strategy of controlling phonon scattering, where also medium to long mean free paths are affected. This strategy requires complete understanding of material morphology and its consequences for the thermal conductivity at varying length scales. Pioneering work in this direction has been recently performed for the SrTe–PbTe system with Na doping19 and MgTe–PbTe.20 Therein, besides nanoscale precipitates, grains up to the micrometer scale present a novel ingredient. The presence of grains and grain boundaries is understood to be a means to trespass the ZT threshold of 2. As a result, grains and domain boundaries open novel perspectives in material engineering,21–23 for they implement a natural way of size re-scaling over different lengths.24 In contrast to the local nano-precipitates, grains and their boundaries offer a way of accommodating disparate scale lengths in a material, without necessarily affecting composition. While they can be used together with doping and nanoscale precipitates as proven in experiments,19 grains should be capable of lowering thermal conductivity on their own, at “constant chemistry” so to speak.Guided by this idea, in this work we investigate the formation and thermal conductivity of polycrystalline PbSe, with grains of increasing hierarchical sizes, in order to understand and systematise the impact of morphology on heat transport. The formation of grains and boundaries typically accompanies solid–solid reactions and structural phase transitions in general. Exploiting the polymorphism of PbSe, which, from the ground-state structure rocksalt (B1), transforms into the CsCl type structure (B2) under pressure and back to B1 on releasing it, it is possible to obtain a range of metastable PbSe rocksalt structures, which contain grains bounded into domains. On varying the size of the simulated system, grain features as seen in real materials can be produced and studied in detail. While this is a useful and handy approach to modelling domains without cumbersome a priori assumptions, this step provides at the same time a direct link to its experimental realisation, based on mechanical loads or milling approaches.3,25 This way one can directly shape an eventual experimental process utilising our results and methods.
To understand how grains and grain boundaries form in PbSe, we first investigated the mechanism of the B1–B2 structural phase transition in PbSe using transition path sampling (TPS) molecular dynamics (MD).26,27 The transformation path crosses an intermediate, metastable configuration of a roughly B33 type structure (CrB/TlI).28 When pressure is released this intermediate transforms into B1. This transformation is accompanied by the formation of grains.
Subsequently, the thermal conductivity is calculated for grain-free PbSe, and for several B1 structures containing grains with varying size. This is done using equilibrium molecular dynamics, from which thermal lattice conductivity can be derived via computation of the thermal flux.29 Finally, the impact of grains on phonon mean free paths is evaluated and compared to grain-free PbSe. Discussion of the findings concludes the paper.
Results
B1–B2 phase transition in PbSe
PbSe crystallises in the rocksalt (B1) type structure of space group symmetry Fm![[3 with combining macron]](https://www.rsc.org/images/entities/char_0033_0304.gif) m. In the pressure range 9–16 GPa,28,30–33 PbSe transforms into the CsCl (B2) type; the phase transition involves metallisation (B2 is metallic). Several studies have concentrated on the prediction and detection of intermediate metastable configurations along the transformation path from B1 to B2.28,30–33 Phases of Pnma (GeS type structure, B16) and Cmcm (CrB type structure, B33) symmetries are possible intermediates along the paths. For PbSe, accurate transport and X-ray diffraction studies under pressure identify an intermediate phase of the CrB type structure at around 9.5 GPa,31 which is in agreement with theoretical predictions.33
m. In the pressure range 9–16 GPa,28,30–33 PbSe transforms into the CsCl (B2) type; the phase transition involves metallisation (B2 is metallic). Several studies have concentrated on the prediction and detection of intermediate metastable configurations along the transformation path from B1 to B2.28,30–33 Phases of Pnma (GeS type structure, B16) and Cmcm (CrB type structure, B33) symmetries are possible intermediates along the paths. For PbSe, accurate transport and X-ray diffraction studies under pressure identify an intermediate phase of the CrB type structure at around 9.5 GPa,31 which is in agreement with theoretical predictions.33
The assessment of a structural phase transition mechanism, including possible intermediates, can be approached with different strategies. The main methods make use of extended Landau theory in combination with first principles calculations,34 metadynamics,35,36 and, as the method of choice here, molecular dynamics (MD) simulations based on the Transition path sampling scheme, TPS (see the Methods section for details). This approach has been successfully used to elucidate mechanisms of several ionic (B1–B2) phase transitions, as well as other compounds and chemical elements.27,37–39 It yields very detailed transformation mechanisms as it does not artificially enforce any collective transformation. As NaCl and PbSe both transform into B2 under pressure, some of the previous experiences accumulated on the B1–B2 polymorphism are advantageously used here.40 The MD-TPS method works iteratively on a so-called first trajectory (initial path), which connects B1 to B2. The process of elucidating the true mechanism consists in repeatedly perturbing the initial path, within a Monte Carlo scheme, until the calculation is converged to the optimal path, biased by its importance. While the initial mechanism is typically concerted and collective, as it is derived from a general scheme of interpolating the intermediate configuration between two limiting structures, for instance B1 and B2 (see the Methods section for details), the converged regime is characterised by nucleation and growth. Furthermore, intermediate configurations can be visited along the path of the transformation, which can be transient configurations or appropriate metastable phases. The transition pressure for the pair potential used here is 12 GPa,41 which is within the experimental range.28,30–33 Pressure itself and the reconstructive character of the B1–B2 transition can generate grains, like those demonstrated for CdSe.27 We do not have direct experimental evidence of domain morphologies in PbSe, which would allow for a comparison of features. Nonetheless, since the same concept of overall transformation pathway convergence also includes an optimisation of the final B1 product, we trust that we are reliably representing the B1 phase after phase transformation, characterised by grain features.
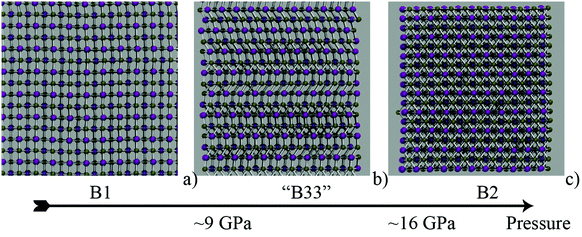
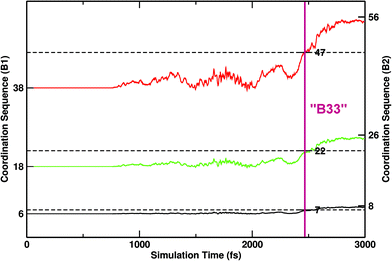
The initial B1–B2 path in PbSe was modelled similarly to how it was done for NaCl,40 which also crystallises in the same type structures and bears many common aspects with respect to its polymorphism.34 The aim of this modelling step is to obtain a first trajectory (see the Methods section for further details). The initial trajectory was iterated in MD-TPS until the mechanistic regime had converged, i.e. no departures from a particular mechanism were detectable. Three snapshots of representative initial, intermediate and final configurations are shown in Fig. 1a–c, respectively. To monitor the evolution of the calculations and of the transition, a suitable order parameter is necessary. Given the compact nature of the structures, a good choice is the first coordination sphere (fCN), which is 6 in B1 and becomes 8 in B2. To precisely identify any intermediate step, the second and third coordination spheres (sCN, tCN) were also considered.42 In Fig. 2 the progress of the three CNs is monitored as a function of the progress of the transition. Three horizontal dotted lines mark the values of the CNs, which amount to 7-22-47 for the B33 type.
The three CNs cross the threshold values for B33 quasi-synchronously, indicating that the transition is visiting an intermediate of B33 characteristics (configuration in Fig. 1b). The typical pattern of B33 is apparent (alternating square and triangular patterned layers), some parts are not fully locked-in to this pattern though. However, on average the B33 emerges as an intermediate, and can be quenched at lower pressure (∼6–9 GPa, at which B2 would not form), in accordance with experimental indications. From TPS finite temperature molecular dynamics simulations, the intermediate role of configurations related to B33 is thus confirmed, in the context of nucleation and growth of extended interfaces between regions of B1, B33 and B2 structures.
Grains and grain boundaries
The elucidation of the B1–B2 phase transition is the starting point for the construction of realistic PbSe structures with grains. Here realistic means that the grains are calculated from a particular simulation protocol, without prior knowledge or assumptions on their geometries. For this, intermediate configurations like the one of Fig. 1b are used as the starting point of further molecular dynamics calculations at normal conditions. The metastable nature of such intermediate configurations causes them to transform back into the ground state, B1. This takes place in a non-collective way though, having different regions transforming into B1 at different times and along different crystallographic directions, such that the process yields B1 PbSe with distinguishable coherent B1 zones, which are separated into grains by grain boundaries. The relaxation of the 3960 atom cell yields boundaries along two directions only. Systematically doubling the edges of the box yields more complex grain geometries, which are increasingly isotropic, i.e. none of the grains is a perfect B1 beyond a certain length (Fig. 3a). The process of enlarging the box and the resulting PbSe grain structures are shown in Fig. 3. The still rather anisotropic structure resulting from the 3960 atom box, which contains coherent and percolating B1 domains in a distinct direction (z axis), is shown in Fig. 3b.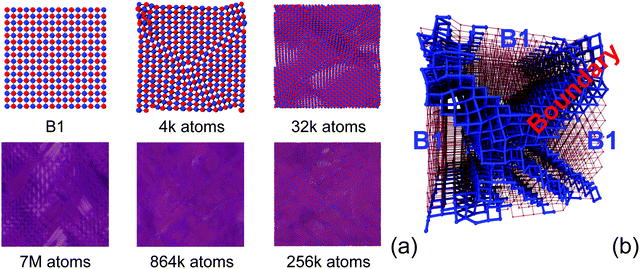 | ||
Fig. 3 (a) Morphologies of B1 grain boundaries obtained from supercell magnification of the B33 intermediate of Fig. 1 (original cell (4k, 3960 atoms), 2 × 2 × 2 (32k, 31![[thin space (1/6-em)]](https://www.rsc.org/images/entities/char_2009.gif) 680 atoms), 4 × 4 × 4 (256k, 253 680 atoms), 4 × 4 × 4 (256k, 253![[thin space (1/6-em)]](https://www.rsc.org/images/entities/char_2009.gif) 444 atoms), 6 × 6 × 6 (864k, 855 444 atoms), 6 × 6 × 6 (864k, 855![[thin space (1/6-em)]](https://www.rsc.org/images/entities/char_2009.gif) 360 atoms) and 12 × 12 × 12 (7M, 6 360 atoms) and 12 × 12 × 12 (7M, 6![[thin space (1/6-em)]](https://www.rsc.org/images/entities/char_2009.gif) 842 842![[thin space (1/6-em)]](https://www.rsc.org/images/entities/char_2009.gif) 880 atoms)), after NpT-MD calculations. (b) Detailed representation of the smallest grain obtained (4k): regions of the coherent B1 structure are separated by B1 grain boundaries. A strong anisotropy can be noticed, as B1 percolates in one direction only (red framework), normal to the plane. The structural motif of the boundaries resembles the NiAs type structure (blue regions). Pb and Se are not differentiated to emphasise structural features. 880 atoms)), after NpT-MD calculations. (b) Detailed representation of the smallest grain obtained (4k): regions of the coherent B1 structure are separated by B1 grain boundaries. A strong anisotropy can be noticed, as B1 percolates in one direction only (red framework), normal to the plane. The structural motif of the boundaries resembles the NiAs type structure (blue regions). Pb and Se are not differentiated to emphasise structural features. | ||
Thermal transport in PbSe and role of grains
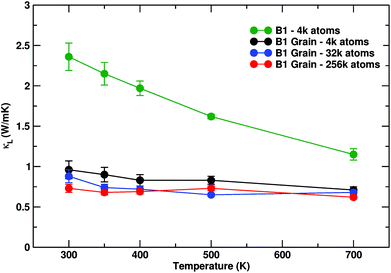
The effect of grains and grain boundaries on pure PbSe can be appreciated already at the lowest step of magnification. The evaluation of κl as a function of temperature for grain-free PbSe and for the smallest PbSe box containing grains (3960 atom box) is shown in Fig. 4. The use of classical molecular dynamics for PbSe at room and higher temperatures is justified, since the Debye temperature of PbSe does not exceed 200 K.43 For single crystalline PbSe the thermal conductivity decays as the inverse of the temperature, dropping from 2.4 W mK−1 at 300 K to ∼1.12 at 700 K as in experiments,44 since anharmonicity is the only source of scattering. Our estimate of κl over the whole temperature range is in good agreement with former first-principles calculations.18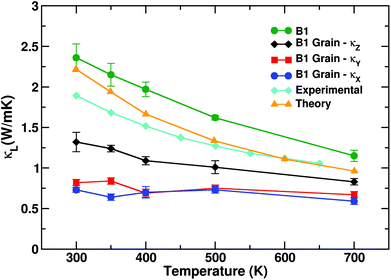 | ||
| Fig. 4 Evolution of κl as a function of temperature for feature-free PbSe, compared to the 3960 atom system of Fig. 3b. κl for the latter is resolved in its Cartesian components; κl,z displays lattice thermal conductivity values larger than κl,x and κl,y, which are the directions along which grain boundaries are crossed. The overall thermal conductivity is notably reduced with respect to pure B1, as well as the temperature dependence is nearly lost. Size effect corrections have been included. Experimental data are taken from ref. 8, Fig. 3a. Comparison with theory is based on ab initio data from ref. 18. | ||
For anisotropic systems containing grains, κl is resolved for each Cartesian component. Anisotropy strongly impacts thermal conductivity. While there is an overall dropping of κl with respect to grain-free PbSe, the z component κl,z is only partially affected. By inspection of Fig. 3b, the PbSe grains are coherently aligned and percolate along z. In turn κl,z diminishes as a function of temperature, yet to a lesser extent with respect to grain-free PbSe. The other two components κl,x and κl,y show different behaviour. Any structural path along x and y crosses grain boundaries. Both κl,x and κl,y have low values around ∼0.7 W mK−1 at 300 K (for the impact of the size effect on absolute thermal conductivity values, see below). Similar to what is observed in silicon nanomeshes,45 percolation of grains along a periodic direction leads to anisotropic thermal conduction, thus suggesting that structuring in grains can be used to finely tune the thermal conductivity of PbSe. The dependence on the temperature is appreciably reduced, showing a similar response over the whole temperature range considered, 300–700 K. Grains thus affect thermal conductivity both in terms of a reduction of κl and flattening the dependence of κl on temperature.
Thermal conductivity of PbSe with extensive grain features
In this section we assess the role of the distribution of grain size on lowering thermal conductivity. Systems comprising 4k, 32k and 256k atoms, as displayed in Fig. 3a were considered. Their sizes span two orders of magnitude, and the grain features in the larger boxes affect all three Cartesian directions in an increasingly isotropic manner. A typical size distribution is shown in Fig. 5. Grain sizes in the smallest (4k) cell are around 3 nm wide, 5 nm in the 32k one, and up to 15 nm in the largest 256k atom cell considered. Noticeable is the distribution of grain sizes as the system is rescaled: grain sizes characteristic of a smaller system are preserved in the subsequent, larger systems. To quantitatively capture this effect, the 4k and 32k systems were enlarged by replication, to match the size of the 256k system. The coordinates of all these three systems were Fourier transformed, considering Pb atoms only, for simplicity. In Fig. 6 the peak intensities are plotted as a function of the hkl vector magnitude, ||hkl||. hkl Triplets (Miller indices) describe planes in crystals, and sensibly reflect (changed) atomic arrangements. For the small 4k system, the intensity is accumulated around one main peak. For the 32k system, additional peaks appear mainly at lower hkl, signalling longer distances between planes and hence larger domains. This trend is even more pronounced in the 256k system, where peak clustering is clearly visible. Therein, the rescaling of sizes is apparent if a series of hkl are considered (Fig. 6, inset), like for example h = [30–40], k = [0, 1, 2, 3, 4,…], l = 40, and the “cubic” permutations thereof. The centres of the cluster regions can be matched by such a series, which nicely illustrates the progressive and hierarchical growth of domains as a function of size.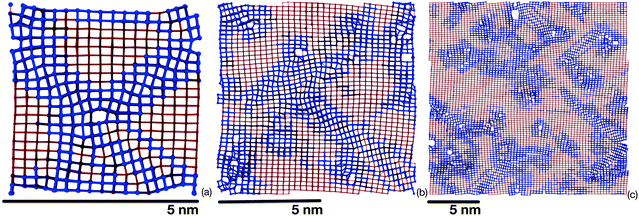 | ||
| Fig. 5 Grain size distributions for 4k, 32k and 256k atom systems. Regions of the coherent B1 structure of increasing size are separated by grain boundaries. Using the black bar below each snapshot as the reference length (5 nm), the largest grain size in (a) is around 3 nm, in (b) it is in the order of 5 nm, while in (c) grains as large as 15 nm can be observed. Importantly, sizes typical of the previous cell size are still contained in the larger, subsequent one. B1 grains are red coloured, while grain boundaries are blue. Contrary to grain size, grain boundary widths do not grow noticeably larger, comprising 5 layers on average. The distinction between coherent B1 regions and boundaries is based on the coordination sequence.42 | ||
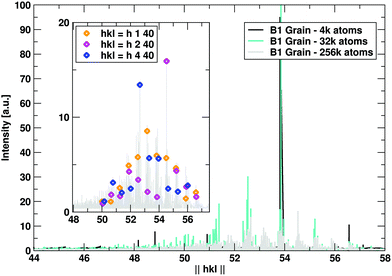 | ||
| Fig. 6 Fourier transformation of the 4k, 32k and 256k atom systems of Fig. 5, only Pb positions were considered for simplicity. Main plot: hkl values were chosen in the range [−40–40] in each direction. A peak clustering is apparent as a function of the number of atoms in the system, while domain size increases (shorter hkl vector modules, ||hkl||). Inset: Fourier peaks of the 256k atom system. Their sequence is matched by series of hkl vectors like indicated, 30 ≤ h ≤ 40. | ||
We computed κl by equilibrium molecular dynamics as described in the Methods section. However, comparing thermal conductivity over disparate scales can be flawed due to size effects. For instance, small simulation boxes lead to an underestimation of κl due to the poor sampling of the low frequency phonon branches. To correct for this effect, for each size, κl was rescaled to the value of κl of a corresponding system of the same size (see the Methods section for details). For a small system of 4k atoms the difference amounts to 0.3 W mK−1. In a 32k atom system it is reduced to less than 0.03 W mK−1, while for 256k atoms the numerical values converge.
Thermal conductivities as a function of size and temperature are shown in Fig. 7. The three sizes are distinguished by different colours. The general trend is one of continuous decrease of thermal conductivity towards a lower limit of approximately 0.72 W mK−1 for the largest system considered, at 300 K. The impact of the different distribution of grain sizes is reflected on progressive curve flattening and downshifting, which is less pronounced but still appreciable as the cell size is increased. Furthermore, the anisotropy of κl observed in the 4k system vanished. While we expect a further lowering of the absolute value of κl by further increasing size, only fractional corrections of the top-scoring value for the 256k atoms grain can be expected. Even more than the achievement of the lowest κl values, it is worth noting the vanishing dependence of κl on temperature, which indicates that all the relevant heat carriers undergo significant grain boundary scattering.
Lifetimes, group velocities and size effects
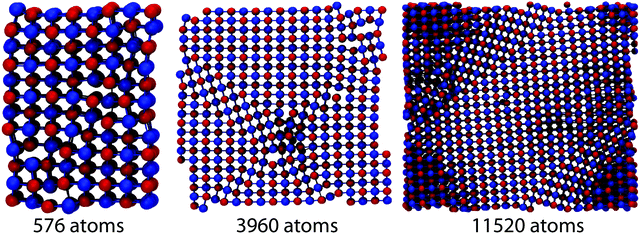
A detailed understanding of the impact of grains on phonon scattering is gained from evaluating phonon lifetimes and group velocities (see the Methods section). Alloys and nanoparticle embedding typically influence short-to-mid wavelength phonons, while lower frequencies are more difficult to affect in a systematic way.17,46 In the previous section we have shown that lattice thermal conductivity decreases as the distribution of the size of grains gets broader and their morphology more complex, as a consequence of hierarchical nanostructuring. Since allocation of the dynamic matrix Ω rapidly limits the maximal attainable system size, the largest systems presented in the previous section could not be studied in such detail. To reproduce a similar size progression through two orders of magnitude, systems of 576, 3960, 11![[thin space (1/6-em)]](https://www.rsc.org/images/entities/char_2009.gif) 520 atoms were prepared. The structures considered are shown in Fig. 8. The 576 and 3960 exhibit percolating grains in a periodic direction (z) and therefore κl anisotropy. As previously discussed, using larger simulation boxes causes grain structuring over several length scales. Smaller systems show rather sharp, regular boundaries between differently oriented regions of the B1 structure. The 3960 atom system displays domain boundaries which are mirror planes (coherent grain boundaries), while the largest system considered in this section – 11
520 atoms were prepared. The structures considered are shown in Fig. 8. The 576 and 3960 exhibit percolating grains in a periodic direction (z) and therefore κl anisotropy. As previously discussed, using larger simulation boxes causes grain structuring over several length scales. Smaller systems show rather sharp, regular boundaries between differently oriented regions of the B1 structure. The 3960 atom system displays domain boundaries which are mirror planes (coherent grain boundaries), while the largest system considered in this section – 11![[thin space (1/6-em)]](https://www.rsc.org/images/entities/char_2009.gif) 520 atoms – contains irregular grains of general orientation (incoherent grain boundaries) with a broader size distribution. This geometric variety implies pronounced differences in lifetimes and group velocities. Fig. 9(a–c) present a comparison among the group velocities and the lifetimes of these three systems and of a B1 crystal.
520 atoms – contains irregular grains of general orientation (incoherent grain boundaries) with a broader size distribution. This geometric variety implies pronounced differences in lifetimes and group velocities. Fig. 9(a–c) present a comparison among the group velocities and the lifetimes of these three systems and of a B1 crystal.
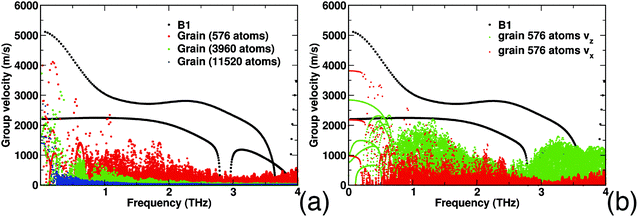
We show results for phonons in the frequency range up to 4 THz, which provide the main contribution to κl. This range of frequencies encompasses all the acoustic branches and the lowest optical branches of the B1 structure. The x component of the group velocities as a function of frequency, calculated on mesh q-points along the Γ–X direction is reported in Fig. 9(a). The plot shows the group velocities of the two degenerate TA modes and the LA mode (black dots) of the pristine B1 crystal. Their value is in good agreement with the ab initio calculations by Tian et al.18 In turn, we must point out that the optical modes with our empirical potential reach up to about 7 THz (not shown), thus exceeding the ab initio frequency range. Such a difference may also affect the scattering rates, thus leading to small discrepancies in the lifetimes of acoustic modes.
The presence of grains deeply affects the group velocities: we observe a softening of the acoustic modes at low frequency that becomes more important the larger the size of the grains, suggesting a softer mechanical response of the larger hierarchical structures. In addition the systems of 3960 and 11![[thin space (1/6-em)]](https://www.rsc.org/images/entities/char_2009.gif) 520 atoms exhibit vanishing group velocities beyond a decreasing frequency threshold of ∼1.5 and ∼0.8 THz, indicating flattening of the dispersion relations and the non-conducting character of the vibrational modes. Although the contribution to heat transport from phonons beyond this threshold is drastically reduced and mean free paths cannot be defined, these modes can still conduct heat through the “diffusion” mechanism proposed for amorphous silicon by Allen and Feldman.47 In amorphous silicon this alternative mechanism accounts for about half the total κl.48
520 atoms exhibit vanishing group velocities beyond a decreasing frequency threshold of ∼1.5 and ∼0.8 THz, indicating flattening of the dispersion relations and the non-conducting character of the vibrational modes. Although the contribution to heat transport from phonons beyond this threshold is drastically reduced and mean free paths cannot be defined, these modes can still conduct heat through the “diffusion” mechanism proposed for amorphous silicon by Allen and Feldman.47 In amorphous silicon this alternative mechanism accounts for about half the total κl.48
Fig. 9(b) provides a comparison of the x and z components of the group velocities in an anisotropic structure, with grain boundaries breaking only the xy plane. This structure displays anisotropic thermal conductivity, similar to the one showcased in Fig. 4. The figure shows the anisotropy in the group velocities: on the one hand acoustic modes at low frequency have smaller group velocities for propagating in the xy plane than along z. On the other hand for frequencies larger than 0.7 THz, group velocities are much larger for propagation in the z direction, thus leading to an overall larger κl.
Finally, Fig. 10 shows the effect of hierarchical structuring on phonon lifetimes. In the low frequency range (<1 THz) the dependence of lifetimes on frequency for pure B1 is τ ∝ ω−2 (Fig. 10, blue), as expected for a crystalline solid, in which three-phonon scattering dominates. The lifetimes of the acoustic modes are in the same range as those computed by Tian et al.18e.g. at 0.2 THz τ ∼ 102 ps. The lifetimes of the acoustic modes are largely reduced by the presence of grain boundaries. In the region between 1 and 3 THz the dependence of τ on frequency is substantially flat, with values below 5 ps, and the larger system exhibiting slightly lower values than the smaller. While extended grain features (11![[thin space (1/6-em)]](https://www.rsc.org/images/entities/char_2009.gif) 520 atoms grain) more pronouncedly affect the lowest optical frequency range from 3 to 4 THz, there is less of a strong signature of hierarchical grain features on lifetimes, compared to phonon group velocities.
520 atoms grain) more pronouncedly affect the lowest optical frequency range from 3 to 4 THz, there is less of a strong signature of hierarchical grain features on lifetimes, compared to phonon group velocities.
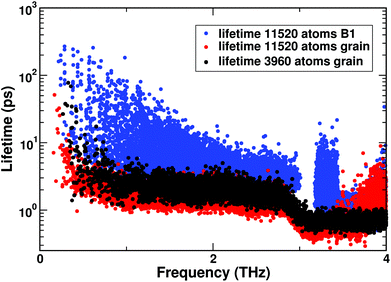 | ||
Fig. 10 Lifetimes of the vibrational modes for pure B1, compared with grains of 3960 and 11![[thin space (1/6-em)]](https://www.rsc.org/images/entities/char_2009.gif) 520 atoms. 520 atoms. | ||
The observed major reduction of phonon group velocities, supplemented by a less dramatic reduction of lifetimes, leads to the systematic decrease of thermal conductivities in polycrystalline PbSe. A broad distribution of grain sizes is essential to lower the contribution to κl across the whole spectrum of relevant frequencies, including modes in the order of 0.5 THz and below. The overall reduction κl is however limited by the occurrence of non-propagative mechanisms of heat transport that involve vibrational modes with group velocity approaching zero.
While alloying and nano-inclusions are workable approaches, hierarchical grains introduce features that scale with size. Our findings support the interpretation of recent experiments, pinpointing the relevance of internal interfaces to scatter phonons with wavelengths that span over several length scales, towards the mesoscale effects on thermoelectrics.19 In this work however, the chemistry was kept constant, i.e. only morphology changes were considered in PbSe, for a detailed analysis and understanding of the impact of grains.
Conclusions
Grains are rather unwelcome in semiconductor technologies. In contrast, when it comes to suggesting a different perspective for improved thermoelectric performance, grains are superior phonon scatterers. In this work, by means of molecular dynamics techniques, we proposed an approach to systematically engineer hierarchical grains in B1 PbSe and we evaluated their impact on κl. Grains allow for a broader frequency range of phonon scattering, including frequencies below ∼1 THz, which are hardly attainable by any other nano-engineering approach. Furthermore, grains and grain boundaries are features that scale with size. Therefore, a larger, isotropic impact can be expected, as demonstrated in this work. Recent experiments show that ball-milled PbSe retains a high power factor.25 In addition, it has been proposed that increased power factor may be achieved in polycrystalline materials through electron filtering at grain boundaries.3 While we have concentrated our study on isolating grain effects as a result of purely structural features, additional ingredients can be added to further improve properties, like nano-inclusions within large grains, and alloying, locally or over the whole crystal. Furthermore, in coherently aligned grains like in Fig. 3 electrical properties can be expected to remain largely unaffected, therefore facilitating the preservation of a high overall electronic power factor in the presence of extended grain features. However, the study of the effect of grain boundaries on electronic transport in PbSe would deserve a separate study.Methods
Transition path sampling molecular dynamics
Transition path sampling26 molecular dynamics (TPS-MD) iterations within the NpT ensemble were implemented by applying momentum modifications on selected trajectory snapshots, keeping total energy, momentum, and angular momentum unchanged. Propagating the new configuration in both directions in time provides a new trajectory that is examined for the B1 → B2 → B1 process, respectively. Iterations are performed until trajectory convergence (characterised by stable mechanistic features) is reached. The simulation scheme requires a model trajectory connecting the limiting structures. Here, we have commenced the simulation from a path connecting B1 to B2, obtained from a geometric-topological approach, based on transforming minimal surfaces.40 The classical MD simulations were carried out by using the DLPOLY package.49 The Newton's equations of motion were integrated with the Velocity Verlet algorithm. The PbSe pair potential of Schapotschnikow et al. was used.41 Periodic boundary conditions are applied. Particle-mesh Ewald summation was used for long-range electrostatics. A relatively small simulation time step of 0.10 fs was used to ensure a good time-reversibility. The Melchionna/Nose–Hoover algorithm50 ensured constant pressure and temperature. As such, anisotropic shape changes of the simulation box were allowed. Several simulations were performed in the range 9–16 GPa, at 300 K, with a box of 1980 PbSe pairs. At 300 K, the lattice constant of B1 PbSe amounted to 6.1 Å.41 In the course of iterations, the collective characteristics of the geometric model disappeared, and a regime characterised by nucleation and growth set in. Additionally, an intermediate appeared in the converged regime, which was not apparent from the geometric model. More than 300 transition pathways were collected after trajectory convergence. Fig. 1 was produced based on a typical trajectory collected in the converged regime.Grain, grain boundaries and heat flux
The intermediate structure of Fig. 1b was iteratively relaxed using the conjugated gradient method (p = 1 kbar, T = 0 K). This unit of 3690 atoms of B33 structural characteristics, inherited from TPS-MD, served as the starting point for generating PbSe with grains. For each desired size, the unit was enlarged by periodic replicas. Magnification factors of 2 × 2 × 2, 4 × 4 × 4, 6 × 6 × 6 and 12 × 12 × 12 were chosen, corresponding to 31![[thin space (1/6-em)]](https://www.rsc.org/images/entities/char_2009.gif) 680, 253
680, 253![[thin space (1/6-em)]](https://www.rsc.org/images/entities/char_2009.gif) 444, 855
444, 855![[thin space (1/6-em)]](https://www.rsc.org/images/entities/char_2009.gif) 360, 6
360, 6![[thin space (1/6-em)]](https://www.rsc.org/images/entities/char_2009.gif) 842
842![[thin space (1/6-em)]](https://www.rsc.org/images/entities/char_2009.gif) 880 atom boxes, respectively. Each structure was propagated at p = 1 kbar and T = 300 K (NpT anisotropic ensemble) until the averaged structural parameters were stable. A typical run was at least 400 ps long, depending on the size. For every grain box size (up to 253
880 atom boxes, respectively. Each structure was propagated at p = 1 kbar and T = 300 K (NpT anisotropic ensemble) until the averaged structural parameters were stable. A typical run was at least 400 ps long, depending on the size. For every grain box size (up to 253![[thin space (1/6-em)]](https://www.rsc.org/images/entities/char_2009.gif) 444 atoms), a corresponding MD of grain-free PbSe was also prepared, obtained by periodically replicating the unit cell. This was used to evaluate the influence of the finite box size on the value of κl, see below for details. MD calculations and heat flux calculations were performed with LAMMPS.51 Interatomic potential, integration algorithm and time step were the same as for TPS calculations.
444 atoms), a corresponding MD of grain-free PbSe was also prepared, obtained by periodically replicating the unit cell. This was used to evaluate the influence of the finite box size on the value of κl, see below for details. MD calculations and heat flux calculations were performed with LAMMPS.51 Interatomic potential, integration algorithm and time step were the same as for TPS calculations.
Lattice thermal conductivity
The lattice thermal conductivity κl was calculated using the Green–Kubo relation based on the fluctuation–dissipation theorem:52 kb is the Boltzmann constant, V is the volume of the system, T is the temperature and
  is the heat current autocorrelation function averaged over three directions. The heat current vector for a pair potential is defined as:53
 . εi and vi are the total energy and velocity associated with atom i, respectively. Vector rij denotes interatomic distances between atoms i and j, and Fij interatomic forces.
Size-dependence effects were investigated. This is necessary as a small simulation box may affect the computed value of the thermal conductivity. For semiconductors this is of relevance as low frequency phonons may have long mean free paths. To correct for this effect, for B1 systems with grain features we considered 2 × 2 × 2 (32k atoms) and 4 × 4 × 4 (256 atoms) supercells, obtained by replicating the smallest grain system of 4k atoms. The κl difference between the 2 × 2 × 2 replica 32k atom system, and the 4k atom system amounted to 0.3 W mK−1, while between the 2 × 2 × 2 and the largest 256k atom system the difference was reduced to less than 0.03 W nK−1. Accordingly, κl was rescaled for both the 4k and 32k atom systems to match the 256k system. Size effects were also considered for the bulk B1 phase: at 300 K the values of κl were the same within error bars for all the 4k, 32k and 256k atom systems considered. This shows how size effects in equilibrium MD simulations are not related to long mean free paths but rather to sampling sufficiently low frequency phonons, which usually have a wavelength shorter than the relevant mean free paths. For anisotropic systems containing grains, κl was resolved for each Cartesian component.
Group velocities and lifetimes
The dynamical matrix Ω was obtained in lattice dynamic calculations, computing derivatives of forces acting on atoms as finite differences. The matrix was computed and diagonalized in order to obtain eigenvectors e and eigenvalues ω2 at the Γ-point ( ) of the Brillouin zone relative to the supercells.
Since the group velocities,  , at the Γ-point of a supercell are exactly zero, except for the 3 acoustic branches, there is no general consensus on how to evaluate the group velocities of non-periodic systems, and several effective approaches have been tested for amorphous systems or alloys.45,54,55 Here we exploit the fact that periodic boundary conditions are applied, and we calculate
  for a set of q-points on a 2 × 2 × 2 shifted Monkhorst–Pack mesh. We then define effective group velocities as a function of the frequencies,
  , as the average of
  over a range between ω − δω and ω + δω with δω = 0.006 THz.
From the normalized autocorrelation function of the energies of each eigenmode lifetimes were calculated:  , where
  , and
, and  . S′ is the derivative of S, and uj is the displacement of atom j in MD trajectories. Once all these contributions are available, further calculations of the effective mean free path (MFP) are straightforward.45 For a certain mode i, the MFP is given by λi = νiτi.
Fourier analysis
All three systems containing grains (Fig. 5) were Fourier transformed, considering Pb atoms only. Structure factors Fhkl were evaluated according to the formula: ,
,  ,
,  . Therein,
  is a reciprocal space vector and
  is a coordinate of a crystal structure of N atoms. The peak intensity for a hkl index is calculated as the modulus of the vector,
  . The factor fi accounts for the scattering due to electrons. Since the value distribution of Fhkl depends on the crystal structure, delta functions centred on each atom were used. hkl Values were chosen in the range −40 ≤ h,k,l ≤ 40. This choice ensures that the highest peak intensities are accounted for.
Acknowledgements
D. S. and S. L. thank the DFG for support under the priority project SPP 1415, as well as ZIH Dresden for the generous allocation of computational resources. S. L. thanks the DFG for support in the form of a Heisenberg Fellowship. Via our membership of the UK's HPC Materials Chemistry Consortium, which is funded by EPSRC (EP/L000202), this work made use of the facilities of ARCHER, the UK's National High-Performance Computing Service, which is funded by the Office of Science and Technology through EPSRC's High End Computing Programme. We thank Dr Min Gao, Cardiff for insightful discussions. We are thankful to Samuel Jobbins for critically reading the manuscript.References
- G. J. Snyder and E. S. Toberer, Nat. Mater., 2008, 7, 105 CrossRef CAS PubMed.
- G. Chen, M. S. Dresselhaus, G. Dresselhaus, J. P. Fleurial and T. Caillat, Int. Mater. Rev., 2003, 48, 45–66 CrossRef CAS.
- J. R. Sootsman, D.-Y. Chung and M. G. Kanatzidis, Angew. Chem., Int. Ed. Engl., 2009, 48, 8616–8639 CrossRef CAS PubMed.
- D. M. Rowe, Handbook of Thermoelectrics: Macro to Nano, CRC Press, Boca Raton, 2005 Search PubMed.
- M. Zebarjadi, K. Esfarjani, M. S. Dresselhaus, Z. F. Ren and G. Chen, Energy Environ. Sci., 2012, 5, 5147–5162 Search PubMed.
- K. Biswas, J. He, Q. Zhang, G. Wang, C. Uher, V. P. Dravid and M. G. Kanatzidis, Nat. Chem., 2011, 3, 160 CrossRef CAS PubMed.
- T. C. Harman, P. J. Taylor, M. P. Walsh and B. E. LaForge, Science, 2002, 297, 2229 CrossRef CAS PubMed.
- J. He, L.-D. Zhao, J.-C. Zheng, J. W. Doak, H. Wu, H.-Q. Wang, Y. Lee, C. Wolverton, M. G. Kanatzidis and V. P. Dravid, J. Am. Chem. Soc., 2013, 135, 4624 CrossRef CAS.
- H. Wang, Y. Pei, A. D. LaLonde and G. J. Snyder, Adv. Mater., 2011, 23, 1366–1370 CrossRef CAS PubMed.
- J. Androulakis, C. Lin, H. Kong, C. Uher, C. Wu, T. Hogan, B. A. Cook, T. Caillat, K. M. Paraskevopoulos and M. G. Kanatzidis, J. Am. Chem. Soc., 2007, 129, 9780 CrossRef CAS PubMed.
- P. F. P. Poudeu, J. D'Angelo, H. Kong, A. Downey, J. L. Short, R. Pcionek, T. P. Hogan, C. Uher and M. G. Kanatzidis, J. Am. Chem. Soc., 2006, 128, 14347 CrossRef CAS PubMed.
- Z. Wang, J. E. Alaniz, W. Jang, J. E. Garay and C. Dames, Nano Lett., 2011, 11, 2206–2213 CrossRef CAS PubMed.
- C. Hua and A. J. Minnich, Semicond. Sci. Technol., 2014, 29, 124004 CrossRef.
- C. Melis and L. Colombo, Phys. Rev. Lett., 2014, 112, 065901 CrossRef PubMed.
- K. T. Regner, D. P. Sellan, Z. Su, C. H. Amon, A. J. H. McGaughey and J. A. Malen, Nat. Commun., 2013, 4, 1640 CrossRef PubMed.
- Y. He, D. Donadio and G. Galli, Nano Lett., 2011, 11, 3608–3611 CrossRef CAS PubMed.
- J. Garg, N. Bonini, B. Kozinsky and N. Marzari, Phys. Rev. Lett., 2011, 106, 045901 CrossRef PubMed.
- Z. T. Tian, J. Garg, K. Esfarjani, T. Shinga, J. Shiomi and G. Chen, Phys. Rev. B: Condens. Matter, 2012, 85, 184303 CrossRef.
- K. Biswas, J. He, I. D. Blum, C.-I. Wu, T. P. Hogan, D. N. Seidman, V. P. Dravid and M. G. Kanatzidis, Nature, 2012, 489, 414 CrossRef CAS PubMed.
- L. D. Zhao, H. J. Wu, S. Q. Hao, C. I. Wu, X. Y. Zhou, K. Biswas, J. Q. He, T. P. Hogan, C. Uher, C. Wolverton, V. P. Dravid and M. G. Kanatzidis, Energy Environ. Sci., 2013, 6, 3346–3355 CAS.
- D. Wolf, V. Yamakov, S. R. Phillpot, A. Mukherjee and H. Gleiter, Acta Mater., 2005, 53, 1–40 CrossRef CAS.
- A. Bodapati, P. K. Schelling, S. R. Phillpot and P. Keblinski, Phys. Rev. B: Condens. Matter, 2006, 74, 245207 CrossRef.
- P. Keblinski, S. R. Phillpot, D. Wolf and H. Gleiter, Acta Mater., 1997, 45, 987–998 CrossRef CAS.
- J. He, M. G. Kanatzidis and V. P. Dravid, Mater. Today, 2013, 16, 166–176 CrossRef CAS.
- Q. Zhang, H. Wang, W. Liu, H. Wang, B. Yu, Q. Zhang, Z. Tian, G. Ni, S. Lee, K. Esfarjani, G. Chen and Z. Ren, Energy Environ. Sci., 2012, 5, 5246–5251 CAS.
- P. G. Bolhuis, D. Chandler, C. Dellago and P. L. Geissler, Annu. Rev. Phys. Chem., 2002, 53, 291 CrossRef CAS PubMed.
- S. Leoni, R. Ramlau, K. Meier, M. Schmidt and U. Schwarz, Proc. Natl. Acad. Sci. U. S. A., 2008, 105, 19612 CrossRef CAS PubMed.
- F. Demiray and S. Berber, Phys. Scr., 2013, 88, 015603 CrossRef.
- R. Zwanzig, Annu. Rev. Phys. Chem., 1965, 16, 67 CrossRef CAS.
- T. Chattopadhyay, A. Werner and H. G. von Schnering, Rev. Phys. Appl., 1984, 19, 807 CrossRef CAS.
- S. V. Ovsyannikov, V. V. Shchennikov, A. Y. Manakov, A. Y. Likhacheva, Y. S. Ponosov, V. E. Mogilenskikh, A. P. Vokhmyanin, A. I. Ancharov and E. P. Skipetrov, Phys. Status Solidi B, 2009, 246, 615 CrossRef CAS.
- M. Baleva, E. Mateeva and E. P. Trifonova, J. Mater. Sci., 1999, 34, 795–799 CrossRef CAS.
- R. Ahuja, Phys. Status Solidi B, 2003, 235, 341–347 CrossRef CAS.
- H. T. Stokes, D. M. Hatch, J. J. Dong and J. P. Lewis, Phys. Rev. B: Condens. Matter, 2004, 69, 174111 CrossRef.
- R. Martoňák, A. Laio and M. Parrinello, Phys. Rev. Lett., 2003, 90, 075503 CrossRef PubMed.
- R. Martoňák, D. Donadio, A. R. Oganov and M. Parrinello, Nat. Mater., 2006, 5, 623 CrossRef PubMed.
- D. Zahn and S. Leoni, Phys. Rev. Lett., 2004, 92, 250201 CrossRef PubMed.
- S. Leoni and S. E. Boulfelfel, Modern Methods of Crystal Structure Prediction, ed. A. R. Oganov, Wiley-VCH, Berlin, 2011, pp. 181–221 Search PubMed.
- S. Leoni, Chem. – Eur. J., 2007, 13, 10022 CrossRef CAS PubMed.
- S. Leoni and D. Zahn, Z. Kristallogr., 2004, 219, 339 CAS.
- P. Schapotschnikow, M. A. van Huis, H. W. Zandbergen, D. Vanmaekelbergh and T. J. H. Vlugt, Nano Lett., 2010, 10, 3966 CrossRef CAS PubMed.
- V. A. Blatov, IUCr CompComm Newsletter, 2006, 7, 4 Search PubMed.
- K. S. Upadhyaya, M. Yadav and G. K. Upadhyaya, Phys. Status Solidi B, 2002, 229, 1129–1138 CrossRef CAS.
- J. Androulakis, D.-Y. Chung, X. Su, L. Zhang, C. Uher, T. C. Hasapis, E. Hatzikraniotis, K. M. Paraskevopoulos and M. G. Kanatzidis, Phys. Rev. B: Condens. Matter, 2011, 84, 155207 CrossRef.
- Y. He, D. Donadio, J.-H. Lee, J. C. Grossman and G. Galli, ACS Nano, 2011, 5, 1839 CrossRef CAS PubMed.
- J. Garg, N. Bonini and N. Marzari, Nano Lett., 2011, 11, 5135–5141 CrossRef CAS PubMed.
- P. B. Allen and J. L. Feldman, Phys. Rev. B: Condens. Matter, 1993, 48, 12581–12588 CrossRef CAS.
- Y. He, D. Donadio and G. Galli, Appl. Phys. Lett., 2011, 98, 144101 CrossRef.
- W. Smith and T. R. Forester, J. Mol. Graphics, 1996, 14, 136 CrossRef CAS PubMed.
- S. Melchionna, G. Ciccotti and B. L. Holian, Mol. Phys., 1993, 78, 533 CrossRef CAS.
- S. J. Plimpton, J. Comp. Physiol., 1995, 117, 1 CAS.
- D. A. McQuarrie, Statistical Mechanics, University Science Books, Sausalito, CA, 2000, p. 642 Search PubMed.
- G. Green, Y. Cho, J. Hartnett and A. Bar-Cohen, Advances in Heat Transfer, Elsevier, New York, 2006, p. 212 Search PubMed.
- J. M. Larkin and A. J. H. McGaughey, J. Appl. Phys., 2013, 114, 023507 CrossRef.
- J. M. Larkin and A. J. H. McGaughey, Phys. Rev. B: Condens. Matter, 2014, 89, 144303 CrossRef.
| This journal is © The Royal Society of Chemistry 2016 |

