
 Open Access Article
 This Open Access Article is licensed under a
 Creative Commons Attribution 3.0 Unported Licence
Fabrication of a label-free electrochemical immunosensor using a redox active ferrocenyl dendrimer
Sudeshna
Chandra
*a,
Christian
Gäbler
b,
Christian
Schliebe
b,
Heinrich
Lang
b and
Dhirendra
Bahadur
c
aDepartment of Chemistry, Sunandan Divatia School of Science, NMIMS University, Vile Parle (West) Mumbai-400056, India. E-mail: sudeshna.chandra@nmims.edu; Tel: +91 22-42199956
bTechnische Universität Chemnitz, Faculty of Natural Sciences, Institute of Chemistry, Inorganic Chemistry, 09107 Chemnitz, Germany
cDepartment of Metallurgical Engineering and Material Science, Indian Institute of Technology Bombay, Mumbai-400076, India
First published on 31st August 2016
Abstract
We report an IgG (=immunoglobulin) electrochemical immunosensor using a newly synthesized redox-active ferrocenyl dendrimer of generation 2 (G2Fc) as a voltammetric transducer. The ferrocenyl dendrimer N(CH2CH2C(O)NHCH2CH2NHC(O)Fe(η5-C5H4)(η5-C5H5))(CH2CH2N(CH2CH2C(O)NHCH2CH2NHC(O)Fe(η5-C5H4)(η5-C5H5))2)2 (G2Fc) was used as a functional moiety to immobilize the antibody on the surface of the electrode. A sandwich immunosensor of the type IgG/Bovine serum albumin (BSA)/anti-IgG/G2Fc/glassy carbon electrode (GCE) was fabricated. The electrochemical properties of G2Fc were thoroughly studied in aqueous and non-aqueous electrolytes with varying scan rates. The incubation time was optimized for better analytical performance of the immunosensor. It is found that the developed amperometric immunosensor is sensitive to a concentration of IgG as low as 2 ng mL−1.
Introduction
Electro-active dendrimers containing multiple redox units have generated great interest for their use as electrode modifiers for the development of biosensors.1 A wide variety of dendrimers have been fabricated with centrally and peripherally located redox-active units. For example, dendrimers functionalized with ferrocenyl end-grafted building blocks and their derivatives have shown promising results.2 Ferrocenes are capable of transferring multiple numbers of electrons under the same potential, and therefore, exhibit stable reversible redox properties. In ferrocenyl functionalized dendrimers, the redox centers are usually separated from one another, and therefore, show negligible electrostatic effects.3 Recently, it was shown that even for a 14![[thin space (1/6-em)]](https://www.rsc.org/images/entities/char_2009.gif) 000 ferrocenyl bearing dendrimer, no electrostatic effects were observed.4 However, in small rigid dendrimers, there can be some electrostatic effects seen between the ferrocenyl end-grafted moieties due to a short inter-site distance between the terminal groups.5,6 In such cases, the cyclic voltammogram wave is fragmented into smaller ones indicating multiple step electron transfer processes. The electron transfer between redox-active dendrimers and a variety of other biomolecules plays a key role in promising applications in, for example, the area of bio-sensors.7
000 ferrocenyl bearing dendrimer, no electrostatic effects were observed.4 However, in small rigid dendrimers, there can be some electrostatic effects seen between the ferrocenyl end-grafted moieties due to a short inter-site distance between the terminal groups.5,6 In such cases, the cyclic voltammogram wave is fragmented into smaller ones indicating multiple step electron transfer processes. The electron transfer between redox-active dendrimers and a variety of other biomolecules plays a key role in promising applications in, for example, the area of bio-sensors.7
Cancer biomarkers are molecules, generally proteins, that are over-expressed in cancer cells and whose measurement or identification plays an important role in the diagnosis of cancer.8 These biomarkers of cancer encompass physical symptoms, mutated DNAs and RNAs, secreted proteins and serum levels. Therefore, the detection of cancer biomarkers at an early stage can provide crucial information for foundational research of life sciences, clinical diagnosis and prevention of disease. Elevated concentration of biomarkers in body fluid is an early indication of some type of cancerous disease and among all the biomarkers, IgG are the most common and extensively used clinical cancer biomarkers for several carcinomas like human cervical, breast, liver, colon and lung cancer.9 All these carcinomas produce IgG in both cytoplasmic and secreted forms. The most important goal of a cancer biomarker is the detection of the smallest number of tumor cells in human fluid.8,10 Thus, to realize the potentiality of biomarkers in diagnosis, novel bioanalytical techniques must be developed with improved accuracy and sensitivity.
A sandwich immunosensor is a major analytical technique that can be used for the sensitive and selective detection of cancer biomarkers. However, there are only a handful of studies available on this topic.11 Electrochemical immunosensors are fabricated by immobilizing the antigen–antibody on the surface of the electrode transducer and the conventional methods are physical adsorption, covalent binding and polymer entrapment.12 Qiao et al.13 reported a change in the electrochemical signal i.e., a decrease in the redox peak intensity upon the adsorption of an antibody on the electrodes due to its non-electrochemical activity which partially blocked the electron transfer between the electrode and [Fe(CN)6]3−/4. After the antigen–antibody reaction, a further decrease of the redox peaks was observed. Thus, there is a change in the electrochemical signal. The analyte is measured through the detection of electrochemical signals produced due to antigen–antibody reactions.13 Electrochemical immunosensors are known for fast and sensitive analysis, are inexpensive and involve no prior sample pre-treatment. Electrochemical amperometric immunosensors are even more promising because they can achieve a very low detection limit with high sensitivity. Amperometry is gaining attention due to its role in the development of immunosensors and therefore a novel immobilization technique with enhanced sensitivity and selectivity with less response time is of considerable interest.14
A number of electroactive materials have been investigated as signaling species like metal nanoparticles and quantum dots.15–18 Various electroactive materials, transducer techniques and their response to different cancer biomarkers are summarized in Table 1. An amperometric immune-sensor based on gold nanoparticles was reported by Liang and Mu in which the nanoparticles were used to modify the electrodes for the determination of paraoxon, a carcinoembryonic antigen and interleukin-6.19 Wu et al.20 reported on the use of electrochemical biosensors based on gold nanoparticles/polylactide nanocomposites for sensitive recognition of leukemia K562 cells.
| Sl. no. | Sensing materials | Techniques | Cells/cancer markers | Sensitivity/response | Ref. |
|---|---|---|---|---|---|
| 1 | TiO2/CNT | CV | Leukemia | Not mentioned | 16 |
| 2 | Fe3O4/PB | DPV | IgG | 5 nM | 15 |
| 3 | Nano-Au/NiHCF Nanoparticles | CV | CEA | 0.1 ng mL−1 | 14 |
| 4 | Au/polylactide nanocomposites | EIS | Leukemia | 800 cells per mL | 20 |
| 5 | Graphene/Au NPs | EIS | α-Fetoprotein | 0.1 ng mL−1 | 34 |
| 6 | Chitosan/Au NPs | Amperometry | CEA | 0.08 ng mL−1 | 46 |
| 7 | CdFe2O4–SiO2 | Amperometry | IgG | 0.18 μg mL−1 | 12 |
| 8 | PAMAM dendrimer | QCM | Human IgG | 7 nM | 21 |
| 9 | AuNPs/PAMAM | DPV | PSA | 0.5 ng mL−1 | 22 |
Among various signaling species,23 dendrimers are recognized as promising candidates for bioconjugation for the construction of electrochemical biosensors.24 Highly branched dendrimers provide structural homogeneity, controlled composition, comparable size to biomolecules, internal porosity and multiple functional groups for conjugation reactions.25 Further, the end-grafted groups can be synthetically manipulated for obtaining a desired structure according to the functional requirement. To this end, the surface of polyamidoamine (PAMAM)-dendrimers can be modified with redox-active ferrocenyl building blocks to obtain well-structured end-grafted ferrocenyl dendrimers that can be used as signaling species for fabricating electrochemical biosensors.24 The ferrocenyl units are multiple and electrochemically equivalent redox units and can act as an electron “pool”, and both Fe(II) and Fe(III) forms are stable on the electrochemical time scale. The ferrocenyl-terminated PAMAM (Fc) dendrimer is capable of transferring multiple numbers of electrons under the same applied potential. In this way, redox-active dendrimers can be used for dual purposes: one for building a film over the electrode and the other for immobilizing biomolecules for sensing.25
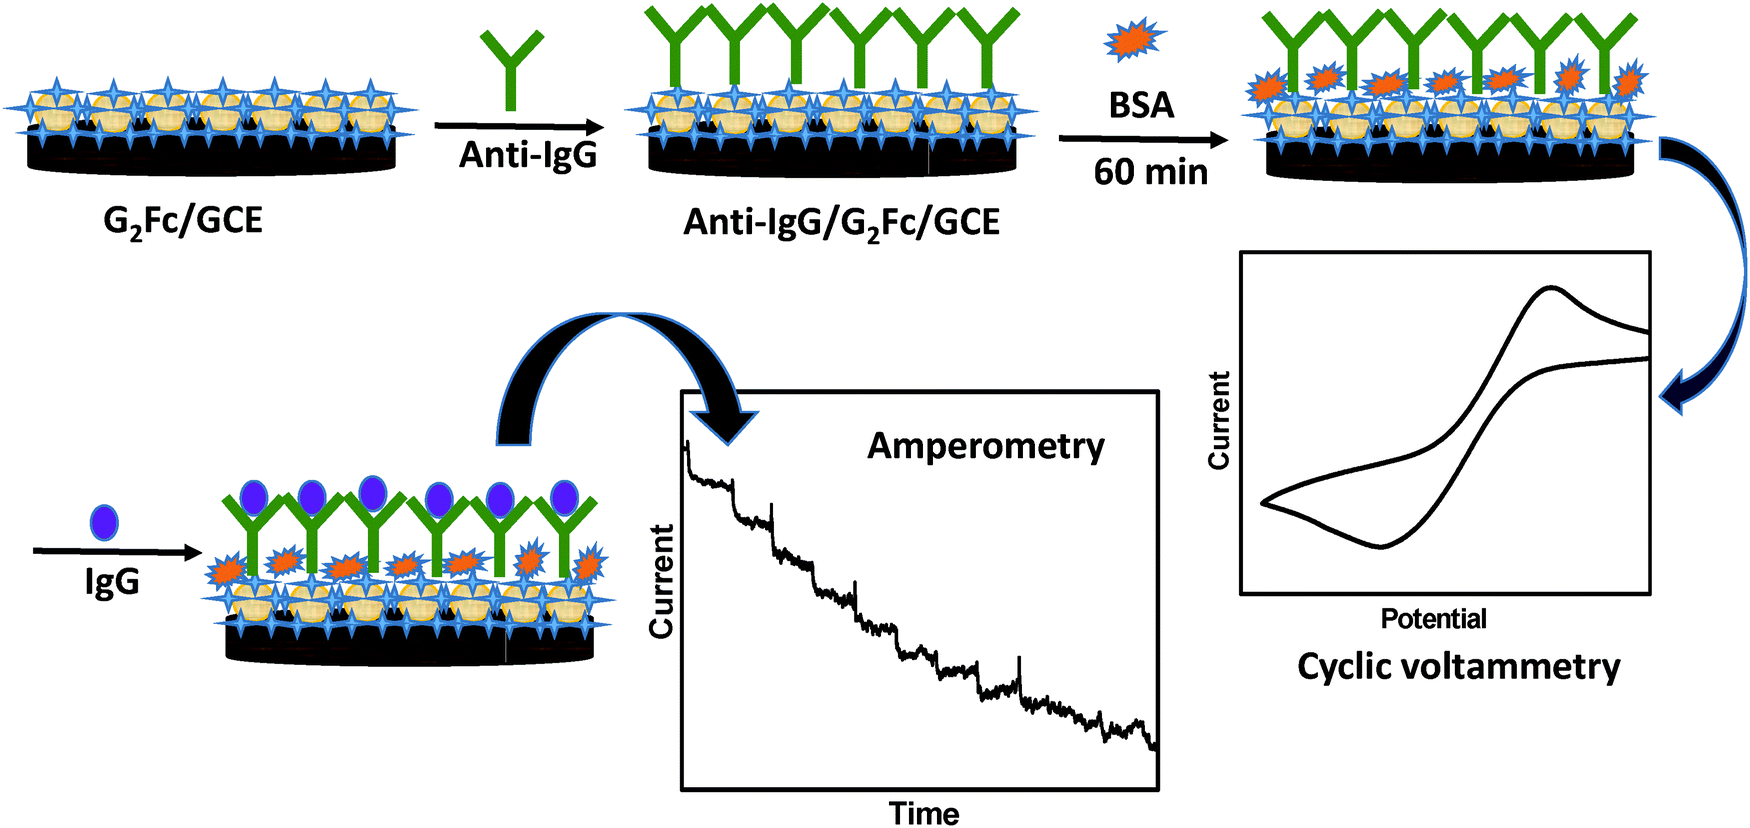
Herein, a novel electrochemical immunosensor for the detection of cancer biomarkers is proposed, which is based on a redox-active ferrocenyl dendrimer on a glassy carbon electrode (GCE). The electrochemical response by cyclic voltammetry (CV) has been used to detect over-expressed immunoglobulin (IgG) in the presence of a specific probe. The CV measurements were used to characterize each step of surface modification resulting due to the binding of IgG to anti-IgG. The change in voltammetric response, due to the formation of an immune complex produced by the antibody–antigen reaction was used for the sensitive detection of cancer biomarkers by amperometry.14 The reported detection technique is simple, convenient, reproducible and sensitive. The redox active G2Fc showed promising results in the recognition of cancer biomarkers at a very low concentration and at an early stage (Scheme 1).
 | ||
| Scheme 1 Representation of the immunosensor based on ferrocenyl dendrimer (G2Fc). | ||
Experimental
Materials and instruments
All reactions were carried out under a nitrogen or argon atmosphere using standard Schlenk techniques. Dichloromethane was used from a MBRAUN (MB-SPS 800) solvent drying and purification system. As starting materials, the H2N end-grafted dendrimer (1)26 and ferrocene carboxylic acid fluoride (2)27 were prepared according to the published procedures.28 All other reagents were used as received from commercial suppliers. The NMR spectrum was recorded using a Bruker Avance III 500 spectrometer. The 1H NMR spectrum was recorded at 500.3 MHz and the 13C{1H} one at 125.7 MHz, respectively. Chemical shifts are reported in δ units (parts per million) downfield from tetramethylsilane with the solvent as a reference signal (1H NMR: standard internal CDCl3, δ 7.26; 13C{1H} NMR: standard internal CDCl3, δ 77.16). High resolution mass spectra were recorded using a Bruker Daltonik micrOTOF-QII spectrometer (ESI-TOF). Elemental analysis was carried out using a Thermo Flash AE 1112 series instrument.Electrochemistry
Anti-goat Immunoglobulin (anti-IgG), Immunoglobulin (IgG) and bovine serum albumin (BSA) were obtained from Sigma Aldrich and stored at −20 °C. Phosphate buffer saline (PBS, 0.1 M, pH 7.2) was used as electrolyte for the electrochemical measurements. Solvents and reagents were purchased, were of reagent grade and were used as such.
Synthesis of the ferrocenyl end-grafted dendrimer (G2Fc)
The polyamidoamine (PAMAM)-based dendrimer 1 was modified32,33 and functionalized peripherally by redox-active ferrocenyl units to form a new electro-active functional material, ferrocenyl end-grafted dendrimer (G2Fc).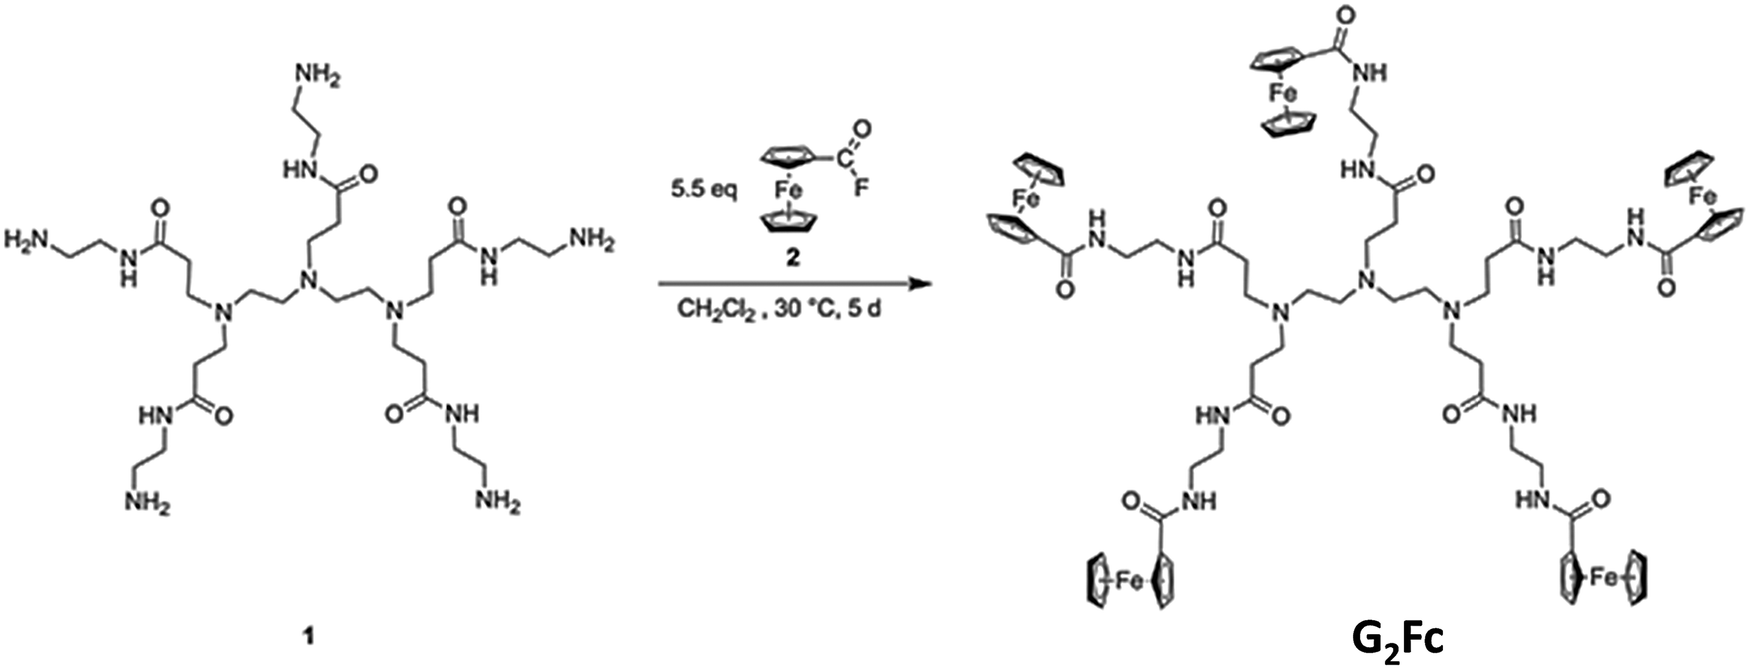 | ||
| Fig. 1 Synthesis of ferrocenyl end-grafted dendrimers G2Fc. | ||
Fabrication of the immunosensor
Ferrocenyl-functionalized dendrimers G2Fc (∼10 μg) were drop-casted on the GCE and kept for drying under an ambient atmosphere for a few hours. Then, 10 μL of 20 μg mL−1 anti-goat IgG (0.1 M PBS, pH 7.2) was immobilized onto the G2Fc/GCE. The electrode was incubated at 37 °C for 1h and the unbound anti-goat IgG was washed away with PBS. The immobilized electrode was then incubated with 10 mg mL−1 of BSA for 60 min at 37 °C to avoid non-specific adsorption by blocking the active sites.34 The modified electrode was stored at 4 °C when not in use.Results and discussion
G2Fc dendrimers have been used as a redox responsive receptor system for immobilization of cancer biomarkers. The dendrimers can easily adsorb on the surfaces and hence the modification of electrodes is easier. The interaction of the active recognition units with the ferrocenyl end-grafted dendrimers enhanced the sensing ability of the system not only in solution but also when confined on the electrode surface.Electrochemical properties of ferrocenyl end-grafted dendrimers (G2Fc)
The redox properties of G2Fc have been monitored in aqueous and non-aqueous electrolytes.Subsequently, the influence of the potential scan rate on the cyclic voltammograms of the G2Fc/GCE electrodes was investigated (Fig. 2a). It was found that there is a shift in the peak potential along with an increase in the peak current as the scan rates increased from 10 to 200 mV s−1. The ΔEp values are about 400–500 mV and remain fairly constant at lower scan rates, but increase with higher scan rates. This indicates that at a higher scan rate, the charge transfer is not sufficiently fast and the electrochemical reaction is basically charge-transfer controlled and not diffusion controlled (please note that we did not get linearity, when the peak current was plotted against the square root of the scan rate, Fig. 2b). This is indicative of a quasi-reversible system in which the current is controlled by both charge-transfer and mass-transfer. However, the system approaches reversibility as the scan rate increases.
 | ||
| Fig. 2 (a) Cyclic voltammograms of G2Fc in an aqueous electrolyte at varying scan rates, (b) current vs. square root of the scan rate depicting a non-linear response. CVs were measured at room temperature in PBS buffer (pH 7.0, 5 mL) containing 0.1 M KCl. | ||
Multiple successive scans were carried out to check the stability of the (G2Fc)-modified GCE and it was found that the electro-activity is retained throughout the study. Moreover, the redox response was unchanged even after several days.
 | ||
| Fig. 3 (a) Cyclic voltammograms of G2Fc in the non-aqueous electrolyte at varying scan rates, (b) plot of current density versus square root of the scan rate depicting the non-linear response of the system; CVs were measured in (1.0 mmol L−1 using [nBu4N][B(C6F5)4]) in dichloromethane at room temperature. | ||
The potential shift (ΔEp) is higher in an aqueous electrolyte due to diffused electrostatic interactions and more H-bond interactions with the amido groups of the PAMAM dendrimers, respectively.39 Furthermore, the electrochemical (E) and chemical (C) reactions influence the shape of the voltammograms. In the present study, both electron-transfer kinetics and chemical reactions play an important role and based on the above results, it can be concluded that the oxidation of G2Fc proceeds via a CE mechanism.40 In both aqueous and non-aqueous electrolytes, the occurrence of a single redox process with simultaneous multi-electron transfer at the same potential indicates that the iron centers of the ferrocenyl units are non-interacting in the mixed-valent dendrimer.41
Cyclic voltammetric characterization of the immunosensor
Cyclic voltammetry was used to monitor the stepwise assembly of the electrochemical immunosensor for its potential application in biosensing. Cyclic voltammetric studies of the G2Fc-modified glassy carbon electrode in a 0.1 M PBS solution of pH 7.2 showed a pair of well-defined redox peaks. The peak current decreased significantly with the immobilization of anti-goat IgG. After the immunosensor was blocked with BSA, a further decrease in the peak current was observed (Fig. 4). This may be due to the attachment of the protein BSA to the immunosensor.29 It was also found that the pH of the PBS solution affects the electrochemical immunosensor, due to denaturation of the BSA proteins. The current responses of the sensor were investigated at various pH values and the best current response was obtained at pH 7.2. Hence, for all further studies, PBS of pH 7.2 was used as optimum buffer solution. | ||
| Fig. 4 Cyclic voltammograms of the G2Fc (black) recorded in 0.1 M solution of PBS on immobilization with anti-IgG (red), BSA (blue) and IgG (green) at a scan rate of 50 mV s−1. | ||
In addition, the effect of incubation time on the current response of the immunosensor was examined. It was found that the current response decreases with incubation time and levels within 60 min. Therefore, 60 min was set as the optimum incubation time for the immobilization of BSA. Serum albumin is a weak polyacid and can be adsorbed on both positively and negatively charged surfaces depending on the pH. At pH 7.2, BSA (pI = 4.8) is negatively charged, while G2Fc remains positively charged and this leads to the binding of BSA through electrostatic attractive strength.42
The concentration of the antibody plays a vital role in influencing the sensitivity of an immunoassay. Therefore, the effect of anti-IgG antibody concentration was studied with a series of concentrations ranging from 0.5 μg mL−1 to 20 μg mL−1 as a function of the current inhibition ratio, i.e., the relative change in the current response. It was found that with the increase in the concentration of the antibody up to 5 μg mL−1, there was an increase in the current peak which then rapidly decreased as the antibody concentration was increased further. This may be ascribed to the molecular bonding between the antibody and the dendrimers which saturated at 5 μg mL−1. This led to the formation of a film that hindered the electron transmission towards the electrode surface thereby reducing the peak current. The maximum inhibition ratio was attained at a concentration of 5 μg mL−1, which was therefore taken as the optimized concentration for further studies.
The incubation time of an antibody and an antigen is important for achieving a satisfactory sensitivity of an immunoassay. Therefore, antigen–antibody interaction was studied as a function of absorbance in a time scale from 10 to 30 min. It was found that the intensity of the antibody–antigen reaction increased slightly with longer incubation time, and no significant difference was observed between the tests for 20 min and 30 min. Hence, an incubation time of 20 min was taken for all the studies thereafter.
Performances of the immunosensor
The current signal of the fabricated immunosensor BSA/anti-IgG/G2Fc/GCE was further investigated with immobilizing IgG (Fig. 5). A significant decrease in the current was observed, which may be due to the formation of immune-conjugates that block the tunneling of mass and electron transfer.43 The current signal was found to be directly related to the amount of IgG captured on the electrode surface. With the increase in the concentration of IgG, there is an increase in the amount of immune-conjugates formed on the immunosensor, decreasing the peak current. A good linear relationship between the current response and the IgG concentration in the range 100 to 1000 ng mL−1 with a correlation coefficient of 0.98664 was observed. This is associated with the electron flux involved in the redox reaction at the solution−immunosensor interface. The efficient and fast recognition of IgG may also be due to the electrostatic attraction forces between the carbonyl group of the ferrocenyl dendrimers and the amine groups of IgG.44 The hydrophilicity of the dendrimer enhances the adsorption of IgG, prevents denaturation and also exposes the active sites for binding with the complementary IgG.45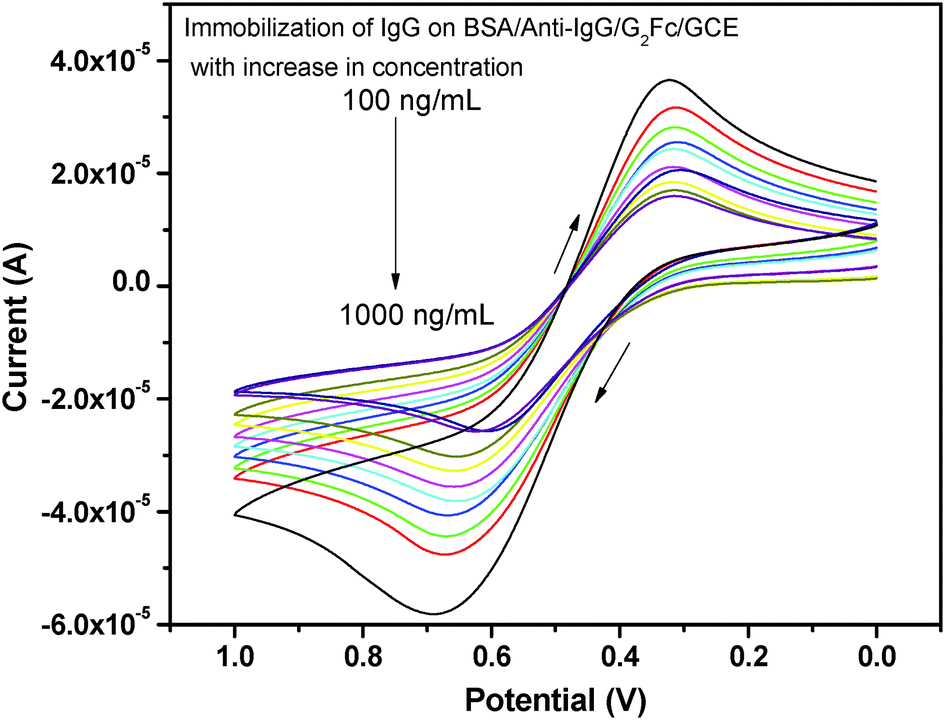 | ||
| Fig. 5 Effect of the concentration of IgG on BSA/anti-IgG/G2Fc/GCE. | ||
A control experiment was carried out to determine the degree of non-specific binding of anti-IgG. The control electrode did not produce any considerable signal amperometrically (0.05–0.12 μA), which showed that there was no significant non-specific adsorption of the antibody on the electrode surface. Further, the specificity of the immunosensor was also tested by incubating the BSA/anti-IgG/G2Fc/GCE probe in solutions containing 50 μg mL−1 of BSA and α-feto protein (AFP); however, no change in the peak current was observed. Therefore, it may be concluded that the current response of the BSA/anti-IgG/G2Fc/GCE probe to the target antibody (IgG) is due to a highly specific antigen–antibody interaction.
Amperometric response to IgG
The amperometric current response of BSA/anti-IgG/G2Fc/GCE was recorded in 0.1 M PBS at room temperature. The current response was monitored at +0.3 V vs. Ag/AgCl. Under the optimum experimental conditions, the relationship between the current and the concentration of IgG was measured in a wide concentration range (2–50 ng mL−1). The data indicate that the immunosensors are capable of estimating different concentrations of IgG and the amperometric response increased with the increase in the IgG concentration. As can be seen from Fig. 6, there is an immediate increase in the steady state current, which is due to the binding of IgG with the anti-IgG immobilized on G2Fc at the electrode surface. The steady state currents (inset of Fig. 6) exhibited linearity in the range of 5–50 ng mL−1 IgG and the linear dependencies of IgG yielded an equation of I (μA) = (−0.2046 ± 0.00003) + (−0.02016 ± 0.000001) [IgG] (ng mL−1) with a correlation coefficient of 0.9815. The sensitivity of the developed immune-sensor was 0.020 ± 0.00003 μA mL ng−1 and the limit of detection was ∼2 ng mL−1, based on three measurements for the standard deviation (95% confidence level, signal-to-noise ratio k = 3, number of repeated measurement = 3). The results also show that the electrode retains its ability to exhibit linear amperometric responses over a period of time without denaturing the antibody. | ||
| Fig. 6 Amperometric current–time response profile of IgG on BSA/anti-IgG/G2Fc/GCE. Inset shows the linearity of current response with increasing concentration of IgG. | ||
The stability of the immunosensor was evaluated over a period of one month. A group of immunosensors was kept at 4 °C under identical conditions and was periodically checked for their amperometric response. No apparent change in the current response was observed.
As far as the working of an electrochemical immunosensor is concerned, immobilization of the sensing molecules on the electrode surface remains the crucial step. The immobilization process should be simple, fast and effective and efforts should be made to optimize the loading of the receptor molecules. Dendrimers on one hand provide porosity to the system and on the other hand provide functionalities to entrap the biomolecule. Tailoring of redox-active dendrimers provides enhanced electro-activity to the system and enlarges the sensor surface for binding the antibodies. This would result in a higher biosensor signal.46 It may be assumed that both electron transfer and diffusion contribute to the signal transformation between the electroactive dendrimers and the antibody.
Conclusion
Within this study a redox-active ferrocenyl dendrimer-modified glassy carbon electrode for the detection of cancer biomarkers is described. The electrochemical behavior of redox-active G2Fc depends on the pH value and the type of electrolyte. The attachment of the biomarker and the binding events were studied by amperometry and cyclic voltammetry, respectively, with the results showing that the binding events result in a decrease in the exposed surface area giving rise to an increase in resistance and a lowering of the current intensity. The immunosensor requires very small amounts of the sample and exhibits shorter response times with good sensitivity towards IgG cancer biomarkers. The developed redox-active dendrimer-based immunosensor has the potential for further development into practical cancer diagnosis systems, which can be used in point-of-care quantitative tests for cancer biomarkers.Acknowledgements
The authors are grateful to the Deutsche Forschungsgemeinschaft (DFG), Germany and the Department of Science and Technology (DST), India vide Reference No. SR/WOS-A/CS-45/2010 for financial support.References
- S. Sengupta, Tetrahedron Lett., 2003, 44, 7281–7284 CrossRef CAS.
- S. M. Grayson and J. M. J. Fréchet, Chem. Rev., 2001, 101, 3819–3868 CrossRef CAS PubMed.
- C. Ornelas, J. Ruiz and D. Astruc, Organometallics, 2009, 28, 4431–4437 CrossRef CAS.
- C. Ornelas, J. Ruiz, C. Belin and D. Astruc, J. Am. Chem. Soc., 2009, 131, 590–601 CrossRef CAS PubMed.
- A. K. Diallo, J. C. Daran, F. Varret, J. Ruiz and D. Astruc, Angew. Chem., Int. Ed., 2009, 48, 3141–3145 CrossRef CAS PubMed.
- A. K. Diallo, C. Absalon, J. Ruiz and D. Astruc, J. Am. Chem. Soc., 2011, 133, 629–641 CrossRef CAS PubMed.
- D. Astruc, Nat. Chem., 2012, 4, 255–267 CrossRef CAS PubMed.
- J. F. Rusling, C. V. Kumar, J. S. Gutkinde and V. Patel, Analyst, 2010, 135, 2496–2511 RSC.
- X. Qiu, X. Zhu, L. Zhang and Y. Mao, Cancer Res., 2003, 63, 6488–6495 CAS.
- S. Chandra, N. Barola and D. Bahadur, Chem. Commun., 2011, 47, 11258–11260 RSC.
- M. Yang, A. Javadi and S. Gong, Sens. Actuators, B, 2011, 155, 357–360 CrossRef CAS.
- Z. M. Liu, H. F. Yang, Y. F. Li, Y. L. Liu, G. L. Shen and R. Q. Yu, Sens. Actuators, B, 2006, 113, 956–962 CrossRef CAS.
- L. Qiao, X. Wang and X. Sun, Int. J. Electrochem. Sci., 2014, 9, 1399–1414 Search PubMed.
- Y. R. Yuan, R. Yuan, Y. Q. Chai, Y. Zhuo and X. M. Miao, J. Electroanal. Chem., 2009, 626, 6–13 CrossRef CAS.
- D. Tang, J. Tang, B. Su, H. Chen, J. Huang and G. Chen, Microchim. Acta, 2010, 171, 457–464 CrossRef CAS.
- Q. Shen, S. K. You, S. G. Park, H. Jiang, D. Guo, B. Chen and X. Wang, Electroanalysis, 2008, 20, 2526–2530 CrossRef CAS.
- Y. Zhu, W. C. Alvin Koh and Y. B. Shim, Electroanalysis, 2010, 22, 2908–2914 CrossRef CAS.
- G. Liu, J. Wang, J. Kim, M. Jan and G. Collins, Anal. Chem., 2004, 76, 7126–7130 CrossRef CAS PubMed.
- R. Liang and W. J. Mu, Anal. Chim. Acta, 2006, 580, 128–135 CrossRef PubMed.
- X. Wu, H. Jiang, J. Zheng, X. Wang, Z. Gu and C. Chen, J. Electroanal. Chem., 2011, 656, 174–178 CrossRef CAS.
- L. Svobodová, M. Śnejdárková, V. Polohová, I. Grman, P. Rybrá and T. Hianik, Electroanalysis, 2006, 18, 1943–1949 CrossRef.
- B. Kavosia, A. Salimia, R. Hallaja and K. Amaniam, Biosens. Bioelectron., 2014, 52, 20–28 CrossRef PubMed.
- (a) W. Chen, D. H. Xu, L. Q. Liu, C. F. Peng, Y. Y. Zhu, W. Ma, A. Bian, Z. Li and L. B. Wang, Anal. Chem., 2009, 81, 9194–9198 CrossRef CAS PubMed; (b) S. Gupta, S. Huda, P. K. Kilpatrick and O. D. Velev, Anal. Chem., 2007, 79, 3810–3820 CrossRef CAS PubMed; (c) G. S. Lai, F. Yan and H. X. Ju, Anal. Chem., 2009, 81, 9730–9736 CrossRef CAS PubMed.
- S. J. Kwon, E. Kim, H. Yang and J. Kwak, Analyst, 2006, 131, 402–406 RSC.
- H. C. Yoon, M. Y. Hong and H. S. Kim, Anal. Chem., 2000, 72, 4420–4427 CrossRef CAS PubMed.
- S. Dietrich, A. Nicolai and H. Lang, J. Organomet. Chem., 2011, 696, 739–747 CrossRef CAS.
- T. H. Galow, J. Rodrigo, K. Cleary, G. Cooke and V. M. Rotello, J. Org. Chem., 1999, 64, 3745–3746 CrossRef CAS PubMed.
- E. R. de Jong, E. Manoury, J. C. Daran, C. O. Turrin, J. Chiffre, A. Sournia-Saquet, W. Knoll, J. P. Majoral and A. M. Caminade, J. Organomet. Chem., 2012, 718, 22–30 CrossRef CAS.
- A. Ray and S. Ghorai, Tetrahedron Lett., 2011, 52, 2980–2983 CrossRef CAS.
- G. Gritzner and J. Kuta, Pure Appl. Chem., 1984, 56, 461–466 CrossRef.
- A. Nafady and W. E. Geiger, Organometallics, 2008, 27, 5624–5631 CrossRef CAS.
- S. Dietrich, S. Chandra, C. Georgi, S. Thomas, D. Makarov, S. Schulze, M. Hietschold, M. Albrecht, D. Bahadur and H. Lang, Mater. Chem. Phys., 2012, 132, 292–299 CrossRef CAS.
- S. Chandra, M. D. Patel, H. Lang and D. Bahadur, J. Power Sources, 2015, 280, 217–226 CrossRef CAS.
- K. J. Huang, D. J. Niu, J. Y. Sun and J. J. Zhu, J. Electroanal. Chem., 2011, 656, 72–77 CrossRef CAS.
- (a) W. E. Geiger and F. Barrière, Acc. Chem. Res., 2010, 43, 1030–1039 CrossRef CAS PubMed; (b) F. Barrière and W. E. Geiger, J. Am. Chem. Soc., 2006, 128, 3980–3989 CrossRef PubMed; (c) F. Barrière, N. Camire, W. E. Geiger, U. T. Mueller-Westerhoff and R. Sanders, J. Am. Chem. Soc., 2002, 124, 7262–7263 CrossRef.
- (a) H. J. Gericke, N. I. Barnard, E. Erasmus, J. C. Swarts, M. J. Cook and M. A. S. Aquino, Inorg. Chim. Acta, 2010, 363, 2222–2232 CrossRef CAS; (b) E. Fourie, J. C. Swarts, D. Lorcy and N. Bellec, Inorg. Chem., 2010, 49, 952–959 CrossRef CAS PubMed; (c) J. C. Swarts, A. Nafady, J. H. Roudebush, S. Trupia and W. E. Geiger, Inorg. Chem., 2009, 48, 2156–2165 CrossRef CAS PubMed; (d) D. Chong, J. Slote and W. E. Geiger, J. Electroanal. Chem., 2009, 630, 28–34 CrossRef CAS; (e) V. N. Nemykin, G. T. Rohde, C. D. Barrett, R. G. Hadt, J. R. Sabin, G. Reina, P. Galloni and B. Floris, Inorg. Chem., 2010, 49, 7497–7509 CrossRef CAS PubMed; (f) V. N. Nemykin, G. T. Rohde, C. D. Barrett, R. G. Hadt, C. Bizzarri, P. Galloni, B. Floris, I. Nowik, R. H. Herber, A. G. Marrani, R. Zanoni and N. M. Loim, J. Am. Chem. Soc., 2009, 131, 14969–14978 CrossRef CAS PubMed; (g) A. Hildebrandt, S. W. Lehrich, D. Schaarschmidt, R. Jaeschke, K. Schreiter, S. Spange and H. Lang, Eur. J. Inorg. Chem., 2012, 1114–1121 CrossRef CAS; (h) A. Hildebrandt, D. Schaarschmidt, R. Claus and H. Lang, Inorg. Chem., 2011, 50, 10623–10632 CrossRef CAS PubMed; (i) A. Hildebrandt and H. Lang, Organometallics, 2013, 32, 5640–5653 CrossRef CAS; (j) U. Pfaff, A. Hildebrandt, D. Schaarschmidt, T. Rüffer, P. J. Low and H. Lang, Organometallics, 2013, 32, 6106–6117 CrossRef CAS; (k) A. Hildebrandt and H. Lang, Dalton Trans., 2011, 40, 11831–11837 RSC.
- D. Miesel, A. Hildebrandt, M. Korb, P. J. Low and H. Lang, Organometallics, 2013, 32, 2993–3002 CrossRef CAS.
- D. Astruc, C. Ornelas and J. Ruiz, Acc. Chem. Res., 2008, 41, 841–856 CrossRef CAS PubMed.
- O. Reynes, T. Gulon, J. C. Moutet, G. Royal and E. Saint-Aman, J. Organomet. Chem., 2002, 656, 116–119 CrossRef CAS.
- C. A. Nijhuis, B. A. Boukamp, B. Jan Ravoo, J. Huskens and D. N. Reinhoudt, J. Phys. Chem. C, 2007, 111, 9799–9810 CAS.
- M. Zamora, S. Herrero, J. Losada, I. Cuadrado, C. M. Casado and B. Alonso, Organometallics, 2007, 26, 2688–2693 CrossRef CAS.
- L. J. Feng, X. H. Zhang, D. M. Zhao and S. F. Wang, Sens. Actuators, B, 2011, 152, 88–93 CrossRef CAS.
- Y. Kong, J. Li, S. Wu, W. Cheng, R. K. Rana and J. J. Zhu, Sens. Actuators, B, 2013, 183, 187–193 CrossRef CAS.
- P. Thevenot, W. Hu and L. Tang, Curr. Top. Med. Chem., 2008, 8, 270–280 CrossRef CAS PubMed.
- D. Kim and A. E. Herr, Biomicrofluidics, 2013, 7, 041501 CrossRef PubMed.
- Y. Liu, R. Yuan, Y. Chai, C. Hong, K. Liu and S. Guan, Microchim. Acta, 2009, 167, 217–224 CrossRef CAS.
| This journal is © The Royal Society of Chemistry and the Centre National de la Recherche Scientifique 2016 |