 Open Access Article
Photophysical and photochemical studies of tricarbonyl rhenium(I) N-heterocyclic carbene complexes containing azide and triazolate ligands†
Peter V.
Simpson
a,
Brian W.
Skelton
b,
Paolo
Raiteri
a and
Massimiliano
Massi
*a
aNanochemistry Research Institute – Department of Chemistry, Curtin University, Kent Street, Bentley 6102 WA, Australia. E-mail: m.massi@curtin.edu.au
bCentre for Microscopy, Characterisation and Analysis, University of Western Australia, Crawley 6009 WA, Australia
First published on 22nd February 2016
Abstract
Rhenium(I) N-heterocyclic carbene (NHC) complexes of the type fac-[Re(CO)3(NHC)L] with either azide or triazolate ancillary ligands L and pyridyl or pyrimidyl substituted imidazolyl units have been prepared and structurally characterised, and their photophysical and photochemical properties studied. All of the complexes exhibit phosphorescent emission from triplet metal-to-ligand (3MCLT) excited states, typical of tricarbonyl Re(I) complexes, with the triazolate bound complexes having higher quantum yields and longer decay lifetimes compared to the azide bound complexes. The complexes containing pyridyl substituted imidazolyl units are photoreactive when dissolved in acetonitrile and undergo photochemical CO dissociation, the rate of which is significantly greater in the azide cf. triazolate complex. The photochemical mechanism of the azide/pyridyl complex was analysed and appears to give the same products, albeit with different ratios, to previously reported complexes where L is a halide. A reaction mechanism is proposed.
Introduction
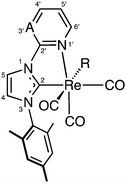
Rhenium(I) complexes of the type fac-[Re(CO)3(diim)L]0/+, where diim represents a π-conjugated diimine ligand such as 2,2′-bipyridine (bpy) or 1,10-phenanthroline (phen) and L is a monodentate anionic or neutral ancillary ligand, have been extensively studied due to their rich photophysical properties that give rise to phosphorescent decay typically from their lowest lying triplet metal-to-ligand charge transfer excited state (3MLCT).1–3 The emission from these excited states, which often displays relatively high quantum yields and long excited state lifetimes, can be fine tuned by judicious variation of the diim and ancillary ligands, making this class of compounds suitable for many applications including light emitting devices4,5 and biological labels.6–8Although complexes based on diim ligands have been thoroughly investigated, analogous complexes of the type fac-[Re(CO)3(NHC)L]0/+, where NHC represents a bidentate N-heterocyclic carbene ligand, which binds the metal through an imine type N atom and the carbene C atom, have been considerably less studied despite their ubiquity in inorganic chemistry. Nevertheless, complexes possessing NHC ligands bound to Ru(II), Pt(II), Ir(III) and Au(I)8–12 (just to name a few) display rich luminescent properties and so their effect on the photophysical properties of Re(I) complexes is of great interest. Along those lines, we13–15 and others16,17 have investigated these type of complexes, where the NHC is substituted in the 1-position with different imine type N donors that bind to the rhenium and thus change their photophysical properties. We have found that if the NHC contains a pyridyl as the N donor, the complex can exhibit photochemical CO dissociation in acetonitrile solution to form a tricarbonyl acetonitrile solvated complex and two different dicarbonyl complexes. While we have modified the N donor group to pyrimidyl, quinolyl, and quinoxyl to probe the scope of the photochemistry, we have found that only the pyridyl containing complexes are photoactive. These photoactive rhenium complexes could be of potential benefit in the area of photoinducible CO-releasing molecules (photoCORMs), whereby bioactive CO is released from the metal centre in a spatially and temporally controlled manner.18–21
We have recently become interested in the coordination of azide ligands to metal NHC complexes and their associated reactivity toward alkynes in a 1,3-diploar cycloaddition reaction. This area of chemistry has been extensively investigated by the group of Veige,22–25 who have studied the reaction of metal azides and metal alkynyl complexes, and others who have investigated the reactions of metal azides with organic alkynes.26–28 In the context of CORMs, the inclusion of a reactive azido ligand into the rhenium complex could be used to prepare and study photoactive CO-releasers bound to biological molecules, through an in situ click reaction with alkynyl functionalised biomolecules, without the need to add any additional catalysts such as copper(II) sulfate and ascorbate. Thus, in this study, we aim to expand our knowledge of complexes of the type fac-[Re(CO)3(NHC)L] by modifying the L ancillary ligand from exclusively halide (Cl− and Br−) to azide, and then reacted the metal azide with the model alkyne dimethyl acetylenedicarboxylate to form a triazolate ligand via the 1,3-diplor cycloaddition. Two sets of complexes containing pyridyl and pyrimidyl substituents on the NHC ligands as well as azide and triazolate ancillary ligands have been prepared, and their photophysical and photochemical properties studied.
Results and discussion
Synthesis and characterisation
Treatment of 1a and 1b with silver triflate in acetone and subsequent stirring over an excess of sodium azide led to the formation of 2a and 2b (Scheme 1), which were isolated in yields of 59 and 68%, respectively. The two complexes are soluble in most common organic solvents including dichloromethane, chloroform, acetone, methanol, dimethylsulfoxide, and dimethylformamide, and even exhibit moderate solubility in diethyl ether. Despite the excellent solubility of 2a, the complex is rather unstable toward both heat and light, and care must be taken during isolation. In contrast, complex 2b is stable toward both heat and light, with no decomposition observed during isolation. A strong azide stretch is observed in the IR spectra of 2a and 2b at 2047 and 2056 cm−1, respectively, while the facially arranged CO ligands are seen as three distinct stretches at 2010, 1916, and 1869 cm−1 for 2a; and two stretches at 2007 and 1889 cm−1 for 2b, due to the overlap of the A′(2) and A′′ modes into a single broad band. Analysis of the 1H NMR spectra of 2a and 2b reveals that, in a similar fashion to the parent compounds 1a and 1b, the corresponding azide complexes also exhibit a restricted rotation of the mesityl group around the C–N bond, as evidenced by the three singlets observed for the non-equivalent mesityl methyl environments.15 Additionally, the presence of three signals are observed in the 13C NMR spectra at ca. 197, 196, and 192 ppm for the three CO groups, as expected for the presence of three different ligands coordinated trans to them.In the presence of the alkyne dimethyl acetylenedicarboxylate (DMAD), the azide complexes 2a and 2b undergo a 1,3-dipolar cycloaddition that converts the azide ligand to an anionic triazolate ligand (Scheme 1). Specifically, addition of an excess DMAD to an acetone solutions of 2a and 2b, followed by stirring overnight at room temperature (for 2a) or reflux (for 2b) led to the formation of 3a and 3b, which were isolated as off-white solids in yields of 52 and 63%, respectively. Complexes 3a and 3b display drastically reduced solubility in organic solvents cf.2a and 2b, being moderately soluble in acetone, methanol, dimethylsulfoxide, and dimethylformamide. The disappearance of the azide stretch in the IR spectra of 3a and 3b confirms the consumption of the azide precursors, while the presence of three stretches in the 2020–1870 cm−1 region is consistent for the facially arranged CO ligands. The 1H NMR spectra of 3a and 3b is not straightforward: for every signal in the 1H NMR spectra a small neighbouring peak is observed, with the exception of the triazolate methyl singlet, which instead shows two smaller signals of half integration. Analysis of the 1H NMR spectra reveals two isomers in a ratio of ca. 1![[thin space (1/6-em)]](https://www.rsc.org/images/entities/char_2009.gif) :
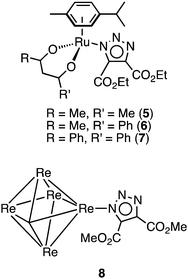
:![[thin space (1/6-em)]](https://www.rsc.org/images/entities/char_2009.gif) 0.18, which are ascribed to the coordination of the triazolate ligand via the N(2) and N(1) nitrogen atoms, respectively. These isomers could not be separated. As demonstrated by Veige and co-workers, the cycloaddition reaction between gold or platinum azides and gold alkynyl complexes will form N(1) coordinated triazolates.23,24 In the case of octahedral metal complexes, however, steric interactions between the ligands and the newly formed triazolate will be such that the kinetically formed N(1) coordinated triazolate will favour isomerisation to the N(2) form. Although single crystals of 3a and 3b could be obtained (see X-ray studies), we could not produce a sufficient quantity of crystals that would allow for a detailed NMR study of the interconversion of the triazolate ligand to be performed. Interestingly, coordination of a triazolate ligand via the N(1) nitrogen has only been reported twice before in the ruthenium acetylacetonate (acac) complexes 4–629 and also in hexanuclear rhenium chalcogenide cluster 8, see below in Fig. 1.30 In these cases, where two methyl esters are on the backbone of the N(1) bound triazolate ligand, the methyl group are seen as two separate singlets in the 1H NMR spectra in a similar fashion to 3a and 3b. In the case of the ruthenium acetylacetonate (acac−) complexes, the formation of the N(1) cf. N(2) bound triazole was heavily dependent on the substituents on the triazole and acac− ligands, with the complexes 5–7 being formed as sole isomer formed in the reaction. Rhenium cluster 8, however, was formed in only ca. 2% relative to the N(2) bound major isomer.
0.18, which are ascribed to the coordination of the triazolate ligand via the N(2) and N(1) nitrogen atoms, respectively. These isomers could not be separated. As demonstrated by Veige and co-workers, the cycloaddition reaction between gold or platinum azides and gold alkynyl complexes will form N(1) coordinated triazolates.23,24 In the case of octahedral metal complexes, however, steric interactions between the ligands and the newly formed triazolate will be such that the kinetically formed N(1) coordinated triazolate will favour isomerisation to the N(2) form. Although single crystals of 3a and 3b could be obtained (see X-ray studies), we could not produce a sufficient quantity of crystals that would allow for a detailed NMR study of the interconversion of the triazolate ligand to be performed. Interestingly, coordination of a triazolate ligand via the N(1) nitrogen has only been reported twice before in the ruthenium acetylacetonate (acac) complexes 4–629 and also in hexanuclear rhenium chalcogenide cluster 8, see below in Fig. 1.30 In these cases, where two methyl esters are on the backbone of the N(1) bound triazolate ligand, the methyl group are seen as two separate singlets in the 1H NMR spectra in a similar fashion to 3a and 3b. In the case of the ruthenium acetylacetonate (acac−) complexes, the formation of the N(1) cf. N(2) bound triazole was heavily dependent on the substituents on the triazole and acac− ligands, with the complexes 5–7 being formed as sole isomer formed in the reaction. Rhenium cluster 8, however, was formed in only ca. 2% relative to the N(2) bound major isomer.
X-Ray structural investigation
Single crystals suitable for X-ray diffraction studies were grown for each of the complexes (see Experimental section for crystal growth conditions), projections of which can be seen in Fig. 2. The structures are consistent with the proposed formulations of the complexes, with each possessing facially arranged tricarbonyl ligands. In all cases, the plane of the mesityl substituent is oriented ca. 90° with respect to the imidazolyl plane. A point of interest within the four structures is the angle between the planes of the imidazole and pyridyl/pyrimidyl rings; while the azido complex 2a is strained in this respect with an interplanar angle of 11.4°, the imidazole unit in complex 2b is almost completely coplanar with the pyrimidyl group, with an interplanar angle of just 1.6°. This seems to be due to the orientation of the azide ligand; in 2a the azide points back toward the carbene, thus bringing it close to one of the methyl groups on the mesityl substituent. The azido ligand in 2b, however, is directed away from the carbene and has no effect on the imidazolyl–pyrimidyl interplanar angle. The rhenium–carbene carbon distances are 2.123(4) and 2.118(5) Å for 2a and 2b, respectively, indicating that there are no significant differences in the donating ability of the two carbene ligands. | ||
| Fig. 2 X-Ray structures of the complexes 2a,b and 3a,b. Disordered groups and solvents present in the unit cell have been omitted for clarity. Ellipsoids are displayed at the 50% probability level. | ||
In the structures of 3a and 3b, the triazole ligand is coordinated at the N(2) position, with Re–N distances of 2.172(2) and 2.1657(18) Å, respectively. The nitrogen atoms in the triazole are now slightly further apart from the mesityl methyl group than in the case of 2a and 2b, with distances ranging from 3.76–3.85 and 3.60–3.85 Å for 3a and 3b, respectively. The differences between 3a and 3b can be explained by two factors: the smaller interplanar angle between the triazolate and the Re–C(2)–N(42)–C(101)–C(102) coordination planes in 3bcf.3a of 52.15° and 57.75°, respectively; and the slightly more twisted nature of the mesityl ligand in 3b, which brings the mesityl methyl group closer to the triazolate. A close examination of the mesityl methyl signals in the 1H NMR spectra of 3a and 3b suggests that these slight differences are maintained in solution, presumably due to the rigidity of these complexes. The aromatic nature of the triazolate ring causes an upfield chemical shift in the 1H NMR spectra of 3a and 3b, with the closer contacts in 3b leading to a slightly more upfield shift of 1.47 ppm, compared to 1.56 ppm for 3a.
Photophysical investigation
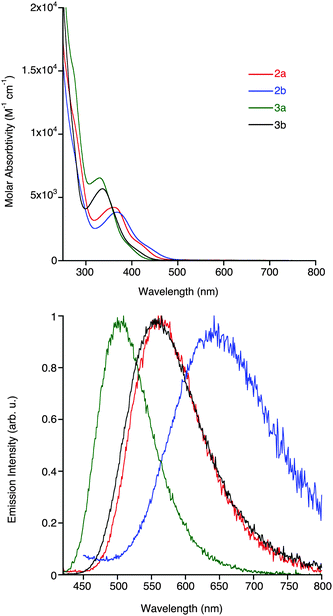
The photophysical data of all the complexes in dilute dichloromethane solutions are summarised in Table 1, with all absorption and emissions profiles shown in Fig. 3 (see ESI,† Fig. S1 for excitation spectra). The absorption spectra of 2a,b and 3a,b exhibit high-energy bands from ca. 250–300 nm, and lower energy bands of relatively smaller molar absorptivity above 300 nm. The higher energy bands are associated with ligand-centred (LC) π → π* transitions within the NHC and, in the case of 3a and 3b, the triazolate ligands. On the other hand, the lower energy bands are assigned to an admixture of MLCT (Re → NHC) and ligand-to-ligand (azide/triazolate → NHC; LLCT) charge transfer transitions, as previously described for similar complexes.13–15 A slight red-shift in the mixed MLCT/LLCT transitions of 2bcf.2a and 3bcf.3a of 5 and 6 nm, respectively, is attributed to the more electron deficient pyrimidyl- versus pyridyl-substituted NHC ligands. Comparison of the maxima of the lower-energy bands in the four complexes shows a decrease of ca. 30 nm going from azide- to triazolate-ligated species, which can be attributed to the electron-withdrawing nature of the triazolate ligand that serves to lower the energy of the HOMO, which is located primarily on the metal centre.| Complex | λ abs (nm) (104ε (cm−1 M−1)) | Emission (room temperature) | Emission (77 K) | |||||
|---|---|---|---|---|---|---|---|---|
| λ em (nm) | τ (ns) | τ (ns) | ϕ , | ϕ , | λ em (nm) | τ (μs) | ||
| a From air-equilibrated solutions. b From degassed solutions. c Quinine sulfate in air-equilibrated 0.1 M H2SO4 used as the reference. | ||||||||
| 2a | 228 (3.31), 362 (0.42) | 564 | 45 | 109 | 0.007 | 0.018 | 495 | 0.8 (23%), 4.4 (77%) |
| 2b | 274 (0.89), 367 (0.38) | 645 | 8 | 8 | 0.0001 | 0.0007 | 534 | 0.5 (20%), 3.8 (80%) |
| 3a | 273 (1.51), 330 (0.65) | 504 | 79 | 216 | 0.011 | 0.036 | 458 | 0.9 (12%), 4.1 (88%) |
| 3b | 274 (9.55), 336 (0.57) | 559 | 115 | 635 | 0.0055 | 0.024 | 488 | 3.2 (21%), 8.0 (79%) |
The emission profiles of the four complexes show broad and structureless bands located at 500–650 nm, which are common for emissive states of MLCT/LLCT character. Complexes 2a and 2b, possessing the azide ancillary ligands, have lower energy emissions than 3a and 3b due to the electron-donating ability of the azide ligand raising the energy of the HOMO. There is a general red-shift in the emission from the pyrimidyl-based complexes relative to their pyridyl-based analogues, which is particularly prevalent for the azide complexes 2a and 2b, where the λem are 564 and 645 nm, respectively. This difference is smaller in the triazolate containing complexes, where the λem for 3a and 3b are located at 504 and 559 nm, respectively. The emission wavelengths of 2a,b and 3a,b are significantly different than previously reported analogous complexes containing halide ancillary ligands,15 which suggests that the presence of either an azide or triazolate ligand strongly influences the energy of the excited states. The lifetime decays (τ) of the complexes are mono-exponential in nature and range from 8 to 115 ns, which then elongate after degassing; a similar trend is observed for the quantum yields, suggestive of an emissive state of triplet multiplicity (3MLCT/3LLCT).31,32 The marked differences in the lifetime decays of 2b can be explained, in part, by the energy gap law. Complex 2b, containing both the HOMO-raising azide ligand and the LUMO-lowering pyrimidyl substituent, has a relatively small HOMO–LUMO gap and therefore a high non-radiative decay constant (knr) in the order of 108 s−1, leading to relatively fast decay lifetimes and a quantum yield ca. 0.1%. Both triazolate-containing complexes have higher decay lifetimes and quantum yields that their azide-containing analogues. In a frozen matrix at 77 K (see ESI,† Fig. S2) all complexes display blue-shifted emission due to the rigidochromic effect, with decay lifetimes ranging from 0.5–8 μs.
Computational studies
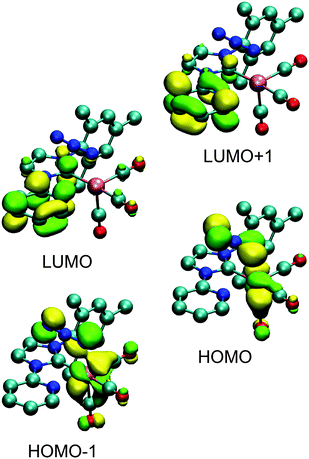
To validate the interpretation of the photophysical data, time-dependent density functional theory (TD-DFT; see Fig. 5 and ESI,† for orbital contours and table of calculated transitions) was used to simulate the energetics and absorption spectra of the four complexes. The structures were relaxed in dichloromethane and found to be consistent with the structures obtained from X-ray diffraction. The calculations indicate that the lower energy transitions involve the HOMO−n (n = 0, 1) orbitals and the LUMO+m (m = 0, 1) orbitals for 2a and 2b; and from the HOMO−n (n = 0, 1, 2) orbitals to the LUMO+m (m = 0, 1) orbitals for 3a and 3b. In agreement with the band assignment proposed above, the orbital contours show that these transitions are of MLCT nature that are partially mixed with LLCT character, a representative of which is shown in Fig. 4 for complex 2a. The higher energy transitions in the region of 250–300 nm are calculated as being LC π → π* in nature.Photochemical investigation
The photochemical properties of the complexes as solutions in CD3CN were assessed using 1H NMR spectroscopy with an irradiation wavelength of 365 nm, which corresponds to excitation into the MLCT/LLCT manifold. It was found that while the complexes with pyridyl-functionalised carbene ligands were photoactive, those containing pyrimidyl groups were photostable. This observation matches previously reported trends for rhenium complexes of carbene ligands.14,15 The 1H NMR spectra of 2a during photolysis over 8 hours is shown in Fig. 5. Examination of signals associated with N6′ shows that, after one hour, complex 2a has disappeared and two new species of low and high integration have been formed at 8.63 and 8.71 ppm, respectively. The signal at 8.63 has the same integration as another new signal at 9.44 ppm, which is characteristic of the H2 hydrogen in an imidazolium salt and suggests that these signals are associated with the formation of 1-pyridyl-3-mesitylimidazolium azide. It seems probable that the H2 hydrogen atom of the imidazolium salt arises from adventitious water present in the deuterated solvent. Over the course of the photolysis, the signals associated with the imidazolium salt continue to grow, while the intensity of the signal at 8.71 ppm increases for 3 or 4 hours, then decreases to zero by 7 hours. Close examination also shows that after 4 hours, a new species at 8.85 ppm begins to grow. Although the chemical shift of this new photoproduct is the same as for 2a, it is clearly a different compound as is evident by the disappearance of 2a after only one hour. The formation of unidentifiable decomposition products was observed from 8.87–8.98 ppm.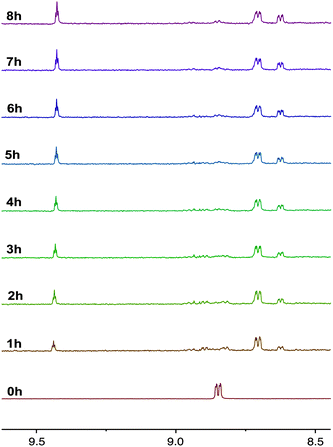 | ||
| Fig. 5 1H NMR progression of the photolysis of 2a in deuterated acetonitrile solutions. The photolysis was performed by irradiating the sample at 365 nm over a period of 8 h. | ||
The rapid photolysis of 2a shown in Fig. 5 does not give an indication of what occurs in the early stages of the photoreaction. Therefore, the experiment was carefully repeated for the initial hour to see if any intermediates were formed that might shed some light on the reaction pathway. The results were illuminating, and are shown in Fig. 6. After one minute of photolysis, the imidazolium salt can just be observed as signals at 9.44 and 8.63 ppm, and continues to slowly form during the entire 60 minutes. The next products to form are first observed after 5 minutes photolysis at 8.81 and 8.70 ppm; the former growing very slowly and the latter at 8.71 growing to be the major product over the course of the hour.
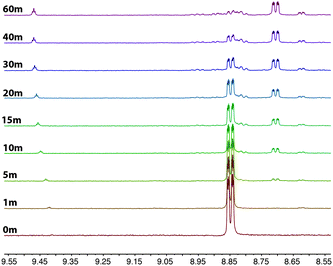 | ||
| Fig. 6 1H NMR progression of the photolysis of 2a in a deuterated acetonitrile solution. The photolysis was performed by irradiating the sample at 365 nm over a period of 1 h. | ||
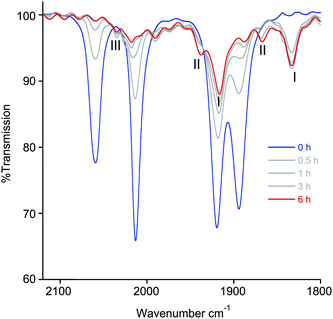
Although the NMR photolysis of 2a shows the formation of at least five different products, their identities could not be properly determined, except for the easily recognisable imidazolium salt 1-pyridyl-3-mesitylimidazolium azide. Monitoring the photolysis by IR spectroscopy (Fig. 7), however, gave a better understanding of the processes occurring. The final trace shows the presence of two pairs of carbonyl peaks at 1938, 1866 cm−1 and 1916, 1833 cm−1, the latter pair being of much higher intensity. The bands at 1938, 1866 cm−1, however, only began to form after 3 hours photolysis. Residual peaks of lower intensity are also observed at 2036 and 2017 cm−1. From comparison to our earlier reports of similar complexes with halide ligands instead of azide, the IR profile of photolysed 2a allows us to assign all of the photoproducts.14 The signals at 1916 and 1833 cm−1 are consistent with the formation of the neutral complex [Re(NHC)(CO)2(CH3CN)N3] (I), while the smaller pair of carbonyl bands are assigned to [Re(NHC)(CO)2(CH3CN)2]N3 (II). Interestingly, and in contrast to the photochemistry of our previously reported rhenium NHC complexes, the neutral species (I) is the major product formed by photolysis, while the ionic complex (II) is only formed in very small amounts. Close examination of the band at 2036 cm−1 shows that the intensity grows up to 3 hours and then decreases. This is consistent with the formation of the intermediate [Re(NHC)(CO)3(CH3CN)]N3 (III), which is itself consumed in the formation of (II). Indeed, this band is located at the same wavenumber as the [Re(NHCPh)(CO)3(CH3CN)]Cl, where the NHC ligand contains a phenyl substituent instead of mesityl.
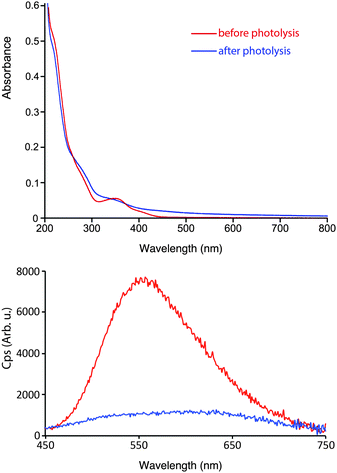
The absorption and emission profiles of 2a were measured prior to and after exhaustive photolysis, and are shown in Fig. 8. Significant changes have occurred in the absorption spectra after photolysis, with a loss of the defined MLCT/LLCT band and an increase in the absorbance above 400 nm. The emission spectra shows an initial band centred at 557 nm followed by large drop in the emission intensity upon photolysis consistent with the photo decomposition of 2a, and the formation of a broad and structureless band that is slightly red-shifted. A red-shifted band of lowered emission intensity is in agreement with the proposed formation of [Re(NHC)(CO)2(CD3CN)N3] (I), where the HOMO is raised cf.2a due to the loss of one π-acidic carbonyl ligand.
The combination of the NMR, IR, absorption, and emission spectra allow the photochemistry of 2a in CH3CN to be explained, and is shown in Scheme 2. After one minute photolysis, 2a begins to decompose to the imidazolium salt, seen as peaks in the in the 1H NMR spectra at 8.63 and 9.44 ppm. This observation warrant special mention, for although this side reaction proceeds steadily throughout the course of the photolysis, the formation of the imidazolium salt in this way does not seem consistent with a species that might form via the lowest MLCT excited state. As seen in Fig. 6, however, the imidazolium salt is clearly the first photoproduct formed, in a pathway independent of I–III. This is followed by the observance of (I) and (III) after only five minutes at 8.71 and 8.81 ppm, respectively, the former becoming the major species by 10 minutes of irradiation. As the photolysis proceeds (see Fig. 5 and 7), (I) continues to grow; the concentration of (III) remains low and after three hours the signal decreases to zero by ca. six hours irradiation. The decrease in the intensity of (III) is associated with the formation of a peak at 8.85 ppm due to complex (II), which is assumed to form via the substitution the carbonyl ligand by acetonitrile trans to the carbene.
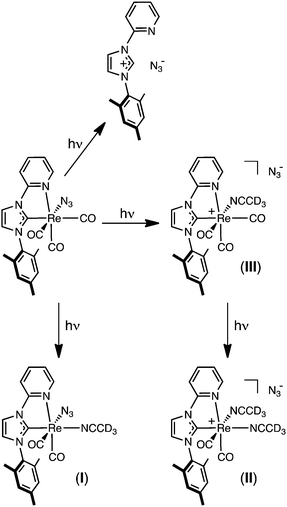 | ||
| Scheme 2 Reaction pathway describing the photochemical transformation of 2a when excited to their MLCT/LLCT manifold at λex = 365 nm. | ||
The photoreactivity of 3a as a solution in CD3CN was also assessed via1H NMR spectroscopy, the resulting spectra summarised in Fig. 9. Compared to 2a, the reactivity of 3a upon irradiation was markedly slower, with no photoproducts being observed in the first two hours of the experiment. Examination of the N6′ signal in the 1H NMR spectrum of 3a shows the presence of the N(2) and N(1) bound triazolate again in the ratio of 1![[thin space (1/6-em)]](https://www.rsc.org/images/entities/char_2009.gif) :
:![[thin space (1/6-em)]](https://www.rsc.org/images/entities/char_2009.gif) 0.18, however this ratio increased over the 13 hours of irradiation. The exact amount of N(1) bound triazolate, however, could not be determined due the appearance of an unidentified species at 8.69 ppm that partially overlapped the signal. In a similar fashion to the photolysis of 2a, signals at 8.63 ppm due to an imidazolium salt formed after two hours and continued to increase in concentration during the experiment. It is not clear whether the counteranion of the imidazolium salt would be the triazolate or a triazolate-derived decomposition product. Monitoring the photolysis by IR spectroscopy reveals little change over 6 hours, with the exception of two small bands being formed at 1867 and 1845 cm−1. These bands may be attributed to the formation of a dicarbonyl complex, although we are uncertain at present of its identity. Still it seems likely that one or more dicarbonyl species are formed, given the number of species observed in the 1H NMR. In an attempt to monitor the emission of 3a during photolysis, a CH3CN solution of the complex (ca. 105 M) was exposed to prolonged excitation inside the fluorimeter, but only a minor decrease in the emission intensity and no noticeable shift in the wavelength of emission, was observed.
0.18, however this ratio increased over the 13 hours of irradiation. The exact amount of N(1) bound triazolate, however, could not be determined due the appearance of an unidentified species at 8.69 ppm that partially overlapped the signal. In a similar fashion to the photolysis of 2a, signals at 8.63 ppm due to an imidazolium salt formed after two hours and continued to increase in concentration during the experiment. It is not clear whether the counteranion of the imidazolium salt would be the triazolate or a triazolate-derived decomposition product. Monitoring the photolysis by IR spectroscopy reveals little change over 6 hours, with the exception of two small bands being formed at 1867 and 1845 cm−1. These bands may be attributed to the formation of a dicarbonyl complex, although we are uncertain at present of its identity. Still it seems likely that one or more dicarbonyl species are formed, given the number of species observed in the 1H NMR. In an attempt to monitor the emission of 3a during photolysis, a CH3CN solution of the complex (ca. 105 M) was exposed to prolonged excitation inside the fluorimeter, but only a minor decrease in the emission intensity and no noticeable shift in the wavelength of emission, was observed.
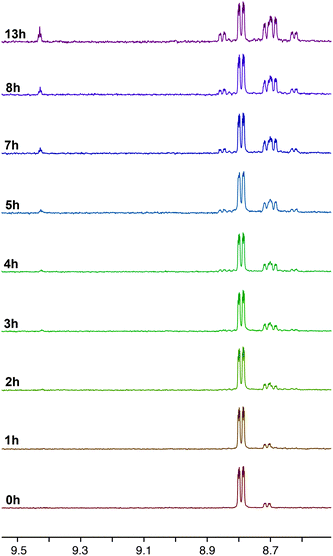 | ||
| Fig. 9 1H NMR progression of the photolysis of 3a in deuterated acetonitrile solutions. The photolysis was performed by irradiating the sample at 365 nm over a period of 13 h. | ||
Conclusion
The synthesis of the first rhenium(I) N-heterocyclic carbene complexes containing azide ligands (2a and 2b) has been performed, with the subsequent cycloaddition reaction with model alkyne dimethyl acetylenedicarboxylate affording triazolate ligated complexes 3a and 3b. The photophysical properties of the compounds have been investigated, and revealed a dependence on both the heterocyle bound to the imidazole (pyridyl vs. pyrimidyl) and the auxiliary ligand (azide vs. triazolate). The complexes display phosphorescent decay from triplet charge transfer (metal-to-ligand and ligand-to-ligand) excited states with markedly different λem and decay lifetimes (τ). The pyrimidyl group serves to lower the relative energy of the LUMO due to being more electron deficient compared with the pyridyl group, while the electron donating nature of the azide raises the HOMO cf. the electron withdrawing triazolate. Consistent with previous reports, the complexes with pyridyl substituents on the N-heterocyclic carbene were found to be photoactive when excited into the charge transfer manifold. Although difficult to interpret compared to analogous complexes containing halide ligands, photolysis of 2a revealed three independent pathways: the photodecomposition to the imidazolium salt; formation of the neutral [Re(NHC)(CO)3(CD3CN)N3] (I) as the major species; and formation of the tricarbonyl acetonitrile solvate [Re(NHC)(CO)3(CD3CN)]N3 (III), which then rapidly reacts to give the dicarbonyl species [Re(NHC)(CO)2(CD3CN)2]N3 (II). The photochemistry of 3a was much slower than that of 2a, with significant amounts of starting material still present after 13 hours irradiation. Again, the formation of an imidazolium salt and a general increase in the concentration of the N(1) bound-isomer was observed, but the other photoproducts have not yet been identified, although dicarbonyl complexes seem likely. The results presented in this paper describe new types of easily accessible rhenium(I) N-heterocyclic carbene complexes that have very different photophysical/photochemical properties to those previously reported. An investigation of the scope of the 1,3-diploar cycloaddition reaction using rhenium(I) N-heterocyclic carbene complexes of azide ligands is currently underway in our group.Experimental section
General considerations
All reagents and solvents were purchased from Sigma Aldrich and used as received without further purification. All reactions were conducted under an atmosphere of N2. All reactions and subsequent manipulations were performed in the dark where possible. Complexes 1a and 1b were prepared according to previously published procedures.15 Nuclear magnetic resonance spectra were recorded using a Bruker Avance 400 spectrometer (400.1 MHz for 1H; 100 MHz for 13C) at 300 K. All the NMR spectra were calibrated to residual solvent signals. Infrared spectra were recorded using an attenuated total reflectance Perkin Elmer Spectrum 100 FT-IR with a diamond stage. IR spectra were recorded from 4000 to 650 cm−1. The intensities of the IR bands are reported as strong (s), medium (m), or weak (w), with broad (br) bands also specified. Elemental analyses were obtained at Curtin University using a Thermo Finnigan EA 1112 Series Flash.Photophysical measurements
Absorption spectra were recorded at room temperature using a Cary 4000 UV/Vis spectrometer. Uncorrected steady state emission and excitation spectra were recorded on an Edinburgh FLSP980-S2S2-stm spectrometer equipped with: (i) a temperature-monitored cuvette holder; (ii) 450 W Xenon arc lamp; (iii) double excitation and emission monochromators; (iv) a Peltier cooled Hamamatsu R928P photomultiplier tube (spectral range 200–870 nm). Emission and excitation spectra were corrected for source intensity (lamp and grating) and emission spectral response (detector and grating) by a calibration curve supplied with the instrument. To record the 77 K luminescence spectra and emission lifetimes, the samples were put in glass tubes (2 mm diameter) and inserted in a special quartz Dewar filled up with liquid nitrogen. According to the approach described by Demas and Crosby,31 luminescence quantum yields (Φem) were measured in optically dilute solutions (O.D. < 0.1 at excitation wavelength) obtained from absorption spectra on a wavelength scale [nm] and compared to the reference emitter by the following equation:where A is the absorbance at the excitation wavelength (λ), I is the intensity of the excitation light at the excitation wavelength (λ), n is the refractive index of the solvent, D is the integrated intensity of the luminescence and Φ is the quantum yield. The subscripts r and x refer to the reference and the sample, respectively. The quantum yield determinations were performed at identical excitation wavelength for the sample and the reference. The quantum yields of complexes were measured against an air-equilibrated 0.1 M H2SO4 solution of quinine sulfate (Φr = 0.53).33 Emission lifetimes (τ) were determined with the time correlated single photon counting technique (TCSPC) with the same Edinburgh FLSP980-S2S2-stm spectrometer using either a pulsed picosecond LED (EPLED/EPL 377 nm, FHWM < 800 ps) or a microsecond flashlamp The goodness of fit was assessed by minimizing the reduced χ2 function and by visual inspection of the weighted residuals. The solvents used for the preparation of the solutions for the photophysical investigations were of LR grade and the water was deionised. Experimental uncertainties are estimated to be ±8% for lifetime determinations, ±20% for quantum yields, ±2 nm and ±5 nm for absorption and emission peaks, respectively.
Monitored photolysis
Monitored photolysis experiments were carried out using a Edinburgh FLSP980-S2S2-stm spectrometer. The reagents were added to acetonitrile in order to reach a final concentration of ca. 10−5 M (∼3 mL volume) in a quartz cuvette. The unstirred solutions were irradiated at λex = 350 nm with an excitation slit set to 10 nm and emission slit to 2.5 nm. A consecutive number of spectra, with no delay between replicates, were run per solution at a speed of 240 nm min−1 with the detector set to acquire a signal between 400 and 800 nm so that the complexes underwent exhaustive photolysis. Under these experimental conditions, the solution was constantly irradiated for a period of approximately 3 hours. The spectra were recorded uncorrected for the detector response.Lamp photolysis
Lamp photolysis experiments were carried using a UVP Blak-Ray® B-100AP High Intensity UV lamp with a 100 W bulb at a single wavelength output of 365 nm. The experiments were performed in the darkness. The reaction vessel consisted of a either a glass NMR tube containing deuterated solution of the complex.Numbering of complexes
![[thin space (1/6-em)]](https://www.rsc.org/images/entities/char_2009.gif) :
:![[thin space (1/6-em)]](https://www.rsc.org/images/entities/char_2009.gif) 1, 5 mL) and then precipitated with pentane. The resulting solid was collected, washed with pentane (4 × 3 mL), and dried to afford the product as a yellow solid. Yield: 61 mg, 59%. Anal. calc. for C20H17N6O3Re·(0.15CH2Cl2): C 41.14, H 2.96, N 14.28; found: C 41.37, H 2.50, N 13.89. FT-IR (ATR) νmax/cm−1: 2047 s (N3), 2010 s (CO), 1916 s (CO), 1869 s (CO), 1616 m, 1489 s, 1455 m, 1320 w, 1263 w. 1H-NMR δ/ppm (acetone-d6): 8.95 (1H, ddd, 3JH,H = 5.6 Hz, 4JH,H = 1.6 Hz, 5JH,H = 0.8 Hz, H6′), 8.54 (1H, d, 3JH,H = 2.1 Hz, H4), 8.39 (1H, ddd, 3JH,H = 9.0 Hz, 3JH,H = 7.5 Hz, 4JH,H = 1.6 Hz, H4′), 8.31 (1H, ddd, 3JH,H = 9.0 Hz, 4JH,H = 1.3 Hz, 5JH,H = 0.8 Hz, H3′), 7.63 (1H, ddd, 3JH,H = 7.5 Hz, 3JH,H = 5.6 Hz, 4JH,H = 1.3 Hz, H4′), 7.50 (1H, d, 3JH,H = 2.1 Hz, H5′), 7.11 (2 × 1H, 2 × s, 2 × mesityl CH), 2.36 (3H, s, mesityl CH3), 2.18 (3H, s, mesityl CH3), 2.14 (3H, s, mesityl CH3). 13C-NMR δ/ppm (acetone-d6): 198.98 (CO), 196.18 (CO), 193.98 (C2), 192.19 (CO), 154.4 (C6′), 140.6 (mesityl quat. C), 143.0 (C4′), 136.7 (mesityl quat. CH), 136.4 (mesityl quat. CH), 135.6 (mesityl quat. CH), 130.2 (mesityl CH), 129.9 (mesityl CH), 129.5 (C5), 125.1 (C5′), 118.8 (C4), 113.8 (C3′), 21.2 (mesityl CH3), 17.8 (mesityl CH3), 17.6 (mesityl CH3), C2′ was not observed. Crystals of 2a suitable for X-ray diffraction studies were grown by the diffusion of vapours between pentane and a methanol/acetone/dichloromethane solution of the complex.
1, 5 mL) and then precipitated with pentane. The resulting solid was collected, washed with pentane (4 × 3 mL), and dried to afford the product as a yellow solid. Yield: 61 mg, 59%. Anal. calc. for C20H17N6O3Re·(0.15CH2Cl2): C 41.14, H 2.96, N 14.28; found: C 41.37, H 2.50, N 13.89. FT-IR (ATR) νmax/cm−1: 2047 s (N3), 2010 s (CO), 1916 s (CO), 1869 s (CO), 1616 m, 1489 s, 1455 m, 1320 w, 1263 w. 1H-NMR δ/ppm (acetone-d6): 8.95 (1H, ddd, 3JH,H = 5.6 Hz, 4JH,H = 1.6 Hz, 5JH,H = 0.8 Hz, H6′), 8.54 (1H, d, 3JH,H = 2.1 Hz, H4), 8.39 (1H, ddd, 3JH,H = 9.0 Hz, 3JH,H = 7.5 Hz, 4JH,H = 1.6 Hz, H4′), 8.31 (1H, ddd, 3JH,H = 9.0 Hz, 4JH,H = 1.3 Hz, 5JH,H = 0.8 Hz, H3′), 7.63 (1H, ddd, 3JH,H = 7.5 Hz, 3JH,H = 5.6 Hz, 4JH,H = 1.3 Hz, H4′), 7.50 (1H, d, 3JH,H = 2.1 Hz, H5′), 7.11 (2 × 1H, 2 × s, 2 × mesityl CH), 2.36 (3H, s, mesityl CH3), 2.18 (3H, s, mesityl CH3), 2.14 (3H, s, mesityl CH3). 13C-NMR δ/ppm (acetone-d6): 198.98 (CO), 196.18 (CO), 193.98 (C2), 192.19 (CO), 154.4 (C6′), 140.6 (mesityl quat. C), 143.0 (C4′), 136.7 (mesityl quat. CH), 136.4 (mesityl quat. CH), 135.6 (mesityl quat. CH), 130.2 (mesityl CH), 129.9 (mesityl CH), 129.5 (C5), 125.1 (C5′), 118.8 (C4), 113.8 (C3′), 21.2 (mesityl CH3), 17.8 (mesityl CH3), 17.6 (mesityl CH3), C2′ was not observed. Crystals of 2a suitable for X-ray diffraction studies were grown by the diffusion of vapours between pentane and a methanol/acetone/dichloromethane solution of the complex.
Crystal data
![[1 with combining macron]](https://www.rsc.org/images/entities/char_0031_0304.gif) , a = 7.5348(5), b = 8.5333(4), c = 17.6251(12) Å, α = 76.322(5)°, β = 79.285(5)°, γ = 69.702(5)°, V = 1025.99(12) Å3, Z = 2, Dcalc = 1.863 Mg m−3, μ = 5.956 mm−1, 2θmax = 58°, crystal size = 0.39 × 0.10 × 0.04 mm3. Reflections collected = 13846, unique = 5460, Rint = 0.0327. Data/restraints/parameters = 5460/42/352, GooF = 1.125. Final R indices (I > 2σ(I)): R1 = 0.0310, wR2 = 0.0718. R indices (all data): R1 = 0.0344, wR2 = 0.0731. Δρmax,min = 2.225, −1.959 e Å−3. CCDC 1431845. The atoms of the mesityl group were modelled as being disordered over two sets of sites with occupancies constrained to 0.5 after trial refinement with geometries restrained to ideal values.
, a = 7.5348(5), b = 8.5333(4), c = 17.6251(12) Å, α = 76.322(5)°, β = 79.285(5)°, γ = 69.702(5)°, V = 1025.99(12) Å3, Z = 2, Dcalc = 1.863 Mg m−3, μ = 5.956 mm−1, 2θmax = 58°, crystal size = 0.39 × 0.10 × 0.04 mm3. Reflections collected = 13846, unique = 5460, Rint = 0.0327. Data/restraints/parameters = 5460/42/352, GooF = 1.125. Final R indices (I > 2σ(I)): R1 = 0.0310, wR2 = 0.0718. R indices (all data): R1 = 0.0344, wR2 = 0.0731. Δρmax,min = 2.225, −1.959 e Å−3. CCDC 1431845. The atoms of the mesityl group were modelled as being disordered over two sets of sites with occupancies constrained to 0.5 after trial refinement with geometries restrained to ideal values.
![[1 with combining macron]](https://www.rsc.org/images/entities/char_0031_0304.gif) , a = 7.7716(2), b = 11.1256(3), c = 15.1208(3) Å, α = 81.412(2)°, β = 77.239(2)°, γ = 75.665(2)°, V = 1229.20(5) Å3, Z = 2, Dcalc = 1.715 Mg m−3, μ = 5.125 mm−1, 2θmax = 54°, crystal size = 0.50 × 0.20 × 0.09 mm3. Reflections collected = 24
, a = 7.7716(2), b = 11.1256(3), c = 15.1208(3) Å, α = 81.412(2)°, β = 77.239(2)°, γ = 75.665(2)°, V = 1229.20(5) Å3, Z = 2, Dcalc = 1.715 Mg m−3, μ = 5.125 mm−1, 2θmax = 54°, crystal size = 0.50 × 0.20 × 0.09 mm3. Reflections collected = 24![[thin space (1/6-em)]](https://www.rsc.org/images/entities/char_2009.gif) 551, unique = 5344, Rint = 0.0300. Data/restraints/parameters = 5344/12/316, GooF = 1.121. Final R indices (I > 2σ(I)): R1 = 0.0341, wR2 = 0.0922. R indices (all data): R1 = 0.0350, wR2 = 0.0929. Δρmax,min = 3.350, −0.923 e Å−3. CCDC 1431846. The solvent was modelled as dichloromethane disordered over two sets of sites with occupancies refined to 0.408(8) and 0.279(7). Geometries were restrained to ideal values.
551, unique = 5344, Rint = 0.0300. Data/restraints/parameters = 5344/12/316, GooF = 1.121. Final R indices (I > 2σ(I)): R1 = 0.0341, wR2 = 0.0922. R indices (all data): R1 = 0.0350, wR2 = 0.0929. Δρmax,min = 3.350, −0.923 e Å−3. CCDC 1431846. The solvent was modelled as dichloromethane disordered over two sets of sites with occupancies refined to 0.408(8) and 0.279(7). Geometries were restrained to ideal values.
![[thin space (1/6-em)]](https://www.rsc.org/images/entities/char_2009.gif) 533, unique = 8703, Rint = 0.0533. Data/restraints/parameters = 8703/0/366, GooF = 1.086. Final R indices (I > 2σ(I)): R1 = 0.0326, wR2 = 0.0572. R indices (all data): R1 = 0.0469, wR2 = 0.0610. Δρmax,min = 1.355, −1.154 e Å−3. CCDC 1431847.
533, unique = 8703, Rint = 0.0533. Data/restraints/parameters = 8703/0/366, GooF = 1.086. Final R indices (I > 2σ(I)): R1 = 0.0326, wR2 = 0.0572. R indices (all data): R1 = 0.0469, wR2 = 0.0610. Δρmax,min = 1.355, −1.154 e Å−3. CCDC 1431847.
Computational calculations
Time-dependent density functional theory (TD-DFT) calculations were performed with GAUSSIAN 09 in order to calculate the absorption spectra for synthesized complexes.35 Prior to these calculations, the structures were relaxed at the B3LYP level of theory in the presence of an implicit solvent (dichloromethane). The Re atoms were treated with the Stuttgart–Dresden (SDD) effective core potential;36 the Pople 6-311++G** basis set was used for C, H, N, and O atoms, and in all calculations the effect of the solvent was mimicked with the PCM solvation model,37 with parameters adequate for dichloromethane. The low-lying singlet–singlet excitation energies were calculated at the same level of theory, and the spectra were reproduced as the superposition of Gaussian functions with heights proportional to calculated intensities and a variance of 11 nm.Acknowledgements
This work is financially supported by the Australian Research Council (FT130100033 to MM and FT130100463 to PR). The authors acknowledge the facilities, and the scientific and technical assistance of the Australian Microscopy & Microanalysis Research Facility at the Centre for Microscopy, Characterisation & Analysis, The University of Western Australia, a facility funded by the University, State and Commonwealth Governments. This work was supported by resources provided by the National Computational Infrastructure (NCI), which is supported by the Australian Government.References
- R. A. Kirgan, B. P. Sullivan and D. P. Rillema, Top. Curr. Chem., 2007, 281, 45 CrossRef CAS.
- A. Vlček Jr, Top. Organomet. Chem., 2010, 29, 73 CrossRef.
- A. Kumar, S.-S. Sun and A. J. Lees, Top. Organomet. Chem., 2010, 29, 1 CAS.
- M. Mauro, E. Q. Procopio, Y. Sun, C.-H. Chien, D. Donghi, M. Panigati, P. Mercandelli, P. Mussini, G. D'Alfonso and L. De Cola, Adv. Funct. Mater., 2009, 19, 2607 CrossRef CAS.
- T. Yu, D. P.-K. Tsang, V. K.-M. Au, W. H. Lam, M.-Y. Chan and V. W.-W. Yam, Chem. – Eur. J., 2013, 19, 13418 CrossRef CAS PubMed.
- K. K.-W. Lo, W.-K. Hui, C.-K. Chung, K. H.-K. Tsang, D. C.-M. Ng, N. Zhu and K.-K. Cheung, Coord. Chem. Rev., 2005, 249, 1434 CrossRef CAS.
- K. K.-W. Lo, K. Y. Zhang and S. P.-Y. Li, Eur. J. Inorg. Chem., 2011, 3551 CrossRef CAS.
- T. Zou, C. T. Lum, S. S.-Y. Chui and C.-M. Che, Angew. Chem., Int. Ed., 2013, 52, 2930 CrossRef CAS PubMed.
- G. J. Barbante, P. S. Francis, C. F. Hogan, P. R. Kheradmand, D. J. D. Wilson and P. J. Barnard, Inorg. Chem., 2013, 52, 7448 CrossRef CAS PubMed.
- Y. Unger, A. Zeller, S. Ahrens and T. Strassner, Chem. Commun., 2008, 3263 RSC.
- R. Visbal, I. Ospino, J. M. López-de-Luzuriaga, A. Laguna and M. C. Gimeno, J. Am. Chem. Soc., 2013, 135, 4712 CrossRef CAS PubMed.
- C.-H. Yang, J. Beltran, V. Lemaur, J. Cornil, D. Hartmann, W. Sarfert, R. Fröhlich, C. Bizzarri and L. De Cola, Inorg. Chem., 2010, 49, 9891 CrossRef CAS PubMed.
- L. A. Casson, S. Muzzioli, P. Raiteri, B. W. Skelton, S. Stagni, M. Massi and D. H. Brown, Dalton Trans., 2011, 40, 11960 RSC.
- J. G. Vaughan, B. L. Reid, S. Ramchandani, P. J. Wright, S. Muzzioli, B. W. Skelton, P. Raiteri, D. H. Brown, S. Stagni and M. Massi, Dalton Trans., 2013, 42, 14100 RSC.
- J. G. Vaughan, B. L. Reid, P. J. Wright, S. Ramchandani, B. W. Skelton, P. Raiteri, S. Muzzioli, D. H. Brown, S. Stagni and M. Massi, Inorg. Chem., 2014, 53, 3629 CrossRef CAS PubMed.
- X.-W. Li, H.-Y. Li, G.-F. Wang, F. Chen, Y.-Z. Li, X.-T. Chen, Y.-X. Zheng and Z.-L. Xue, Organometallics, 2012, 31, 3829 CrossRef CAS.
- G.-F. Wang, Y.-Z. Liu, X.-T. Chen, Y.-X. Zheng and Z.-L. Xue, Inorg. Chim. Acta, 2013, 394, 488 CrossRef CAS.
- S. García-Gallego and G. J. L. Bernardes, Angew. Chem., Int. Ed., 2014, 53, 9712 CrossRef PubMed.
- C. C. Romao, W. A. Blattler, J. D. Seixas and G. J. L. Bernardes, Chem. Soc. Rev., 2012, 41, 3571 RSC.
- U. Schatzschneider, Inorg. Chim. Acta, 2011, 374, 19 CrossRef CAS.
- U. Schatzschneider, Br. J. Pharmacol., 2015, 172, 1638 CrossRef CAS PubMed.
- T. J. Del Castillo, S. Sarkar, K. A. Abboud and A. S. Veige, Dalton Trans., 2011, 40, 8140 RSC.
- A. R. Powers, I. Ghiviriga, K. A. Abboud and A. S. Veige, Dalton Trans., 2015, 44, 14747 RSC.
- A. R. Powers, X. Yang, T. J. Del Castillo, I. Ghiviriga, K. A. Abboud and A. S. Veige, Dalton Trans., 2013, 42, 14963 RSC.
- X. Yang, S. Wang, I. Ghiviriga, K. A. Abboud and A. S. Veige, Dalton Trans., 2015, 44, 11437 RSC.
- H.-W. Frühauf, Chem. Rev., 1997, 97, 523 CrossRef.
- L. Henry, C. Schneider, B. Mutzel, P. V. Simpson, C. Nagel, K. Fucke and U. Schatzschneider, Chem. Commun., 2014, 50, 15692 RSC.
- S. D. Koster, H. Alborzinia, S. Can, I. Kitanovic, S. Wolfl, R. Rubbiani, I. Ott, P. Riesterer, A. Prokop, K. Merz and N. Metzler-Nolte, Chem. Sci., 2012, 3, 2062 RSC.
- K. S. Singh, K. A. Kreisel, G. P. A. Yap and M. R. Kollipara, J. Organomet. Chem., 2006, 691, 3509 CrossRef CAS.
- S. A. Knott, J. N. Templeton, J. L. Durham, A. M. Howard, R. McDonald and L. F. Szczepura, Dalton Trans., 2013, 42, 8132 RSC.
- S. Stagni, S. Colella, A. Palazzi, G. Valenti, S. Zacchini, F. Paolucci, M. Marcaccio, R. Q. Albuquerque and L. De Cola, Inorg. Chem., 2008, 47, 10509 CrossRef CAS PubMed.
- L. Flamigni, A. Barbieri, C. Sabatini, B. Ventura and F. Barigelletti, Top. Curr. Chem., 2007, 281, 143 CrossRef CAS.
- D. Eaton, Pure Appl. Chem., 1988, 60, 1107 CrossRef CAS.
- G. M. Sheldrick, Acta Crystallogr., Sect. C: Struct. Chem., 2015, 71, 3 CrossRef PubMed.
- M. J. Frisch, G. W. Trucks, H. B. Schlegel, G. E. Scuseria, M. A. Robb, J. R. Cheeseman, G. Scalmani, V. Barone, B. Mennucci, G. A. Petersson, H. Nakatsuji, M. Caricato, X. Li, H. P. Hratchian, A. F. Izmaylov, J. Bloino, G. Zheng, J. L. Sonnenberg, M. Hada, M. Ehara, K. Toyota, R. Fukuda, J. Hasegawa, M. Ishida, T. Nakajima, Y. Honda, O. Kitao, H. Nakai, T. Vreven, J. A. Montgomery Jr., J. E. Peralta, F. Ogliaro, M. J. Bearpark, J. Heyd, E. N. Brothers, K. N. Kudin, V. N. Staroverov, R. Kobayashi, J. Normand, K. Raghavachari, A. P. Rendell, J. C. Burant, S. S. Iyengar, J. Tomasi, M. Cossi, N. Rega, N. J. Millam, M. Klene, J. E. Knox, J. B. Cross, V. Bakken, C. Adamo, J. Jaramillo, R. Gomperts, R. E. Stratmann, O. Yazyev, A. J. Austin, R. Cammi, C. Pomelli, J. W. Ochterski, R. L. Martin, K. Morokuma, V. G. Zakrzewski, G. A. Voth, P. Salvador, J. J. Dannenberg, S. Dapprich, A. D. Daniels, Ö. Farkas, J. B. Foresman, J. V. Ortiz, J. Cioslowski and D. J. Fox, Gaussian 09, Gaussian, Inc., Wallingford, CT, USA, 2009, vol. revision B.01 Search PubMed.
- D. Andrae, U. Häußermann, M. Dolg, H. Stoll and H. Preuß, Theor. Chim. Acta, 1990, 77, 123 CrossRef CAS.
- J. Tomasi, B. Mennucci and R. Cammi, Chem. Rev., 2005, 105, 2999 CrossRef CAS PubMed.
Footnote |
| † Electronic supplementary information (ESI) available. CCDC 1431845–1431848. For ESI and crystallographic data in CIF or other electronic format see DOI: 10.1039/c5nj03301b |
| This journal is © The Royal Society of Chemistry and the Centre National de la Recherche Scientifique 2016 |


