DOI:
10.1039/C5NJ02639C
(Paper)
New J. Chem., 2016,
40, 1213-1221
The synthesis and characterization of tributyl phosphate grafted carbon nanotubes by the floating catalytic chemical vapor deposition method and their sorption behavior towards uranium
Received
(in Montpellier, France)
28th September 2015
, Accepted 18th November 2015
First published on 23rd November 2015
Abstract
Carbon nanotubes (CNTs) were synthesized by the floating catalytic chemical vapor deposition technique using ferrocene in benzene as the hydrocarbon source. The functionalization of CNTs was carried out by oxidation (CNT-OX) and grafting with a tributyl phosphate (TBP) ligand (CNT-TBP). Various spectroscopic techniques including scanning electron microscopy (SEM), Fourier Transform Infra Red Spectroscopy (FTIR), BET surface area and X-ray photoelectron spectroscopy (XPS) were used to characterize the adsorbents. FTIR and XPS studies revealed the efficient grafting of the TBP ligand on the CNT surface. The effect of the initial pH and the contact time for the maximum adsorption of U(VI) with CNT-plain, CNT-OX and CNT-TBP was studied. The spontaneity of the sorption was confirmed by thermodynamic data. A pseudo second order model with a regression coefficient of >0.978 was obtained for CNT-TBP and equilibrium was reached within 3 h. The Langmuir maximum adsorption capacity of U(VI) at pH 5 for CNT, CNT-OX and CNT-TBP was found to be 66.6, 100.0 and 166.6 mg g−1 respectively. Using 0.1 M HCL as a desorbent, recyclability studies were carried out for three cycles. The probable mechanism of adsorption between U(VI) and CNT-TBP could be understood through FTIR and XPS techniques.
1. Introduction
Advanced treatment methods are required for the management of radioactive waste produced by nuclear power plants.1,2 Uranium is one of the major waste materials in spent nuclear fuels or mine tailings, and it can cause significant contamination.3 An exposure level of 0.1 mg kg−1 of body weight of natural U could result in kidney damage.4 The World Health Organization's guideline value for uranium is set at 50 μg L−1.5 Several methods have been found to be useful for the removal of uranyl ions from process effluents and wastewater. For water treatment, compared to other techniques adsorption has been found to be a preferred technique owing to its flexibility, cost effectiveness, ease of operation and simple design. A weak affinity and low adsorption capacity are exhibited by natural adsorbents for U(VI) under ambient conditions. Therefore, there is a need for new, eco-friendly and economical adsorbents with high adsorption capacities and stronger chemical interaction towards U(VI). Among the various adsorbents reported in the literature, sorption materials made of carbon offer a variety of advantages including high thermal and radiation resistance and improved chemical stability under acidic conditions compared to other inorganic sorbents and ion exchange resins.6 Various carbonaceous materials like activated carbon,7,8 activated carbon fibers,9 carbon nanotubes10,11 and mesoporous carbon12 have been reported for the removal of U(VI) ions from aqueous solution. Tributyl phosphate (TBP) is one of the widely used extractants for the removal of U(VI).13 Thus, in this work three kinds of carbon nanotubes namely plain CNTs, oxidized CNTs and TBP grafted CNTs structurally characterized by various techniques will be prepared and evaluated for the removal and recovery of U(VI). Using spectroscopic tools the adsorption mechanism between U(VI) and CNT-TBP will also be discussed.
2. Materials and methods
All reagents and chemicals like nitric acid (HNO3), sodium hydroxide (NaOH), tributyl phosphate (TBP), uranyl(VI) nitrate (UO2(NO3)2·6H2O), solvents (ethanol, acetone) and other reagents used in this study are of analytical grade. Using Milli-Q purified water (resistivity >18.2 MΩ cm) the reagents and standards were prepared.
2.1 Preparation of carbon nanotubes
Carbon nanotubes were prepared by the floating catalyst horizontal chemical vapour deposition technique using 2% ferrocene in benzene as the hydrocarbon source.14 The flow rate of the ferrocene/benzene solution and nitrogen gas was controlled using a peristaltic pump and a mass flow controller (Bronkhorst high-tech. Netherlands), respectively. The temperature of the electric furnace was gradually increased to 800 °C under a nitrogen atmosphere. The flow rates of the ferrocene/benzene solution and nitrogen gas were set to 1 mL min−1 and 100 sccm respectively and the ferrocene/benzene solution was pumped into the reactor for 30 min at an 800 °C reactor temperature. The reactor was gradually cooled to room temperature. The deposited CNTs were removed and used for further experiments.
2.2 Preparation of CNT-OX
Around 1 g of plain CNTs was heated with 10 ml of nitric acid at 80 °C until the acid evaporated completely. Then, a thorough washing with distilled water was carried out until the pH of the filtrate became neutral. Finally, the obtained product was dried in an oven at 70 °C overnight and used for further experiments.
2.3 Preparation of CNT-TBP
One gram of CNT-OX was treated with 20 mL of tributyl phosphate and the solution was sonicated for 24 h. Then, the obtained mixture was washed using distilled water and dried at 70 °C overnight and used for further experiments.
The preparation of CNT-OX and CNT-TBP is shown in Scheme 1.
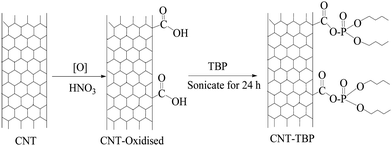 |
| | Scheme 1 Preparation of CNT-OX and CNT-TBP. | |
2.4 Batch studies
Using batch mode, sorption experiments were carried out by equilibrating 20 mL of 100 mg L−1 of uranyl ions at pH 5 for 3 h using 0.05 g of the adsorbent. The concentration of uranyl ions in the aqueous phase was analyzed by inductive coupled plasma-mass spectrometry (ICP-MS) (Thermo Scientific, XSERIES 2). The amount of uranyl ions adsorbed (mg) per unit mass of the adsorbent (g), qe, was obtained by the equation given below:| |  | (1) |
where Ci and Ce are the initial and equilibrium concentrations of uranyl ions (mg L−1), V is the volume of the aqueous phase (L), and m is the dry mass of the adsorbent (g). Kinetic experiments were conducted by monitoring the amount of uranyl ions adsorbed at regular time intervals. The amount of U(VI) adsorption at temperatures 25 °C, 35 °C and 45 °C was measured for calculating the thermodynamic parameters. The recyclability of CNT-TBP was investigated using 0.1 M HCl as a desorber.
2.5 Instrumentation
Fourier Transform Infra-Red (FTIR) measurements were recorded on a Tensor 27 (Bruker, Germany) in the attenuated total reflectance (ATR) mode. SEM micrographs were acquired using an FEI Quanta 200 machine. TEM analysis was carried out on a Technai G2 T-20 (FEI, Eindhoven, Netherlands) transmission electron microscope operated at 200 kV. Using a PHI 5000 Versa Prob II (FEI Inc.) spectrometer with non-monochromatic Al Kα radiation (1486.6 eV), XPS measurements were carried out. Individual spectral peaks were deconvoluted using XPSPEAK41 software. For fitting the spectral region a nonlinear Shirley background subtraction was applied. The surface characteristics of the sorbent namely pore size distribution (PSD), pore volume and specific surface area were measured using an Autosorb-1C instrument (Quantachrome, USA). Finally, the concentration of U(VI) in the aqueous solutions was determined by inductive coupled plasma mass spectroscopy (ICP-MS; Thermo, X-Series2).
3. Results and discussion
As described in the Materials and methods section, initially CNTs were synthesized by the floating catalytic chemical vapour deposition method and grafting was carried out by oxidation (CNT-OX) and further treatment with tributyl phosphate (CNT-TBP). Thus the prepared adsorbents viz., CNT-plain, CNT-OX and CNT-TBP were characterized by various techniques including SEM, TEM, BET surface analysis, FTIR, and XPS and evaluated for their applicability towards the removal of uranyl ions.
3.1 Characterization of adsorbents
3.1.1 Surface morphology using SEM and TEM.
SEM images of plain CNTs, oxidized CNTs, and CNT-TBP are shown in Fig. 1(a)–(c) respectively. The diameter and length of the prepared CNTs were found to be in the range of 20–80 nm and 1–10 μm respectively (Fig. 1(a)). In CNT-OX (Fig. 1(b)) exfoliated rope like structures are observed. This could be attributed to the etching of graphitic layers of CNTs during oxidation. After oxidation and grafting of the TBP ligand (Fig. 1c) there was no appreciable difference in the surface characteristics which confirms that minimal damage occurred after grafting with the TBP ligand. The HR-TEM image revealed the presence of nanotubes and iron particles located inside the nanotubes (Fig. 2(a)). The corresponding diffraction rings and a bright spot in the electron diffraction pattern (Fig. 2(b)) suggest that the obtained CNTs possess crystalline Fe particles.
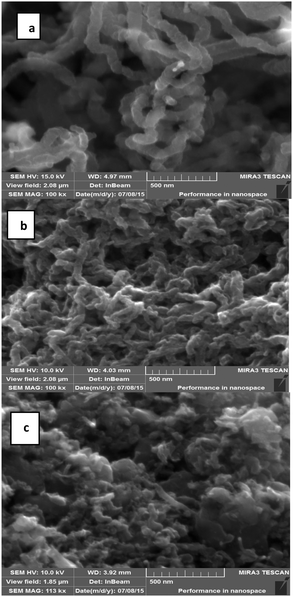 |
| | Fig. 1 SEM images of (a) CNT-plain, (b) CNT-OX and (c) CNT-TBP. | |
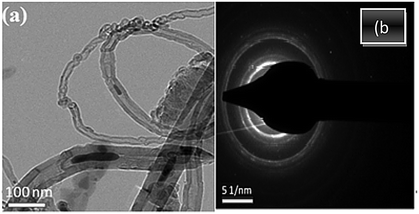 |
| | Fig. 2 TEM images of CNT-plain at (a) 100 nm magnification and (b) electronic diffraction spectra. | |
3.1.2 FTIR analysis of the prepared sorbents.
FTIR spectra of CNT-plain, CNT-OX and CNT-TBP are shown in Fig. 3. A broad peak at ∼3430 cm−1 is due to the O–H stretch frequency of the hydroxyl group (Fig. 3). The spectra of CNT-OX show peaks at 1720 cm−1 and 1185 cm−1, which are associated with the asymmetric C![[double bond, length as m-dash]](https://www.rsc.org/images/entities/char_e001.gif) O and C–O stretching band of the carboxylic acid (–COOH) group.15 The peak observed at 1574 cm−1 is related to the carboxylate anion stretch mode. The spectrum of CNT-TBP presents the C–H bond stretching at around 2960 cm−1 due to methyl groups on MWCNTs. The signal at 2852 cm−1 can be assigned to the symmetric stretching of –CH2– groups of the tributyl phosphate moiety. Furthermore, in CNT-TBP, the P
O and C–O stretching band of the carboxylic acid (–COOH) group.15 The peak observed at 1574 cm−1 is related to the carboxylate anion stretch mode. The spectrum of CNT-TBP presents the C–H bond stretching at around 2960 cm−1 due to methyl groups on MWCNTs. The signal at 2852 cm−1 can be assigned to the symmetric stretching of –CH2– groups of the tributyl phosphate moiety. Furthermore, in CNT-TBP, the P![[double bond, length as m-dash]](https://www.rsc.org/images/entities/char_e001.gif) O stretching vibration, occurred at 1269 cm−1. The P–O–C vibration occurred at 1027 cm−1,16 which proves the grafting of TBP on the CNT surface.
O stretching vibration, occurred at 1269 cm−1. The P–O–C vibration occurred at 1027 cm−1,16 which proves the grafting of TBP on the CNT surface.
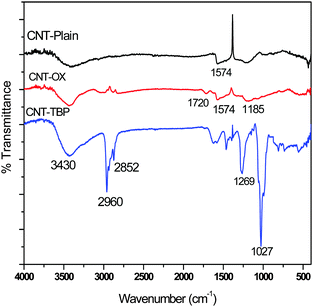 |
| | Fig. 3 FTIR spectra of CNT-plain, CNT-OX and CNT-TBP. | |
3.1.3 Surface area, pore volume and pore size distribution analysis using BET measurements.
The surface characteristics of the plain CNTs, CNT-OX and CNT-TBP were obtained by the standard BET method in a relative pressure range from 0.05 to 0.35. The nitrogen adsorption–desorption isotherm of CNT-plain is shown in Fig. 4. The material exhibited a type IV behaviour typical of a mesoporous material. The total pore volume, meso, micro and macro pore volumes, were calculated using Quantochrome's software. The surface characteristics of various sorbents prepared are listed in Table 1. It is evident from the data that the prepared sorbents possessed a small pore size and a large surface area which lead to strong confinement of the adsorbed analyte on the surface of the CNTs. Upon oxidation with nitric acid, the specific surface area increased from 99.8 m2 g−1 to 111.9 m2 g−1, which could be attributed to the opening of pores. Further CNT-TBP exhibited a marginal decrease in the surface area which is due to the anchoring of the TBP ligand.
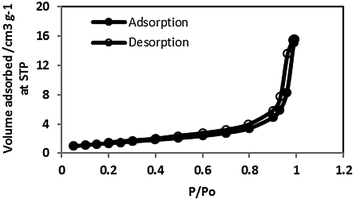 |
| | Fig. 4 Nitrogen adsorption isotherm of CNT-plain. | |
Table 1 Surface characteristics of various prepared CNTs
| Adsorbent |
Surface area (m2 g−1) |
Average diameter (nm) |
Total pore volume (cm3 g−1) |
Pore volume (cm3 g−1) |
| Meso |
Micro |
| CNT-plain |
99.81 |
14.67 |
0.3661 |
0.4280 |
0.0048 |
| CNT-OX |
111.89 |
10.52 |
0.2943 |
0.1681 |
0.0049 |
| CNT-TBP |
102.77 |
18.90 |
0.4861 |
0.4197 |
0.0043 |
3.2 Mechanism of interaction between the sorbent and the sorbate using XPS and FTIR studies
To study the interaction of U(VI) with CNT-TBP, XPS spectra were recorded for CNT-TB and CNT-TBP-U. Fig. 5 illustrates the O 1s, C 1s, P 2p and U 4f spectra. Uranium loading is observed in CNT-TBP-U evidenced by the appearance of doublet peaks of U 4f5/2 and U 4f7/2 with a splitting value of 10.72 eV. Table 2 depicts the binding energies of O 1s, C 1s, P 2p and the splitting values of the U(VI) spectra. To get a further insight into the U(VI) sorption, the core level scans for C 1s, O 1s, P 2p, and U 4f on CNT-TBP and CNT-TBP-U were analyzed.
Table 2 Binding energies (eV) of CNT-TBP before and after uranium sorption
| Adsorbent |
C 1s |
O 1s |
P 2p |
U 4f5/2 |
U 4f7/2 |
Splitting value |
| CNT-TBP |
284.55 |
532.02 |
133.76 |
— |
— |
|
| CNT-TBP-U |
283.65 |
532.47 |
133.97 |
392.87 |
382.15 |
10.72 |
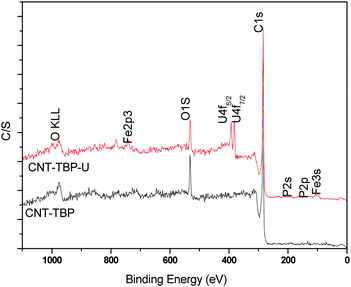 |
| | Fig. 5 XPS survey scans of plain and U(VI) loaded CNT-TBP systems. | |
Table 3 Molecular level binding energies of CNT-TBP and CNT-TBP-U systems
| Core levels |
CNT-TBP |
CNT-TBP-U |
|
|
Binding energy (eV) |
FWHW (eV) |
Area |
Binding energy (eV) |
FWHW (eV) |
Area |
| C 1s |
285.06 |
0.674 |
1575.04 |
285.87 |
1.25 |
1202.25 |
| 284.58 |
0.440 |
3307.22 |
284.91 |
0.61 |
1725.39 |
| 284.25 |
0.484 |
7563.98 |
284.16 |
0.45 |
4136.41 |
| 286.03 |
1.590 |
1971.61 |
284.46 |
0.43 |
3907.03 |
|
|
| O 1s |
531.54 |
2.318 |
3263.12 |
531.06 |
1.51 |
1944.42 |
| 533.56 |
0.890 |
241.96 |
533.21 |
1.07 |
529.58 |
| 532.87 |
1.073 |
839.65 |
531.76 |
1.79 |
211.65 |
|
|
|
|
532.29 |
1.22 |
717.02 |
|
|
| P 2p |
133.40 |
1.184 |
148.30 |
133.95 |
1.41 |
121.28 |
| 134.30 |
1.099 |
82.31 |
134.52 |
1.50 |
12.60 |
| — |
— |
— |
133.12 |
0.87 |
38.65 |
|
|
| U 4f7/2 |
— |
— |
— |
381.05 |
1.72 |
990.30 |
| — |
— |
— |
382.13 |
1.91 |
1717.22 |
The O 1s and C 1s spectra of CNT-TBP and CNT-TBP-U are shown in Fig. 6. The peak fitting results of the C 1s, O 1s, P 2p, U 4f, before and after U(VI) loading on CNT-TBP are shown in Table 2. From Fig. 6a, the three main components of the O 1s spectra occurred at 531.54, 533.56 and 532.87 eV, respectively, corresponding to C![[double bond, length as m-dash]](https://www.rsc.org/images/entities/char_e001.gif) O, O–C
O, O–C![[double bond, length as m-dash]](https://www.rsc.org/images/entities/char_e001.gif) O and C–O–C, C–O–OH, C–OH17 and C–O–P.18 Thus the data confirm the grafting of the TBP ligand onto the CNT surface. After U(VI) loading (Fig. 6b), peaks occurred at 531.06, 532.21, 531.76, and 532.29 eV. The presence of the U
O and C–O–C, C–O–OH, C–OH17 and C–O–P.18 Thus the data confirm the grafting of the TBP ligand onto the CNT surface. After U(VI) loading (Fig. 6b), peaks occurred at 531.06, 532.21, 531.76, and 532.29 eV. The presence of the U![[double bond, length as m-dash]](https://www.rsc.org/images/entities/char_e001.gif) O bond is confirmed by the appearance of an additional peak after U(VI) sorption.19,20 Furthermore, after U(VI) adsorption O 1s binding energies were shifted to lower values. This further confirms that complexation occurs between the oxygen-containing tributyl phosphate groups and uranyl ions during adsorption.
O bond is confirmed by the appearance of an additional peak after U(VI) sorption.19,20 Furthermore, after U(VI) adsorption O 1s binding energies were shifted to lower values. This further confirms that complexation occurs between the oxygen-containing tributyl phosphate groups and uranyl ions during adsorption.
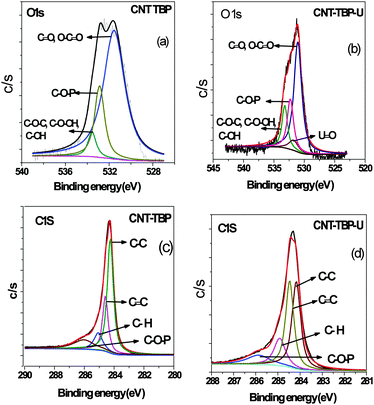 |
| | Fig. 6 Curve fitted high resolution scans of (a) O 1s of CNT-TBP, (b) O 1s of CNT-TBP-U, (c) C1s of CNT-TBP and (d) C 1s of CNT-TBP-U. | |
Fig. 6c and d shows the molecular level C 1s of CNT-TBP and CNT-TBP-U respectively. The four individual component peaks of C 1s occurred at 284.25, 284.58, 285.06 and 286.03 eV corresponding to C–C, C![[double bond, length as m-dash]](https://www.rsc.org/images/entities/char_e001.gif) C, C–H and C–O–P17,18 bonds respectively. After uranyl adsorption the peaks shifted to lower binding energies owing to the complexation of the tributyl phosphate group and U(VI) ions.
C, C–H and C–O–P17,18 bonds respectively. After uranyl adsorption the peaks shifted to lower binding energies owing to the complexation of the tributyl phosphate group and U(VI) ions.
Fig. 7a and b denotes the P 2p spectra of CNT-TBP before and after loading U(VI) respectively. In CNT-TBP, the binding energy of the P 2p3/2 component was found at 134.3 eV: the P 2p spectrum is a convolution of the P 2p1/2 and P 2p3/2 peaks that were resolved, keeping their branching ratio and their difference equal to 0.9 and 1.8 eV, respectively. After uranium sorption (Fig. 7b) the shifting of peaks to higher binding energies was observed. Additionally a new peak was observed at 133.21 eV, which could be attributed to the P–O–U bond.
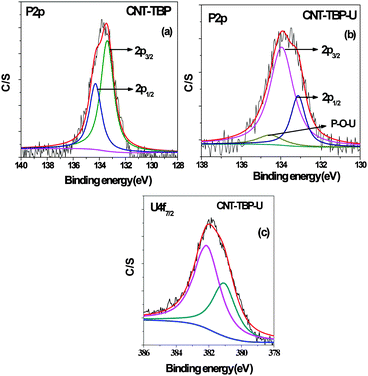 |
| | Fig. 7 Curve fitted high resolution scans of (a) P 2p of CNT-TBP (b) P 2p of CNT-TBP-U (c) U 4f7/2 of CNT-TBP-U. | |
The U 4f7/2 spectrum (Fig. 7c) was deconvoluted into two components: the peak corresponding to the free uranyl ion that occurred at 381.05 eV and the peak of covalently bonded oxygen and U(VI) that occurred at 382.13 eV (Table 3).
From the above discussion it is clear that the TBP ligand is grafted onto CNTs and complexation of uranyl ions occurred with the phosphoryl group of the tributyl phosphate ligand.
Infra red spectra of CNT-TBP before and after U(VI) sorption are shown in Fig. 8. It is evident from the figure that, after U(VI) sorption, a shift in P![[double bond, length as m-dash]](https://www.rsc.org/images/entities/char_e001.gif) O vibration band to 1110 cm−1 was observed. This could be attributed to the coordination of UO22+ cations with the P–O bond of the TBP molecule. The shift of the P
O vibration band to 1110 cm−1 was observed. This could be attributed to the coordination of UO22+ cations with the P–O bond of the TBP molecule. The shift of the P![[double bond, length as m-dash]](https://www.rsc.org/images/entities/char_e001.gif) O frequency after U(VI) sorption was about 82 cm−1, and the magnitude of the frequency shift obtained was consistent with other uranyl complexes with organophosphorus ligands.21,22 The mode of nitrate complexation to the metal ion can be determined by the separation Δν of the symmetric ν1 and asymmetric ν2 NO2 stretching frequencies.23–25 A Δν value >186 cm−1 indicates a bidentate chelate environment, while a value ≤115 cm−1 indicates a monodentate coordination. It is evident from the spectra that Δν = 270 cm−1 (ν1 at 1300 cm−1 and ν2 at 1530 cm−1) was obtained which indicated a bidentate chelation of the nitrate ion to the uranyl ion. Further an additional vibration occurred at 950 cm−1 which could be assigned to the asymmetric stretching frequency of the U
O frequency after U(VI) sorption was about 82 cm−1, and the magnitude of the frequency shift obtained was consistent with other uranyl complexes with organophosphorus ligands.21,22 The mode of nitrate complexation to the metal ion can be determined by the separation Δν of the symmetric ν1 and asymmetric ν2 NO2 stretching frequencies.23–25 A Δν value >186 cm−1 indicates a bidentate chelate environment, while a value ≤115 cm−1 indicates a monodentate coordination. It is evident from the spectra that Δν = 270 cm−1 (ν1 at 1300 cm−1 and ν2 at 1530 cm−1) was obtained which indicated a bidentate chelation of the nitrate ion to the uranyl ion. Further an additional vibration occurred at 950 cm−1 which could be assigned to the asymmetric stretching frequency of the U![[double bond, length as m-dash]](https://www.rsc.org/images/entities/char_e001.gif) O bond.26 Based on the above discussions the following reaction scheme has been proposed (Scheme 2) for the sorption of the uranyl ion and CNT-TBP.
O bond.26 Based on the above discussions the following reaction scheme has been proposed (Scheme 2) for the sorption of the uranyl ion and CNT-TBP.
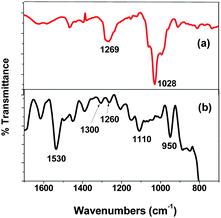 |
| | Fig. 8 FTIR scans of (a) CNT-TBP and (b) CNT-TBP-U. | |
 |
| | Scheme 2 Schematic representation of U(VI) loading on CNT-TBP. | |
3.3 The effect of initial pH on sorption
The initial pH of the solution containing 100 mg L−1 of uranyl ions was varied from 2 to 8 and equilibrium experiments were carried out (Fig. 9). The amount of uranyl ions adsorbed increased from pH 4 to 6 and a further increase in pH resulted in decreased sorption. The adsorption trends observed over the pH range studied could be assigned to the distribution of various uranyl species. It is well known that at pH values ≤3, UO22+ is the predominant species11 and in the pH range of 4.0–9.0 hydrolysis of U(VI) occurred and other uranyl complexes, including UO2(OH)+, (UO2)2(OH)22+ and (UO2)3(OH)5+27 were prevalent. However at pH values >7.0 anionic uranyl species (UO2)3(OH)7− also coexisted.28 The lower adsorption rate of uranyl ions at pH values <4 could be attributed to the competition of protons for the active surface of CNTs. Thus adsorption of uranyl ions was found to be maximum at around pH 5 for CNT-TBP and at pH 6 for CNT-OX and CNT plain. At pH > 7 negatively charged uranyl complexes were repelled by the negative surface charge of the sorbent thus resulting in a lower capacity. Due to functionalization of the TBP ligand onto CNTs the amount of uranyl ions adsorbed was found to be higher for CNT-TBP compared to plain and oxidized CNTs.
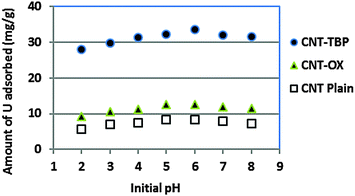 |
| | Fig. 9 Effect of initial pH on sorption of U(VI) with CNT-plain, CNT-OX and CNT-TBP. | |
3.4 Kinetics of sorption
The adsorption of an aqueous solution containing U(VI) on CNT-plain, CNT-OX and CNT-TBP was carried out at pH 5.0 ± 0.1 to investigate the kinetics of sorption. Fig. 10a shows the adsorption process on various sorbents for U(VI) removal. A contact time of 3.0 h was sufficient for the adsorption of uranyl ions onto CNT-TBP to reach equilibrium. However, CNT-plain and CNT-OX reach equilibrium at 3.5 h. The kinetics of U(VI) adsorption onto all the sorbents prepared were modelled using the Lagergren model29 or using pseudo first order, second order30 or pseudo second order models31 as shown in the following equations:| |  | (2) |
| |  | (3) |
| |  | (4) |
where kL is the Lagergren rate constant of sorption (min−1); k2 the second-order rate (g mg−1 min−1) and k2′ the pseudo-second-order rate constant of sorption (g mg−1 min−1); qe and qt are the amounts of uranyl ions sorbed (mg g−1) at equilibrium and at a given time t, respectively. The kinetic model plots are shown in Fig. 10b–d. From Table 4, it is evident that among various models, a pseudo second order plot of t/qtvs. t (Fig. 10d) yielded a regression coefficient >0.978. Thus, it could be concluded that the adsorption of uranyl ions with the prepared sorbents followed a pseudo second order kinetic model. Furthermore, the Weber and Morris model32 describes the intraparticle diffusion between the sorbent and the sorbate. This model correlates the amount of the solute adsorbed and the intraparticle diffusion rate constant (kint) given by the following equation:| |  | (5) |
It is evident from Fig. 10e that the plot of qtvs. yields an intercept and this confirms that in addition to intraparticle diffusion, chemisorptions could also be involved. The values obtained from this model are presented in Table 4.
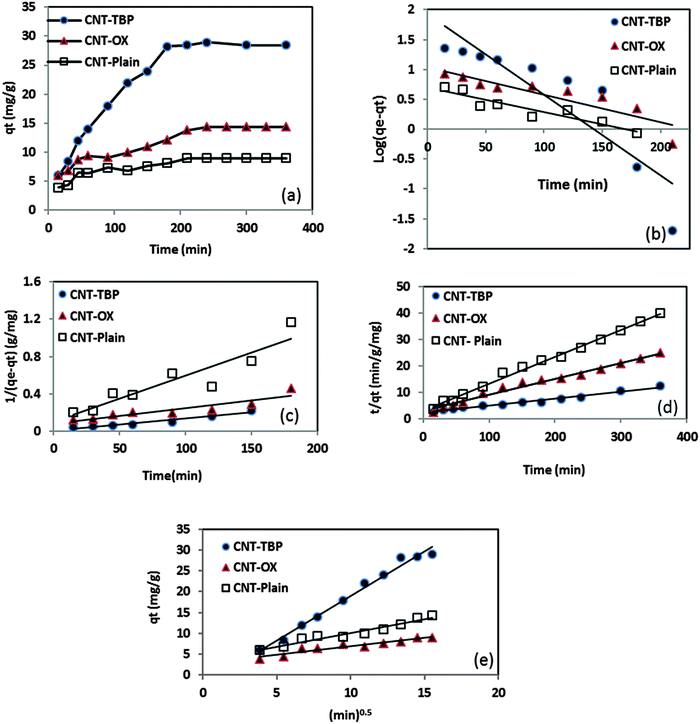 |
| | Fig. 10 (a) Equilibration time, (b) pseudo first order kinetics, (c) second order kinetics, (d) pseudo second order kinetics and (e) Web–Morris model of CNT-TBP and U(VI). | |
Table 4 Kinetic rate constants of the sorption of U(VI) by various CNTs
| Adsorbent |
Pseudo first order |
Second order |
Pseudo second order |
Web-Morris model |
|
K
l (min−1) |
R
2
|
k
2 (mg g −1 min−1) |
R
2
|
k
2′ (mg−1 g−1 min−1) |
R
2
|
k
int (mg−1 g−1 min−0.5) |
R
2
|
| CNT-plain |
0.877 |
0.870 |
0.001 |
0.844 |
0.0031 |
0.994 |
0.670 |
0.945 |
| CNT-OX |
0.004 |
0.803 |
0.005 |
0.859 |
0.0012 |
0.981 |
0.409 |
0.906 |
| CNT-TBP |
0.013 |
0.800 |
0.001 |
0.926 |
0.0003 |
0.978 |
2.147 |
0.986 |
3.5 Equilibrium studies
Sorption data of uranyl ions with various CNTs were modelled using commonly used isotherms (Fig. 11). The Langmuir model describes the monolayer adsorption and equivalency of the surface adsorption sites. The linear Langmuir model33 could be expressed as| |  | (6) |
where Ce is the equilibrium concentration (mg L−1) and qe is the amount of U(VI) sorbed (mg g−1) at equilibrium. The empirical constants b and qm denote the energy of adsorption and the maximum adsorption capacity, respectively. The results obtained for the various model parameters are listed in Table 5. The Langmuir adsorption capacity of the prepared adsorbents towards uranyl ions was in the order of CNT-TBP > CNT-OX > CNT-plain. The adsorption capacity of CNT-TBP was found to be 2.5 times higher than the plain CNTs. The complexing ability of the TBP ligand towards U(VI) resulted in an increased sorption capacity. A comparison of the prepared adsorbents with other functionalized CNTs reported in the literature is given in Table 6. For example, the capacity obtained for CNT-TBP is higher than plain oxidized MWCNTs28 (43.30 mg g−1), diglycolamide functionalized MWCNTs34 (133.7 mg g−1), carboxymethyl cellulose grafted CNTs35 (112.0 mg g−1), imine functionalized carbon spheres36 (113 mg g−1) and palm shell activated carbon37 (51.81 mg g−1). A comparison of the adsorption capacities of various functionalized CNTs is given in Table 6. The linear Freundlich model is represented below38| |  | (7) |
KF and nF represent the sorption intensity and sorption capacity, respectively. Values of “nF” ranging between 1 and 10 indicate a good adsorbent. In the present study (Table 5) the ‘n’ values ranged between 1.445 and 1.835. This signifies the good adsorption capabilities of CNT, CNT-OX and CNT-TBP towards the uranyl ion.
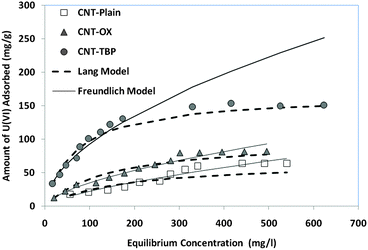 |
| | Fig. 11 Adsorption isotherms of various adsorbents with U(VI). | |
Table 5 Isotherm parameters of CNT-plain, CNT-OX and CNT-TBP
| Adsorbent |
Langmuir model |
Freundlich model |
|
q
max (mg g−1) |
b (L mg−1) |
R
−2
|
K
F (L g−1) |
n
F
|
R
2
|
| CNT-plain |
66.66 |
0.0057 |
0.845 |
0.918 |
1.445 |
0.926 |
| CNT-OX |
100.00 |
0.0223 |
0.985 |
2.138 |
1.645 |
0.981 |
| CNT-TBP |
166.66 |
0.0142 |
0.972 |
7.533 |
1.835 |
0.964 |
Table 6 Comparison of the maximum adsorption capacities of various functionalized CNTs towards U(VI) removal
| Adsorbent |
Maximum adsorption capacity (mg g−1) |
Reference |
| Plasma functionalized MWCNTs |
66.16 |
39
|
| Oxidized MWCNTs |
43.30 |
28
|
| Diglycolamide functionalized MWCNTs |
133.70 |
34
|
| Oxidized MWCNTs |
33.30 |
10
|
| Carboxymethyl cellulose functionalized CNTs |
112.00 |
35
|
| Oxidized MWCNTs |
45.90 |
11
|
| Graphene oxide-CNTs |
100.0 |
40
|
| Amidoxime-CNTs |
145.0 |
41
|
| Montmorillonite@C |
20.76 |
42
|
| CoFe2O4/MWCNTs |
212.7 |
43
|
| CNT-plain |
66.66 |
Present work |
| CNT-OX |
100.00 |
Present work |
| CNT-TBP |
166.66 |
Present work |
3.6 Thermodynamic studies
The feasibility of adsorption was elucidated using thermodynamic parameters like ΔG°, ΔH° and ΔS° which were calculated using the adsorption data. Initially, the constant Kc was calculated using the ratio of U(VI) adsorbed onto the sorbent CA (g L−1) to that in the aqueous phase at equilibrium Ce (g l−1) given by the following equation:| |  | (8) |
Then, ΔG° was determined using the following equation:| | ΔG° = −RT![[thin space (1/6-em)]](https://www.rsc.org/images/entities/char_2009.gif) ln ln![[thin space (1/6-em)]](https://www.rsc.org/images/entities/char_2009.gif) Kc Kc | (9) |
where R is the gas constant and T is the temperature in Kelvin. Further, ΔS° and ΔH° were determined using the following Van't Hoff equation: | |  | (10) |
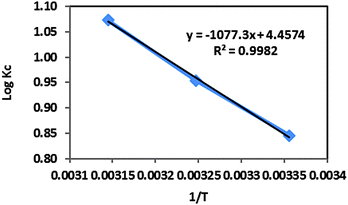
A plot of log![[thin space (1/6-em)]](https://www.rsc.org/images/entities/char_2009.gif) Kcvs. 1/T was obtained for the uranyl ions and the CNT-TBP system (Fig. 12). The thermodynamic parameters namely ΔH° and ΔS° were determined from the slope and intercept, respectively. Table 7 lists the values obtained for various thermodynamic parameters. The negative Gibbs free energy indicated the effectiveness and spontaneity of the sorption process. The endothermic nature of the adsorption process is revealed by the positive enthalpy (ΔH°) values. Positive entropy (ΔS°) values could be due to the dehydration of uranyl ions during adsorption.
Kcvs. 1/T was obtained for the uranyl ions and the CNT-TBP system (Fig. 12). The thermodynamic parameters namely ΔH° and ΔS° were determined from the slope and intercept, respectively. Table 7 lists the values obtained for various thermodynamic parameters. The negative Gibbs free energy indicated the effectiveness and spontaneity of the sorption process. The endothermic nature of the adsorption process is revealed by the positive enthalpy (ΔH°) values. Positive entropy (ΔS°) values could be due to the dehydration of uranyl ions during adsorption.
 |
| | Fig. 12 Thermodynamic studies of CNT-TBP and U(VI) systems. | |
Table 7 Thermodynamic parameters of CNT-TBP and U(VI)
| T (K) |
C
e (g L−1) |
K
c
|
Δ
G (KJ mol−1) |
Δ
S (J mol−1) |
ΔH [kJ (mol K)−1]−1 |
| 298 |
12.5 |
7.00 |
−4.81 |
|
|
| 308 |
10.0 |
9.00 |
−5.63 |
10.26 |
20.62 |
| 318 |
7.8 |
11.82 |
−6.53 |
|
|
3.7 Desorption and recyclability studies
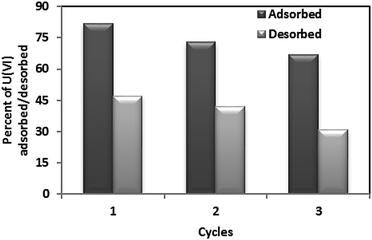
After adsorption of uranyl ions using CNT-TBP as a sorbent, desorption studies of uranium were conducted. It was found that 0.1 M HCl efficiently stripped adsorbed uranium ions. The amount of uranyl ions adsorbed and desorbed for three consecutive cycles using CNT-TBP as a sorbent is shown in Fig. 13. A decreased U(VI) uptake in the order of 11 and 20% were observed at the end of the 1st and 2nd cycles, respectively. Using ordered mesoporous carbon12 and functionalized activated carbon fibers9 as adsorbents similar results were observed.
 |
| | Fig. 13 Desorption and recyclability studies. | |
4. Conclusions
The chemical vapour deposition technique was used to synthesize carbon nanotubes using ferrocene in benzene as the hydrocarbon source. Ferrocene acted both as a floating catalyst and as a hydrocarbon source. Efficient functionalization was carried out by oxidation with nitric acid and grafting with the tributyl phosphate ligand. FTIR and XPS studies confirmed the presence of a phosphoryl group on CNT-TBP. A pseudo second order model was found to fit the experimental data. A Langmuir adsorption capacity of 166.6 mg g−1 was obtained for CNT-TBP with a high regression coefficient. Efficient complexation of U(VI) and the TBP ligand resulted in a high sorption capacity compared to CNT and CNT-OX. The spontaneity of the reaction was revealed by thermodynamic studies and desorption and recyclability studies were carried out for 3 cycles. FTIR and XPS showed the involvement of the phosphoryl group of the TBP ligand towards the interaction of uranium.
Acknowledgements
The funding received from the Board of Research in Nuclear Sciences, Department of Atomic Energy, Mumbai, India (Ref. No. 2013/36/57-BRNS/2482) to carry out this work is gratefully acknowledged.
References
- K. Sakr, M. S. Sayed and M. B. Hafez, J. Radioanal. Nucl. Chem., 2003, 256, 179 CrossRef CAS.
- T. Ozdemir and A. Usanmaz, Prog. Nucl. Energy, 2009, 51, 240 CrossRef.
- B. Allard, U. Olofsson and B. Torstenfelt, Inorg. Chim. Acta, 1984, 94, 205 CrossRef CAS.
-
G. M. Naja and B. Volesky, Toxicity and sources of heavy metals of Pb, Cd, Hg, Cr, As and radionucleides in the environment, CRC Press, Taylor and Francis Group, USA, 2009, p. 16 Search PubMed.
-
WHO, Guidelines for Drinking Water Quality, Geneva, 2nd edn, 1998, p. 283 Search PubMed.
- P. D. Bhalara, D. Punetha and K. Balasubramanian, J. Environ. Chem. Eng., 2014, 2, 1621 CrossRef CAS.
- M. Caccin, F. Giacobbo, M. Da Ros, L. Besozzi and M. Mariani, J. Radioanal. Nucl. Chem., 2013, 297, 9 CrossRef CAS.
- A. M. A. Morsy and A. E. M. Hussein, J. Radioanal. Nucl. Chem., 2011, 288, 341 CrossRef CAS.
- S. Mishra, J. Dwivedi, A. Kumar and N. Sankararamakrishnan, RSC Adv., 2015, 5, 33023 RSC.
- Y. Sun, S. Yang, G. Sheng, Z. Gua and X. Wang, J. Environ. Radioact., 2012, 105, 40 CrossRef CAS PubMed.
- A. Schierz and H. Zanker, Environ. Pollut., 2009, 157, 1088 CrossRef CAS PubMed.
- B.-W. Nie, Z.-B. Zhang, X.-H. Cao, Y.-H. Liu and P. Liang, J. Radioanal. Nucl. Chem., 2012, 295, 663 CrossRef.
- P. Giridhar, K. A. Venkatesan, T. G. Srinivasan and P. R. Vasudeva Rao, J. Radioanal. Nucl. Chem., 2005, 265, 31 CrossRef CAS.
- N. Sankararamakrishnan, D. Chauhan and J. Dwivedi, Chem. Eng. J., 2016, 284, 599 CrossRef CAS.
- B. Chen, Z. Zhu, J. Ma, Y. Qiu and J. Chen, J. Mater. Chem., 2013, 1, 11355 RSC.
- M. Alibrahim and H. Shlewit, Period. Polytech., Chem. Eng., 2007, 51, 57 CrossRef CAS.
- V. Datsyuk, M. Kalyva, K. Papagelis, J. Parthenios, D. Tasis, A. Siokou, I. Kallitsisc and C. Galiotis, Carbon, 2008, 46, 833 CrossRef CAS.
- A. Rossi, F. M. Pirasa, D. Kim, A. J. Gellman and N. D. Spencer, Tribol. Lett., 2006, 23, 197 CrossRef CAS.
- S. Van den Berghe, F. Miserque, T. Gouder, B. Gaudreau and M. Verwerft, J. Nucl. Mater., 2001, 294, 168 CrossRef CAS.
- S. Chen, J. Hong, H. Yang and J. Yang, J. Environ. Radioact., 2013, 126, 253 CrossRef CAS PubMed.
-
L. L. Burger, in Physical properties, Science and Technology of Tributyl phosphate, ed. W. W. Schulz and J. D. Navratil, CRC Press, Boca Raton, Florida, 1984, p. 26 Search PubMed.
- D. F. Peppard and J. R. Ferraro, J. Inorg. Nucl. Chem., 1959, 10, 275 CrossRef CAS.
- B. M. Gatehouse, S. E. Livingstone and R. S. Nyholm, Chem. Soc. Rev., 1959, 4222 Search PubMed.
- N. F. Curtis and Y. M. Curtis, J. Inorg. Chem., 1965, 4, 804 CrossRef CAS.
- J. R. Ferraro and D. F. Peppard, Nucl. Sci. Eng., 1963, 16, 389 CAS.
- K. W. Bagnall and M. W. Wakerley, J. Inorg. Nucl. Chem., 1975, 37, 329 CrossRef CAS.
- G. Wang, J. Liu, X. Wang, Z. Xie and N. Deng, J. Hazard. Mater., 2009, 168, 1053 CrossRef CAS PubMed.
- M. Wang, J. Qiu, X. Tao, C. Wu, W. Cui, Q. Liu and S. Lu, J. Radioanal. Nucl. Chem., 2011, 288, 895 CrossRef CAS.
- S. Lagergren, K. Sven. Vetenskapsakad. Handl., 1898, 24, 1–39 Search PubMed.
- Y. S. Ho, D. A. J. Wase and C. F. Forster, Environ. Technol., 1996, 17, 71 CrossRef CAS.
-
Y. S. Ho and G. McKay, Advances in Adsorption Separation Science and Technology, South China University of Technology Press, Guangzhou, 1997, 257 Search PubMed.
- W. J. Weber and J. C. Morris, J. Sanit. Eng. Div., Am. Soc. Civ. Eng., 1963, 89, 31 Search PubMed.
- I. Langmuir, J. Am. Chem. Soc., 1918, 40, 1361 CrossRef CAS.
- A. K. S. Deb, P. Ilaiyaraja, D. Ponraju and B. Venkatraman, J. Radioanal. Nucl. Chem., 2012, 291, 877 CrossRef CAS.
- D. Shao, Z. Jiang, X. Wang, J. Li and Y. Meng, J. Phys. Chem. B, 2009, 113, 860 CrossRef CAS PubMed.
- P. S. Dubey, D. A. Dwivedi, M. Sillanpaa, Y.-N. Kwon and C. Lee, RSC Adv., 2014, 4, 46114 RSC.
- Z.-J. Yi, J. Yao, J.-S. Xu, M.-S. Chen, W. Li, H.-L. Chen and F. Wang, J. Radioanal. Nucl. Chem., 2014, 301, 695 CrossRef CAS.
- H. M. F. Freundlich, J. Phys. Chem., 1906, 57, 385 CAS.
- M. Song, Q. Wang and Y. Meng, J. Radioanal. Nucl. Chem., 2012, 293, 899 CrossRef CAS.
- Z. Gu, Y. Wang, J. Tang, J. yang, J. Liao, Y. Yang and N. Liu, J. Radioanal. Nucl. Chem., 2015, 303, 1835 CrossRef CAS.
- Y. Wang, Z. Gu, J. Yang, J. Liao, Y. Yang, N. Liu and J. Tang, Appl. Surf. Sci., 2014, 320, 10 CrossRef CAS.
- R. Zhang, C. Chen, J. Li and X. Wang, Appl. Surf. Sci., 2015, 349, 129 CrossRef CAS.
- L. Tan, Q. Liu, X. Jing, J. Liu, D. Song, S. Hu, L. Liu and J. Wang, Chem. Eng. J., 2015, 273, 307 CrossRef CAS.
|
| This journal is © The Royal Society of Chemistry and the Centre National de la Recherche Scientifique 2016 |
Click here to see how this site uses Cookies. View our privacy policy here.  Open Access Article
![[double bond, length as m-dash]](https://www.rsc.org/images/entities/char_e001.gif) O and C–O stretching band of the carboxylic acid (–COOH) group.15 The peak observed at 1574 cm−1 is related to the carboxylate anion stretch mode. The spectrum of CNT-TBP presents the C–H bond stretching at around 2960 cm−1 due to methyl groups on MWCNTs. The signal at 2852 cm−1 can be assigned to the symmetric stretching of –CH2– groups of the tributyl phosphate moiety. Furthermore, in CNT-TBP, the P
O and C–O stretching band of the carboxylic acid (–COOH) group.15 The peak observed at 1574 cm−1 is related to the carboxylate anion stretch mode. The spectrum of CNT-TBP presents the C–H bond stretching at around 2960 cm−1 due to methyl groups on MWCNTs. The signal at 2852 cm−1 can be assigned to the symmetric stretching of –CH2– groups of the tributyl phosphate moiety. Furthermore, in CNT-TBP, the P![[double bond, length as m-dash]](https://www.rsc.org/images/entities/char_e001.gif) O stretching vibration, occurred at 1269 cm−1. The P–O–C vibration occurred at 1027 cm−1,16 which proves the grafting of TBP on the CNT surface.
O stretching vibration, occurred at 1269 cm−1. The P–O–C vibration occurred at 1027 cm−1,16 which proves the grafting of TBP on the CNT surface.
![[double bond, length as m-dash]](https://www.rsc.org/images/entities/char_e001.gif) O, O–C
O, O–C![[double bond, length as m-dash]](https://www.rsc.org/images/entities/char_e001.gif) O and C–O–C, C–O–OH, C–OH17 and C–O–P.18 Thus the data confirm the grafting of the TBP ligand onto the CNT surface. After U(VI) loading (Fig. 6b), peaks occurred at 531.06, 532.21, 531.76, and 532.29 eV. The presence of the U
O and C–O–C, C–O–OH, C–OH17 and C–O–P.18 Thus the data confirm the grafting of the TBP ligand onto the CNT surface. After U(VI) loading (Fig. 6b), peaks occurred at 531.06, 532.21, 531.76, and 532.29 eV. The presence of the U![[double bond, length as m-dash]](https://www.rsc.org/images/entities/char_e001.gif) O bond is confirmed by the appearance of an additional peak after U(VI) sorption.19,20 Furthermore, after U(VI) adsorption O 1s binding energies were shifted to lower values. This further confirms that complexation occurs between the oxygen-containing tributyl phosphate groups and uranyl ions during adsorption.
O bond is confirmed by the appearance of an additional peak after U(VI) sorption.19,20 Furthermore, after U(VI) adsorption O 1s binding energies were shifted to lower values. This further confirms that complexation occurs between the oxygen-containing tributyl phosphate groups and uranyl ions during adsorption.
![[double bond, length as m-dash]](https://www.rsc.org/images/entities/char_e001.gif) C, C–H and C–O–P17,18 bonds respectively. After uranyl adsorption the peaks shifted to lower binding energies owing to the complexation of the tributyl phosphate group and U(VI) ions.
C, C–H and C–O–P17,18 bonds respectively. After uranyl adsorption the peaks shifted to lower binding energies owing to the complexation of the tributyl phosphate group and U(VI) ions.
![[double bond, length as m-dash]](https://www.rsc.org/images/entities/char_e001.gif) O vibration band to 1110 cm−1 was observed. This could be attributed to the coordination of UO22+ cations with the P–O bond of the TBP molecule. The shift of the P
O vibration band to 1110 cm−1 was observed. This could be attributed to the coordination of UO22+ cations with the P–O bond of the TBP molecule. The shift of the P![[double bond, length as m-dash]](https://www.rsc.org/images/entities/char_e001.gif) O frequency after U(VI) sorption was about 82 cm−1, and the magnitude of the frequency shift obtained was consistent with other uranyl complexes with organophosphorus ligands.21,22 The mode of nitrate complexation to the metal ion can be determined by the separation Δν of the symmetric ν1 and asymmetric ν2 NO2 stretching frequencies.23–25 A Δν value >186 cm−1 indicates a bidentate chelate environment, while a value ≤115 cm−1 indicates a monodentate coordination. It is evident from the spectra that Δν = 270 cm−1 (ν1 at 1300 cm−1 and ν2 at 1530 cm−1) was obtained which indicated a bidentate chelation of the nitrate ion to the uranyl ion. Further an additional vibration occurred at 950 cm−1 which could be assigned to the asymmetric stretching frequency of the U
O frequency after U(VI) sorption was about 82 cm−1, and the magnitude of the frequency shift obtained was consistent with other uranyl complexes with organophosphorus ligands.21,22 The mode of nitrate complexation to the metal ion can be determined by the separation Δν of the symmetric ν1 and asymmetric ν2 NO2 stretching frequencies.23–25 A Δν value >186 cm−1 indicates a bidentate chelate environment, while a value ≤115 cm−1 indicates a monodentate coordination. It is evident from the spectra that Δν = 270 cm−1 (ν1 at 1300 cm−1 and ν2 at 1530 cm−1) was obtained which indicated a bidentate chelation of the nitrate ion to the uranyl ion. Further an additional vibration occurred at 950 cm−1 which could be assigned to the asymmetric stretching frequency of the U![[double bond, length as m-dash]](https://www.rsc.org/images/entities/char_e001.gif) O bond.26 Based on the above discussions the following reaction scheme has been proposed (Scheme 2) for the sorption of the uranyl ion and CNT-TBP.
O bond.26 Based on the above discussions the following reaction scheme has been proposed (Scheme 2) for the sorption of the uranyl ion and CNT-TBP.


 yields an intercept and this confirms that in addition to intraparticle diffusion, chemisorptions could also be involved. The values obtained from this model are presented in Table 4.


![[thin space (1/6-em)]](https://www.rsc.org/images/entities/char_2009.gif) ln
ln![[thin space (1/6-em)]](https://www.rsc.org/images/entities/char_2009.gif) Kc
Kc
![[thin space (1/6-em)]](https://www.rsc.org/images/entities/char_2009.gif) Kcvs. 1/T was obtained for the uranyl ions and the CNT-TBP system (Fig. 12). The thermodynamic parameters namely ΔH° and ΔS° were determined from the slope and intercept, respectively. Table 7 lists the values obtained for various thermodynamic parameters. The negative Gibbs free energy indicated the effectiveness and spontaneity of the sorption process. The endothermic nature of the adsorption process is revealed by the positive enthalpy (ΔH°) values. Positive entropy (ΔS°) values could be due to the dehydration of uranyl ions during adsorption.
Kcvs. 1/T was obtained for the uranyl ions and the CNT-TBP system (Fig. 12). The thermodynamic parameters namely ΔH° and ΔS° were determined from the slope and intercept, respectively. Table 7 lists the values obtained for various thermodynamic parameters. The negative Gibbs free energy indicated the effectiveness and spontaneity of the sorption process. The endothermic nature of the adsorption process is revealed by the positive enthalpy (ΔH°) values. Positive entropy (ΔS°) values could be due to the dehydration of uranyl ions during adsorption.


